Plasmid construction
The Exe4 gene was codon-optimized using the GeneSmart codon optimization tool (https://www.genscript.com/gensmart-free-gene-codon-optimization.html) based on the amino acid sequence in existing publication (Supplementary Table 1). To construct expression vectors for the secretion of Exe4, double-stranded DNAs of Exe4 fused with signal peptides (SPs) and furin-cleavable sequences were synthesized (Azenta) and inserted into a CAG promoter-containing pCAG backbone vector using the In-Fusion HD cloning kit (Takara Bio). The 20 bp genomic sgRNA target sequence with a 3 bp PAM (underlined) used in this study is shown as follows: sgAlb-E14 (GTTGTGATGTGTTTAGGCTAAGG), targeting exon 14 of the mouse Albumin (Alb) locus. Notably, this sgRNA enabled efficient on-target integration with no noticeable off-target editing in the context of in vivo knock-in, as demonstrated in a previous study20. The sgAlb-E14 sequence was inserted into the AflII (NEB) site of the gRNA_Cloning Vector (Addgene, #41824) using the In-Fusion HD cloning kit. The structure of the HITI donor plasmid followed the previous report5. In brief, for the HITI donor vector containing the sgAlb-E14 expression cassette and scExe4 donor fragment, the sgAlb-E14 expression cassette and scExe4 (NGF-FCS2-Exe4) sequence flanked by two sgAlb-E14 gRNA target sequences were prepared by PCR using PrimeSTAR GXL polymerase (Takara Bio). These fragments were subcloned into the MluI (NEB) site of the HITI backbone vector (Addgene, #87116) using the In-Fusion HD cloning kit. The size of scExe4 donor plasmid and P2A-scExe4 fragment to be inserted are 6774 bp and 551 bp, respectively. To construct the SpCas9 expression vector (referred to as the Cas9 plasmid), the Cas9 DNA fragment was amplified from hCas9 (Addgene #41815) and inserted into a CMV promoter-containing pCMV backbone vector using the In-Fusion HD cloning kit. The size of Cas9 plasmid is 7859 bp. For the NanoLuc expression vector (NanoLuc plasmid), CMV DNA fragment was amplified from the Cas9 plasmid and replaced with the PGK promoter in the pNL1.1.PGK[Nluc_PGK] Vector (Promega) using the In-Fusion HD cloning kit. All constructs were confirmed by Sanger sequencing. The related sequences are listed in Supplementary Table 2.
Cell lines
Hepa1-6 (mouse hepatocarcinoma cell line) and HepG2 (human hepatocarcinoma cell line) were purchased from KAC and cultured in DMEM (Wako) containing 10% FBS (Biowest). iGL cells, used for the evaluation of glucose-stimulated insulin secretion (GSIS), were purchased from CosmoBio and cultured in RPMI-1640 (Wako) containing 10% FBS. Cell line authentications have been checked by STR analysis. Mycoplasma contamination was checked every 2 months and was found to be negative in all cell lines used.
Animals
All animal procedures were conducted in accordance with the guidelines of the Osaka University Animal Care and Use Committee and received approval from the committee. Mice were housed individually in an approved, ventilation-controlled facility with a 12-h light/dark cycle, at room temperature, and had free access to food and water. Efforts were made to minimize animal use and discomfort. Eight-week-old female Balb/c mice (Oriental Yeast) were utilized for in vivo transfection and knock-in experiments. Female mice were selected to reduce the likelihood of aggression-related stress, which is more frequently observed in group-housed males and may confound metabolic outcomes. Diet-induced obesity (DIO) mice were generated by starting a high-fat diet (HFD-60, lipid 60 kcal%, Oriental Yeast) feeding for C57B6J (B6) mice (Oriental Yeast) at six weeks of age. The pharmacodynamic study was initiated when the mice reached the average body weight around 22 g (around 10 weeks of age). Mice were non-randomly assigned to treatment groups while ensuring that initial body weights were balanced across groups to minimize variability. All animals were maintained under identical housing, handling, and dietary conditions, except for experimental treatments. No animals were excluded from analysis. Blinding was not applied during experiments or data analysis. However, outcome measurements such as ELISA, PCR, and glucose tolerance tests were conducted using objective, quantitative methods with standardized instruments to minimize potential bias. Sample sizes were determined with reference to previously published studies in related fields employing comparable experimental designs and endpoints. Based on this, n = 3–4 mice per group was considered appropriate to detect treatment-associated trends while complying with ethical principles for animal research.
ELISA for Exe4 concentration measurement
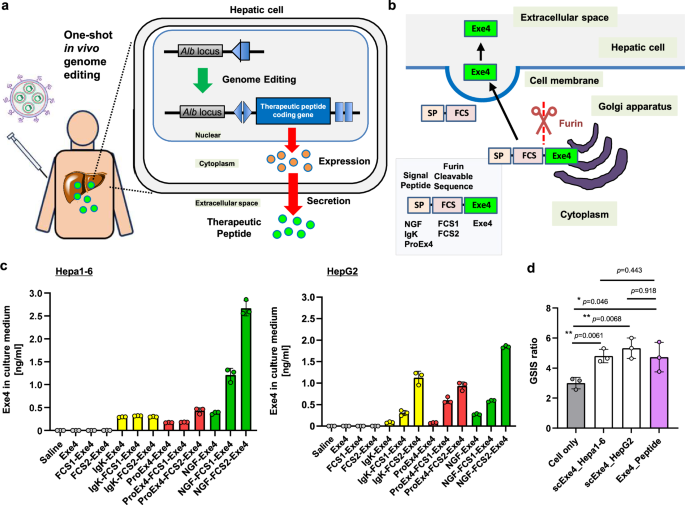
Exe4 concentration in the culture medium and mice plasma was measured using the Exendin-4 ELISA kit (Abcam) according to the manufacture’s protocol. Absorbance at 450 nm was measured using a plate reader (Synergy HTX).
Exe4 secretion in hepatocyte-derived cell lines
A series of Exe secretion plasmids containing various SP and FCS (each 1 μg) were transfected into Hepa1-6 and HepG2 cells in 12-well plates using Lipofectamine 3000 (Invitrogen) according to the manufacture’s protocol. One day after transfection, the cells were washed and then incubated for an additional two days. The cell culture medium was subsequently collected, and the Exe4 concentration was measured using the Exendin-4 ELISA kit.
Glucose stimulated insulin secretion (GSIS)
Culture medium containing Exe4 was obtained from Hepa1-6 cells and HepG2 cells transfected with a plasmid expressing NGF-FCS2-Exe4 (referred to as scExe4_Hepa1-6 and scExe4_HepG2, respectively). Additionally, a synthetic Exe4 peptide solution (Wako) was prepared. iGL cells were exposed to different mediums: iGL cells culture medium (Cell only), iGL culture medium supplemented with synthetic Exe4 peptide (Exe4 solution) and with scExe4 peptide secreted from Hepa1-6 and HeG2 cells transfected with the scExe4 expression plasmid (scExe4_Hepa1-6 and scExe4_HepG2, respectively). The Exe4 concentrations in the culture medium for the synthetic Exe4 peptide solution, scExe4_Hepa1-6, and scExe4_HepG2 were 2.5 nM, 2.4 nM, and 2.5 nM, respectively. These media were incubated with iGL cells for 1 h at low (5.6 mM) and high (28 mM) glucose (Wako) concentrations21. The luminescence of Luc-insulin secreted from iGL cells into the culture media was then measured using coelenterazine (CosmoBio) as the substrate. GSIS values were calculated from the luminescence intensity ratio at high (28 mM) to low (5.6 mM) glucose concentrations.
In vitro knock-in of scExe4
Hepa1-6 cells were transfected with scExe4 donor plasmid alone (Donor) or scExe4 donor plasmid with Cas9 plasmid (Donor+Cas9), each 1 μg in 12-well plates using Lipofectamine 3000. The transfected cells were passaged sequentially, and culture medium was collected at passages 2, 5, 8, and 11. The concentration of Exe4 in the culture medium was measured using the Exendin-4 ELISA kit. Genomic DNA from Hepa1-6 at passage 2 and 11 was extracted using DNAeasy Blood & Tissue kit (Qiagen) for further PCR assays, including junction PCR and digital PCR.
Genomic DNA extraction from mouse liver
Liver genomic DNA was extracted 28 weeks post-administration from Balb/c using the All prep DNA/RNA kit, following the manufacture’s protocol.
Junction PCR assay
Genomic DNA extracted from Hepa1-6 cells or mice liver was used as the PCR template for the junction PCR assay. PCR was conducted using PrimeSTAR Max DNA polymerase (Takara Bio) according to the manufacturer’s protocols. The primers employed for junction PCR are outlined in Supplementary Table 3. PCR products were then electrophoresed on a 1% agarose gel, and bands corresponding to the target product size (958 bp for the 5′ junction and 828 bp for the 3′ junction) were identified.
Digital PCR
The QuantStudio Absolute Q Digital PCR System (Thermo Fischer Scientific) was employed for digital PCR analysis. Genomic DNA was digested using MluCI (NEB) and used as the template for the assay. The primers and probes sequences utilized for digital PCR are listed in Supplementary Table 3. The template, primers, and probes were combined with Absolute Q DNA Digital PCR Master Mix (5×) (Applied Biosystems) following the manufacturer’s protocols. The knock-in efficiency was determined using the equation: Knock-in (%) = (Copy number of target)/(Copy number of reference + Copy number of target) × 100.
RT-qPCR
RNA was extracted from various organs (liver, lung, spleen, heart, and kidney) of Balb/c mice from in vivo knock-in experiment using All prep DNA/RNA kit (Qiagen) according to the manufacture’s protocol. The primers used for RT-qPCR are listed in Supplementary Table 3. Reverse transcription from RNA to cDNA was performed using the SuperScript IV First-Strand Synthesis System (Invitrogen). The cDNA samples and primers were combined with SsoAdvanced Universal SYBR Green Supermix (BioRad) and RT-qPCR was conducted using the CFX384 Touch Real-Time PCR System (BioRad). Data analysis was carried out using the ΔΔCt method, and the fold RNA expression levels for Exe4 and Cas9 were calculated by normalizing with the Ct values of the internal control (Gapdh) and the saline-treated control groups.
LNP preparation
All lipids used in this study were purchased from commercial vendors: DLin-MC3-DMA from Cayman Chemicals, Cholesterol from Sigma-Aldrich and DSPC and PEG2000-DMG from Avanti Polar Lipids. NanoLuc-LNP, Donor-LNP, and Cas9-LNP were prepared using the ethanol dilution method22. This involved adding a lipid-ethanol solution to a plasmid solution in 25 mM citrate buffer (pH 4.0), followed by buffer replacement with PBS through diafiltration using Amicon Ultra Centrifuga Filter (10 kDa MWCO, Millipore). All procedures were conducted at ambient temperature. To generate both scExe4 and Cas9 plasmid-loaded LNPs, the molecular ratio of DLin-MC3-DMA/Cholesterol/DSPC/PEG2000-DMG was 50/38.5/10/1.5, following a previously established protocol23,24,25. The LNP samples were diluted with PBS (pH 7.4), and the z-average diameter, polydispersity index, and zeta potential were measured using dynamic light scattering (Zetasizer Nano ZS, Malvern Instruments). The encapsulation efficiency of DNA into the LNP was determined by the Picogreen assay (Thermo Ficher Scientific) following the manufacturer’s protocol. The characterization data for LNPs are summarized in Supplementary Table 4.
In vivo delivery of NanoLuc expressing plasmid DNA
To evaluate DNA delivery efficiency, luciferase (Luc) activity was measured in major organs (liver, lung, spleen, kidney and heart) of 6-8 weeks-old female Balb/c mice. Mice received tail vein injection of saline (Saline), NanoLuc plasmid-loaded LNP (LNP), or hydrodynamics injection of saline solution with NanoLuc plasmid (HD). The dose of plasmid for both LNP and HD was 0.5 μg g−1, with injection volumes of 10 μl g−1 for LNP and 100 μl g−1 for HD. Mice were euthanized 12 h after treatment by CO2 inhalation, and major organs were collected. Organ lysates were prepared by homogenization using Lysis Buffer (Promega) according to manufacturer’s protocol. Luc activity in organ lysates was measured using Nano-Glo Luciferase Assay System (Promega). The ratio of Luc activity (%) corrected by liver Luc activity was calculated for other organs (lung, spleen, heart and kidney) to assess liver specificity of transfection.
In vivo knock-in study with Balb/c mice
Eight-week-old female Balb/c mice were utilized for an in vivo knock-in experiment to investigate the pharmacokinetic profile of Exe4 produced by scExe4 knock-in. The mice were divided into three groups and treated with tail vein injections of either saline (Saline), scExe4 donor plasmid loaded LNP alone (Donor), or scExe4 donor plasmid loaded LNP plus Cas9 plasmid loaded LNP (Donor+Cas9). The dose of both donor plasmid and Cas9 plasmid was 0.5 μg g−1, with an injection volume of 10 μl g−1 for all treatment groups. Body weight was monitored throughout the study. Blood samples were collected by facial vein puncture at each time points to measure Exe4, AST, ALT, and albumin concentrations. Blood samples were centrifuged at 3000 × g for 15 min at ambient temperature to collect supernatant plasma. The concentrations of Exe4 and other hepatic markers in plasma were assessed using commercially available assay kits (Exe4: Abcam, AST and ALT: Sigma-Aldrich, Albumin: Fuji Rebis) following the manufacturer’s protocols, and the absorbance of each sample was measured using a plate reader. At 28 weeks after initial treatment, the mice were euthanized by CO2 inhalation, and the major organs (liver, lung, spleen, kidney and heart) were collected. DNA and RNA were extracted using All prep DNA/RNA kit following the manufacturer’s protocol and used for various PCR-based assays.
Pharmacodynamic study in DIO mice
Female DIO mice with a body weight approximately 22 g received tail vein injections of either saline (Saline), scExe4 donor plasmid loaded LNP only (Donor), or scExe4 donor plasmid loaded LNP plus Cas9 plasmid loaded LNP (Donor+Cas9). The dose for both the donor and Cas9 plasmid was each 1 μg g−1, with an injection volume of 10 μl g−1 for all treatment groups. Additionally, osmotic pump (ALZET) filled with synthetic Exe4 peptide solution (Vehicle: 50% DMSO in 1% BSA aqueous solution) were subcutaneously implanted to DIO mice (Peptide) to mimic daily Exe4 peptide injections. This pump was designed to release synthetic Exe4 peptide solution over 4 weeks. The pumps were implanted twice at 0 and 4 weeks after initial treatment but were removed at 8 weeks after initial treatment to simulate interruption. Weekly food intake and body weight were measured every 2 weeks. Blood and plasma were collected by facial vein puncture to measure plasma Exe4 concentration.
Glucose tolerance test (GTT)
The GTT was performed at 8, 16, and 24 weeks after the initial treatment. After overnight fasting, mice received an intraperitoneal injection of 2 mg glucose g−1. Blood samples were collected from the tail vein, and the blood glucose concentration (mg dl−1) was measured at 0, 30, 60, 90, and 120 min after administration using a LabGluco tester (Research & Innovation Japan). The area under the curve (AUC) of blood glucose concentration was calculated using the conventional trapezoidal method.
Insulin tolerance test (ITT)
The ITT was performed at 8, 16, and 24 weeks after initial treatment. After overnight fasting, mice received an intraperitoneal injection of 0.65 U kg−1 of recombinant insulin (WAKO). Blood samples were collected from the tail vein, and the blood glucose concentration was measured at 0, 30, 60, 90, and 120 min after administration using a LabGluco tester. The blood glucose reduction level was calculated by dividing the blood glucose concentration by the concentration before insulin treatment. AUC of the blood glucose reduction level was calculated using the conventional trapezoidal method.
Oral glucose challenge and GLP-1 measurement
Oral glucose challenge and plasma GLP-1 measurement were conducted 24 weeks after the initial treatment in DIO mice. Following an overnight fast, mice received an oral gavage of glucose at a dose of 2 mg per gram of body weight. Blood samples were collected via facial vein puncture at 0, 30, 60, and 120 min post-administration for plasma GLP-1 concentration analysis. Blood glucose levels were measured at the same time points using a commercially available ELISA kit (IBL Japan). The AUC for plasma GLP-1 concentration was calculated using the conventional trapezoidal method.
Measurement of plasma HbA1c concentration
HbA1c concentration in plasma samples collected from DIO mice at 8, 16, and 24 weeks after the initial treatment of the pharmacodynamic study was determined using a mouse HbA1c ELISA kit (Aviva Systems Biology) according to the manufacturer’s protocols. The absorbance at 450 nm was measured using a plate reader.
Measurement of plasma insulin concentration
Insulin concentration in plasma samples collected from DIO mice at 8, 16, and 24 weeks after the initial treatment of the pharmacodynamic study was determined using a mouse insulin ELISA kit (Mercodia) according to the manufacturer’s protocols. The absorbance at 450 nm was measured using a plate reader.
5′-rapid amplification of cDNA ends (RACE)-based genome-wide off-target analysis
5′-RACE was performed using the SMARTer RACE 5′/3′ Kit (Takara Bio) according to the manufacturer’s instructions. A total 1 μg of RNA was used for the reaction. The scExe4-specific primer used was 5′-GATTACGCCAAGCTTCCTCGGGCACGTTGCTATCAGTGTAGGGTT −3′. PCR products were cloned using the In-Fusion HD Cloning and sequenced with an ABI 3730xl sequencer (Genewiz). Captured exons located to upstream of scExe4 were mapped to the UCSC mouse genome browser (NCBI37/mm9) (https://genome.ucsc.edu/cgi-bin/hgGateway?db=mm9). Data were obtained from liver tissues of Balb/c mice at 28 weeks post-administration. Sanger sequencing of non-specific bands confirmed that they originated from 18S rRNA and did not contain scExe4.
On-target and off-target analysis by amplicon sequencing
Liver genomic DNA from in vivo knock-in experiments with Balb/c mice was analyzed for on-target and off-target effects using amplicon sequencing on a MiSeq platform (Illumina). The top 10 off-target sites were predicted using The COSMID Tool (http://crispr.bme.gatech.edu), following a previously established approach20. Primers for amplicon preparation are listed in Supplementary Table 5. Data from amplicon sequencing were processed and analyzed by CRISPResso2 (http://crispresso2.pinellolab.org/submission).
Statistics and reproducibility
GraphPad Prism 10 was used for both statistical analysis (ANOVA) and generation of bar plots. All other graphs were generated in Excel. The sample sizes for both in vitro transfection studies (Hepa1-6 and HepG2 cells) and in vivo studies (Balb/c and DIO mice) were predetermined. Limited material availability necessitated that the off-target analysis and 5′-RACE assay be performed with one sample per group. To ensure reproducibility, 5′-RACE assays were conducted utilizing two distinct primer pairs per group. All specific sample sizes are further detailed within the corresponding figure captions.
Reporting summary
Further information on research design is available in the Nature Portfolio Reporting Summary linked to this article.