Where they spend has changed dramatically, with only two winners that gained share among the retailer categories. The rest lost share, some are getting wiped out.
By Wolf Richter for WOLF STREET.
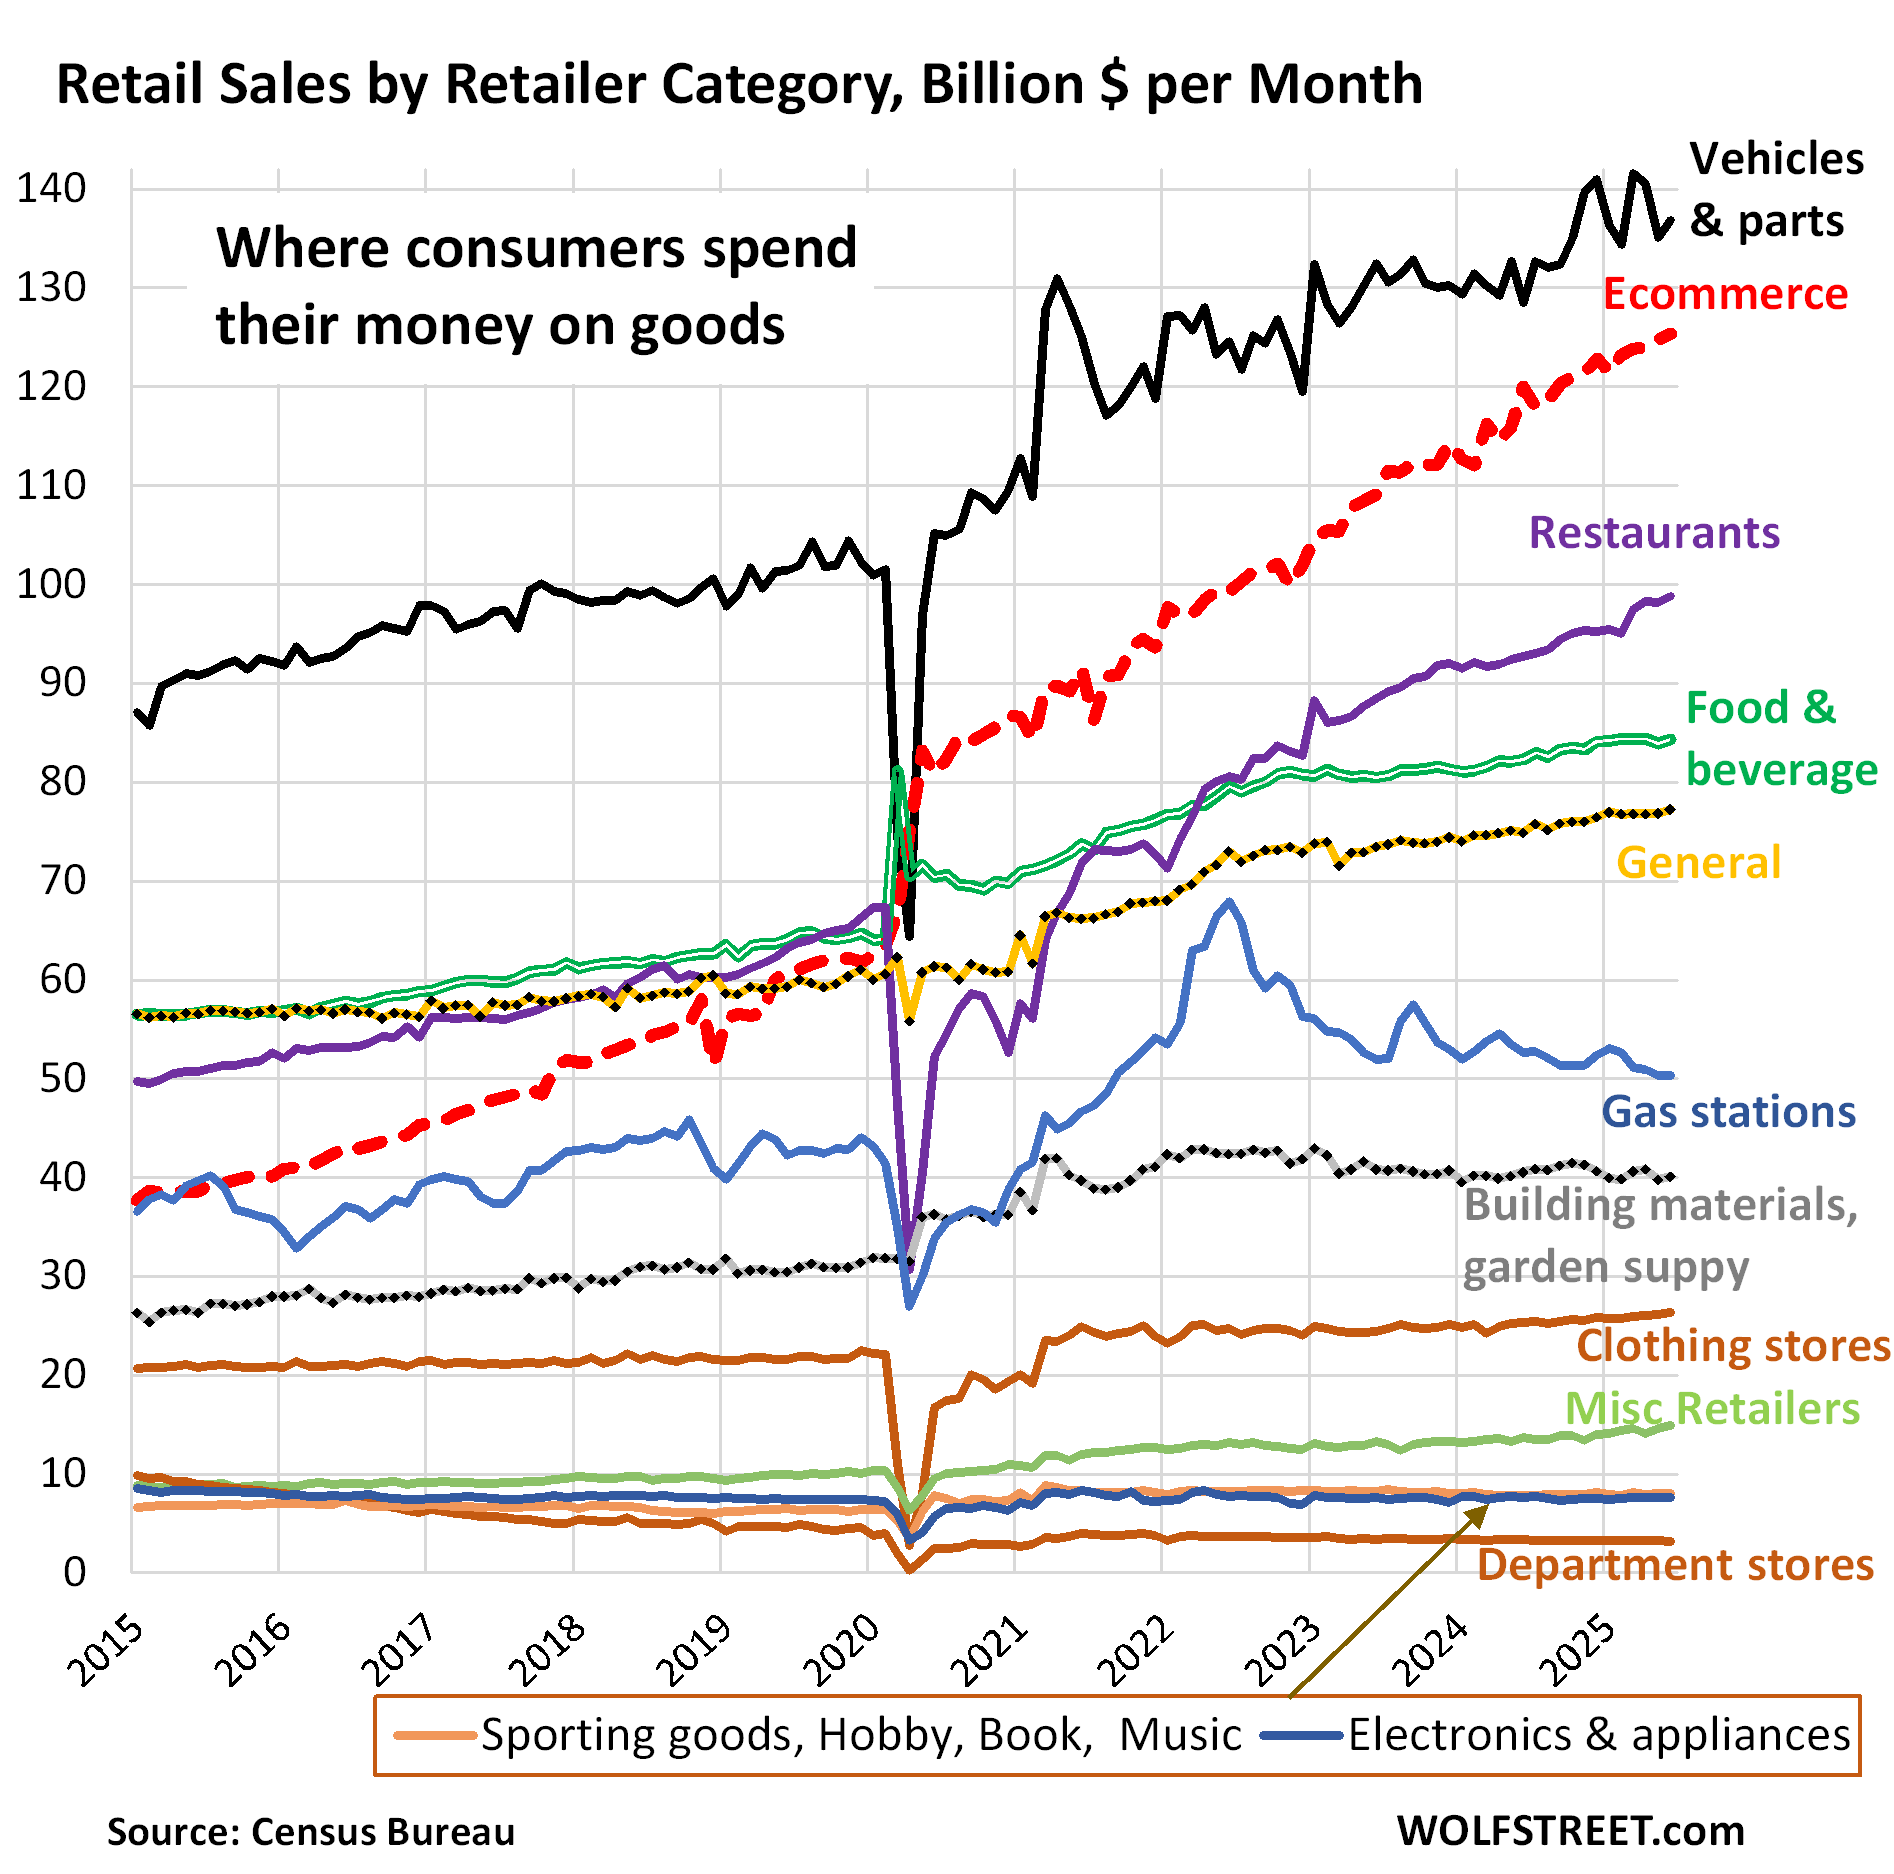
Consumers spent $8.5 trillion over the past 12 months at brick-and-mortar and online retailers to purchase goods, from shoes and groceries to RVs. In June alone, they spent $720 billion. But how are consumers divvying up these trillions among the retailers? And how has it changed over the past 10 years?
The big winner is ecommerce, whose sales soared by 212% over the 10-year period. As a result, its share nearly doubled to 17.2% of total retail sales over the past 12 months through June, up from 8.9% in 2015, gaining 8.2 percentage points in share in 10 years; and up from a share of 5.4% in 2003, when retailers were still brushing off ecommerce as a threat to their brick-and-mortar business. Over the past 10 years, ecommerce became the #2 retailer category behind motor-vehicle and parts dealers, up from #5 in 2015 (dotted red line in the chart).
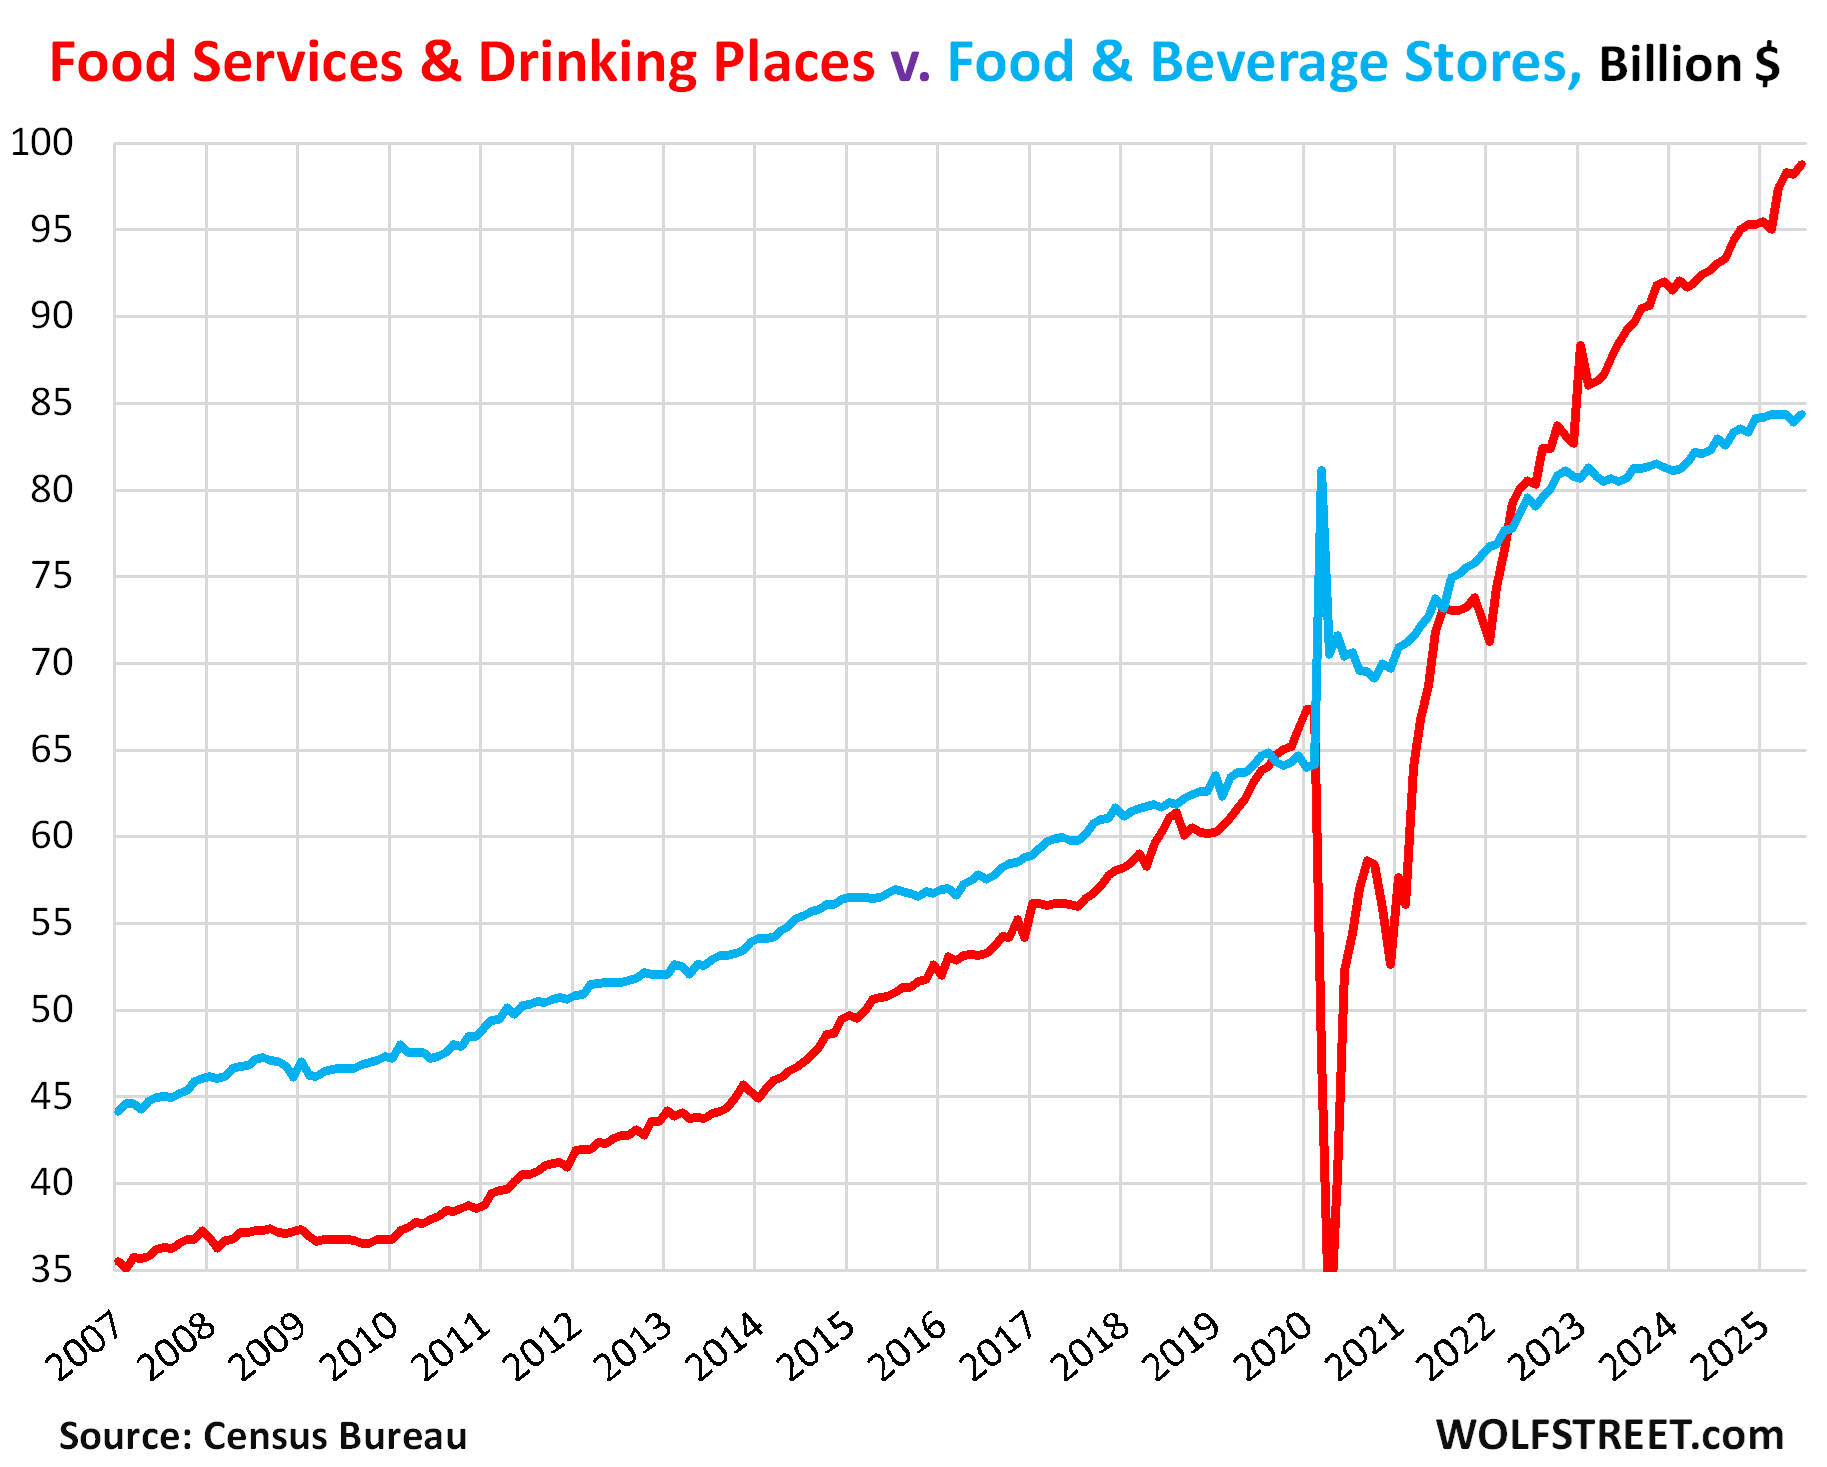
The only other winner: restaurants and bars (“food services and drinking places”). Sales soared by 88% over the 10-year period, causing the share to increase by 1.8 percentage points, to 13.5% over the past 12 months through June, up from a share of 11.6% in 2015, bypassing food and beverage stores and general merchandise stores to become the #3 retailer category. All other major categories lost share to ecommerce.
Over this 10-year period, total retail sales have increased by 63%. For retailers to maintain their share, their sales would have had to also increase by 63%. If sales increased by less than 63%, they lost share. If sales increased by more than 63%, they gained share.
Only two major categories increased their sales by more than 63% and gained share: ecommerce and restaurants and bars. They are eating everyone’s lunch, so to speak. Their gains are the result of big structural changes in how Americans spend their money and what they spend it on.
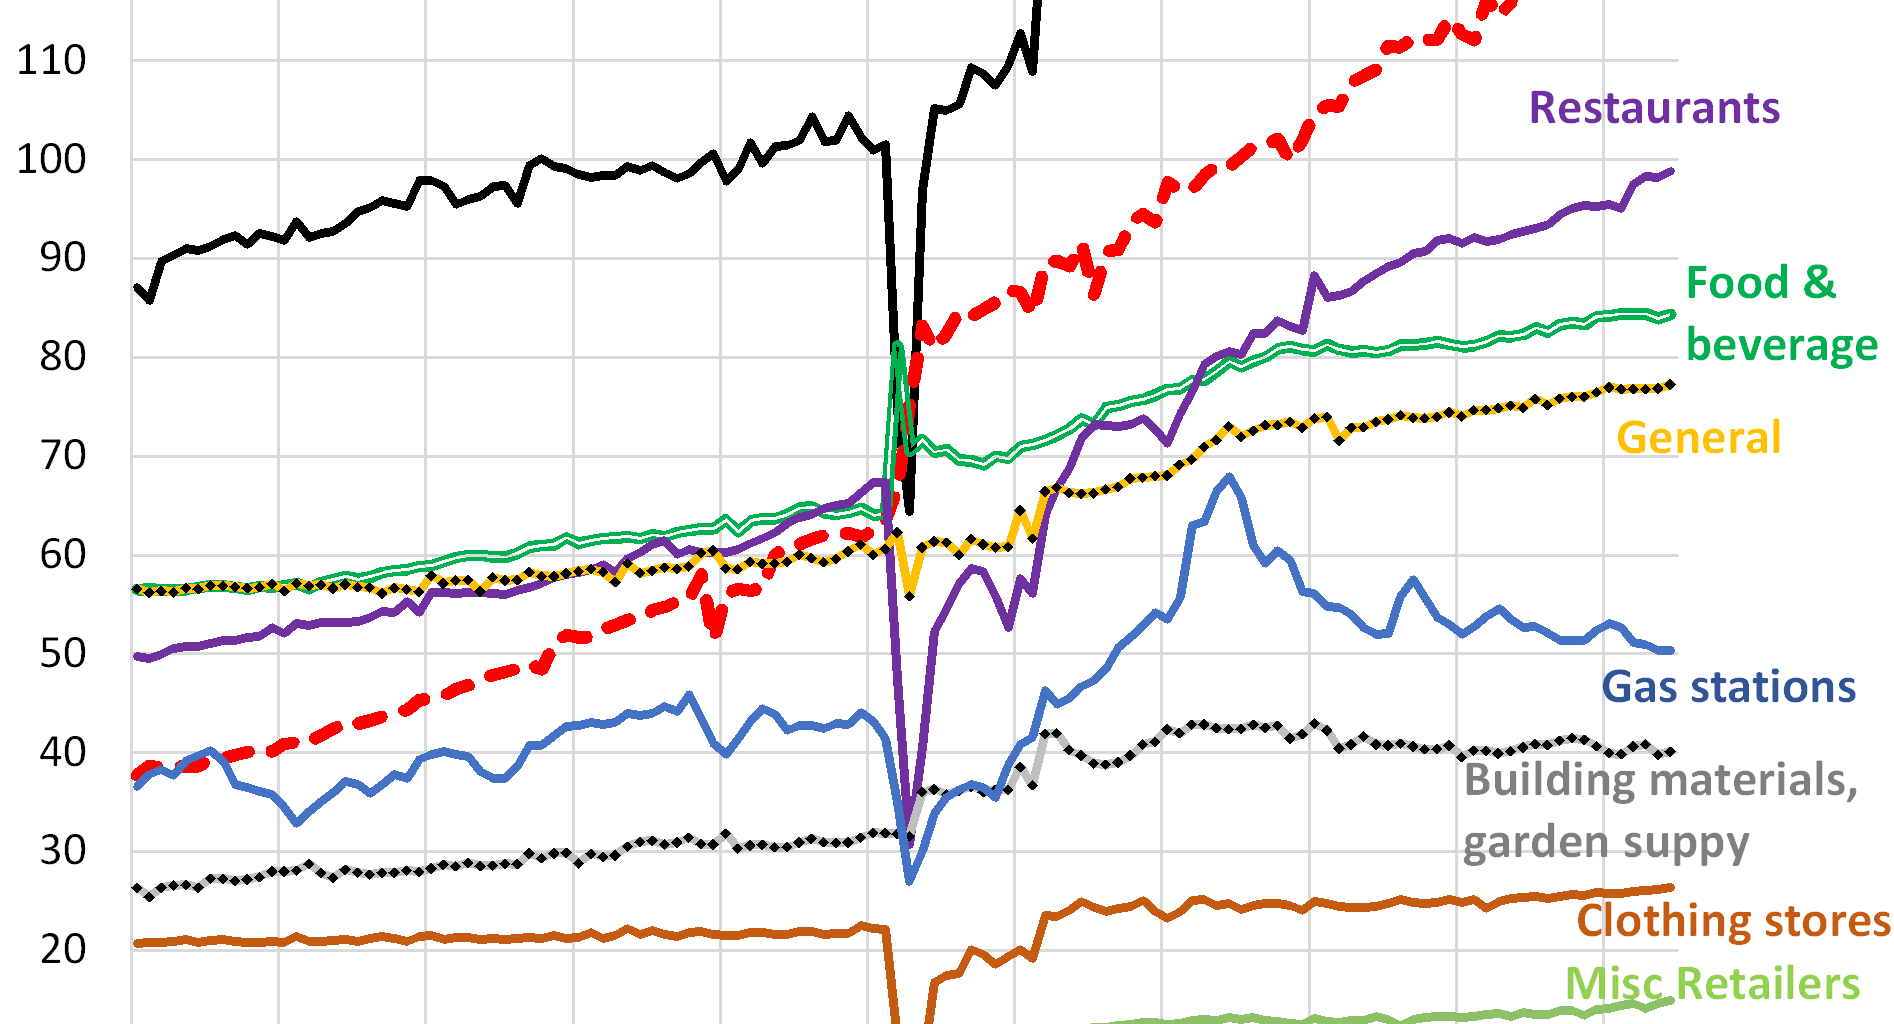
The #1 category is still motor vehicles and parts dealers (black line in the chart above). They sell new and used vehicles, recreational vehicles, motorcycles, ATVs, other motor vehicles, boats, tires, and parts. Over those 10 years, their sales rose by 51%, but that was less than the 63% increase of total retail sales, and so their share dropped to 19.2%, from 20.7% in 2025 (top black line in the chart above).
Those top three – motor vehicle and parts dealers, ecommerce, and restaurants and bars – accounted for half (50%) of total retail sales over the past 12 months through June, up from a share of 41% in 2015.
Sales at restaurants & bars, the #3 category (purple in the chart above), increased by 88% since 2015, while overall retail sales increased by only 63%. They blew by food and beverage stores in 2019.
During the pandemic, many restaurants were shut down, and sales collapsed, while grocery store sales spiked as people couldn’t eat out anymore. But then the restaurant industry re-opened more vibrant than ever and left food and beverage stores in the dust.
Restaurants benefited from the post-pandemic “revenge spending,” when people wanted to get out of the house and have “experiences,” and this trend, despite predictions that it would fizzle in 2023, has continued full force, as consumers are in the mood to splurge, and have the money to do so, with record high earnings and historically low unemployment.
Food and beverage stores dropped to #4 (double green line in the chart above), as their sales increased by 48% since 2015, while overall retail sales increased by 63%.
In 2015, they were #2. They were bypassed by ecommerce during the lockdown and by restaurants and bars in 2022.
General merchandise stores and ecommerce ate their homework. Food and beverage stores lost sales to general merchandise stores that also sell food, such as Walmart (now the largest grocery seller). They also lost sales to ecommerce, including to online-only food retailers. And they lost sales to restaurants.
General merchandise stores dropped to #5 now, from #3 in 2015, and their share declined to 10.7% now, from 13.0% in 2015. Over those 10 years, their sales increased by only 35%, while total retail sales increased by 63%.
These brick-and-mortar stores lost a large part of their nonfood sales to ecommerce retailers (such as Amazon), or shifted sales to their own ecommerce channels (such as Walmart, now one of the largest ecommerce retailers in the US). Part of the brick-and-mortar stores’ loss of sales to ecommerce of their nonfood items was covered up by their increased food sales, at the expense of grocery stores.
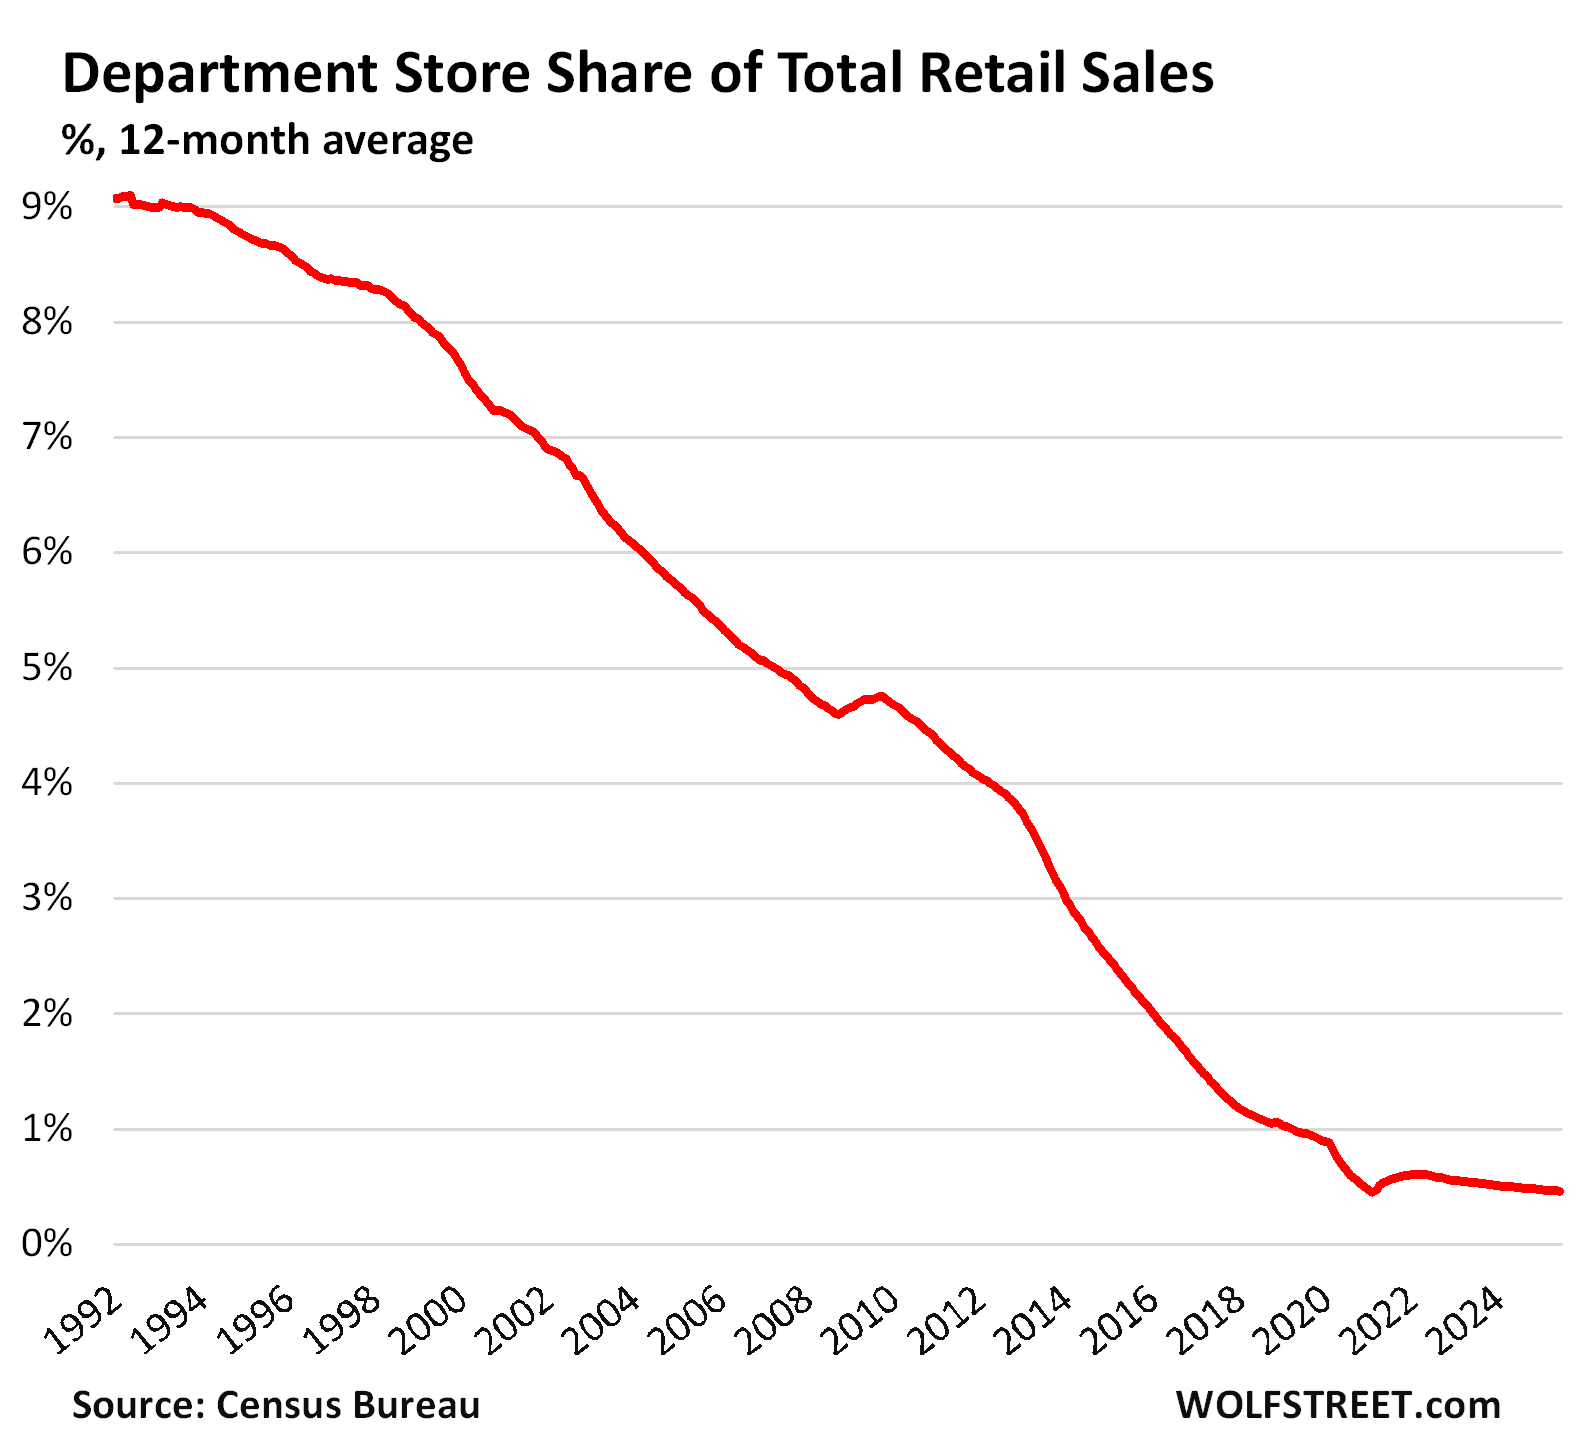
Department stores were once the iconic way in which Americans shopped. Their slow demise started quietly in 2001 when their sales began their relentless decline.
Ecommerce brought about a structural change in how Americans shopped, and it pulled the rug out from under department stores (brown line at the very bottom of the first chart).
Here is the long-term sales performance of brick-and-mortar department stores. This does not include the ecommerce sales of the few remaining department store chains, only their brick-and-mortar sales:
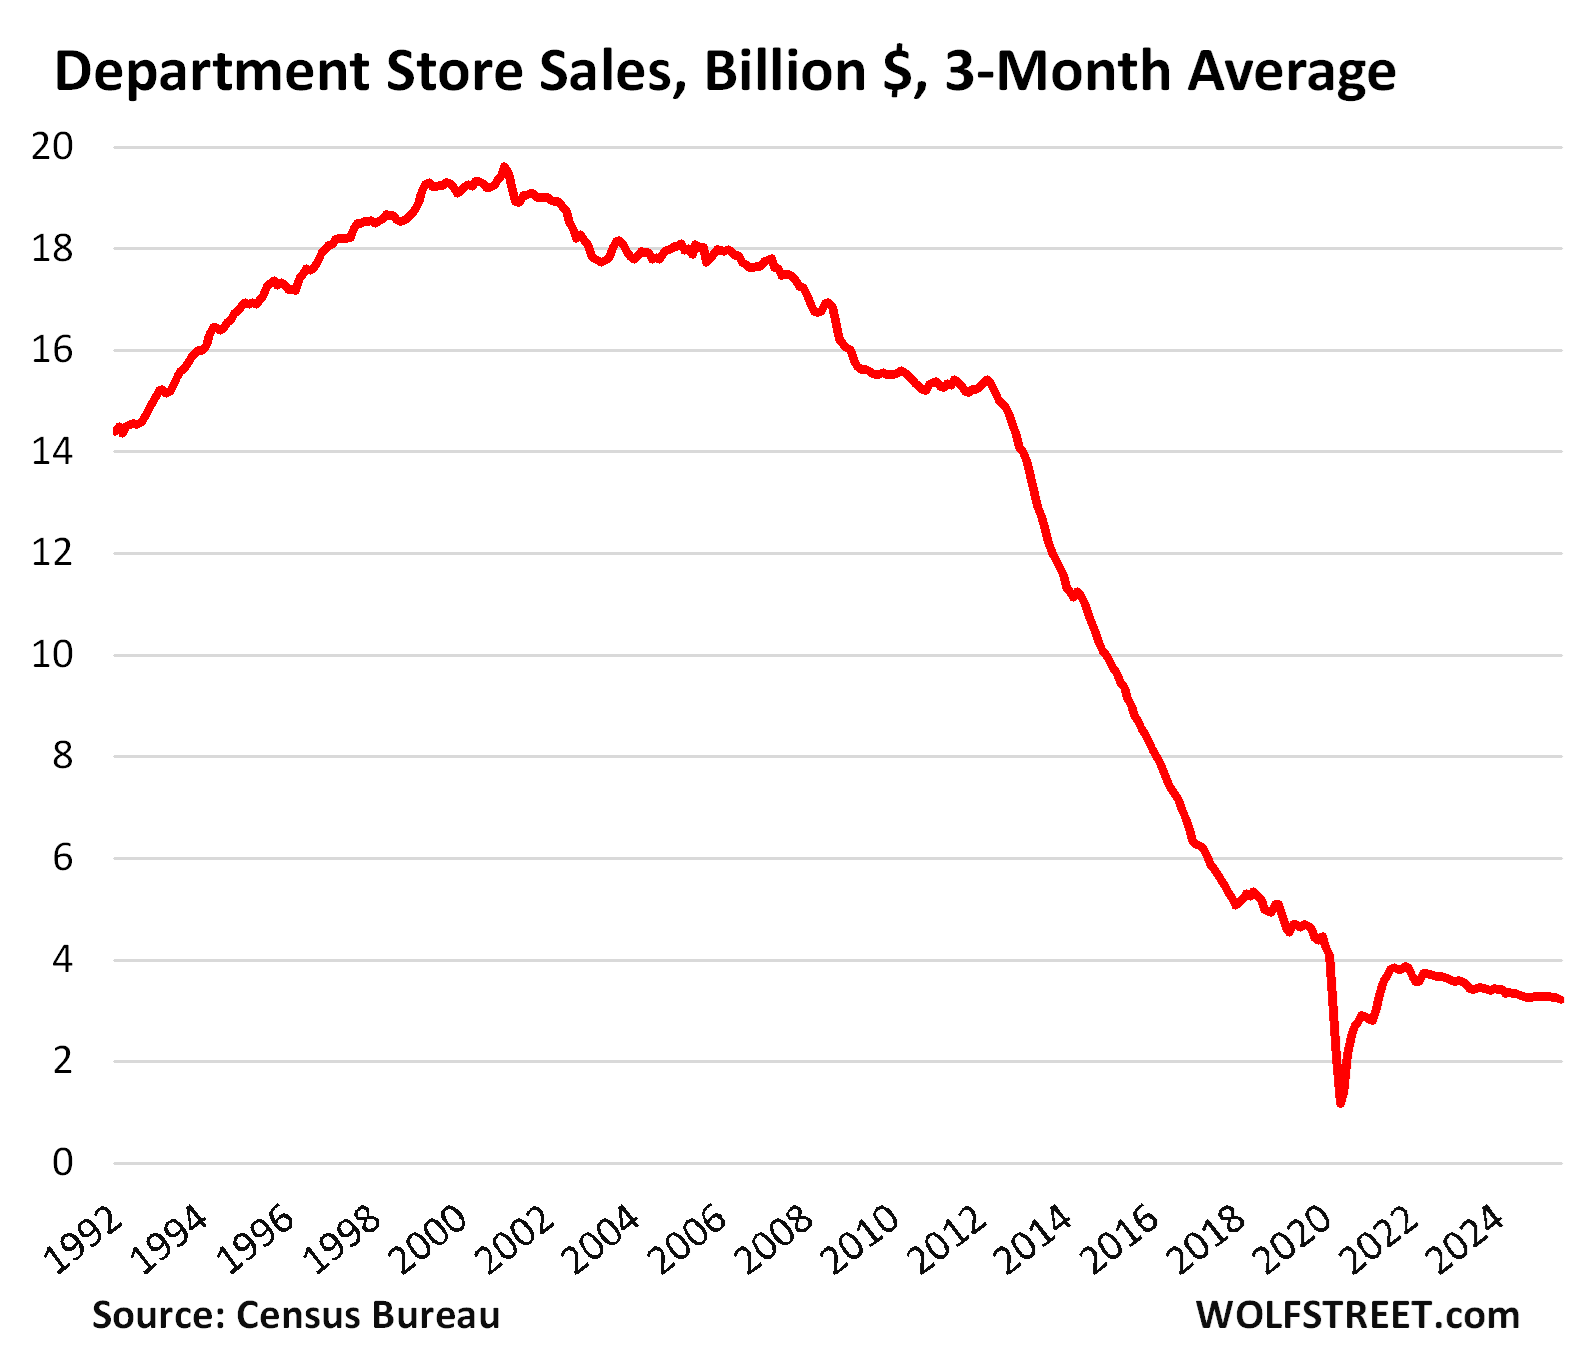
In 1992, department stores had a share of over 9% of total retail sales. By 2004, their share was down to 5.4%. By 2015, their share was down to 2.0%. Now their share is down to 0.46%. They really don’t matter anymore.
As this shift occurred, countless independent department stores, regional chains, and national chains were liquidated in bankruptcy court, while the few surviving chains closed thousands of stores. Since 2016, WOLF STREET’s Brick-and-Mortar Meltdown has documented the fate of many of these department stores along with other brick-and-mortar stores.
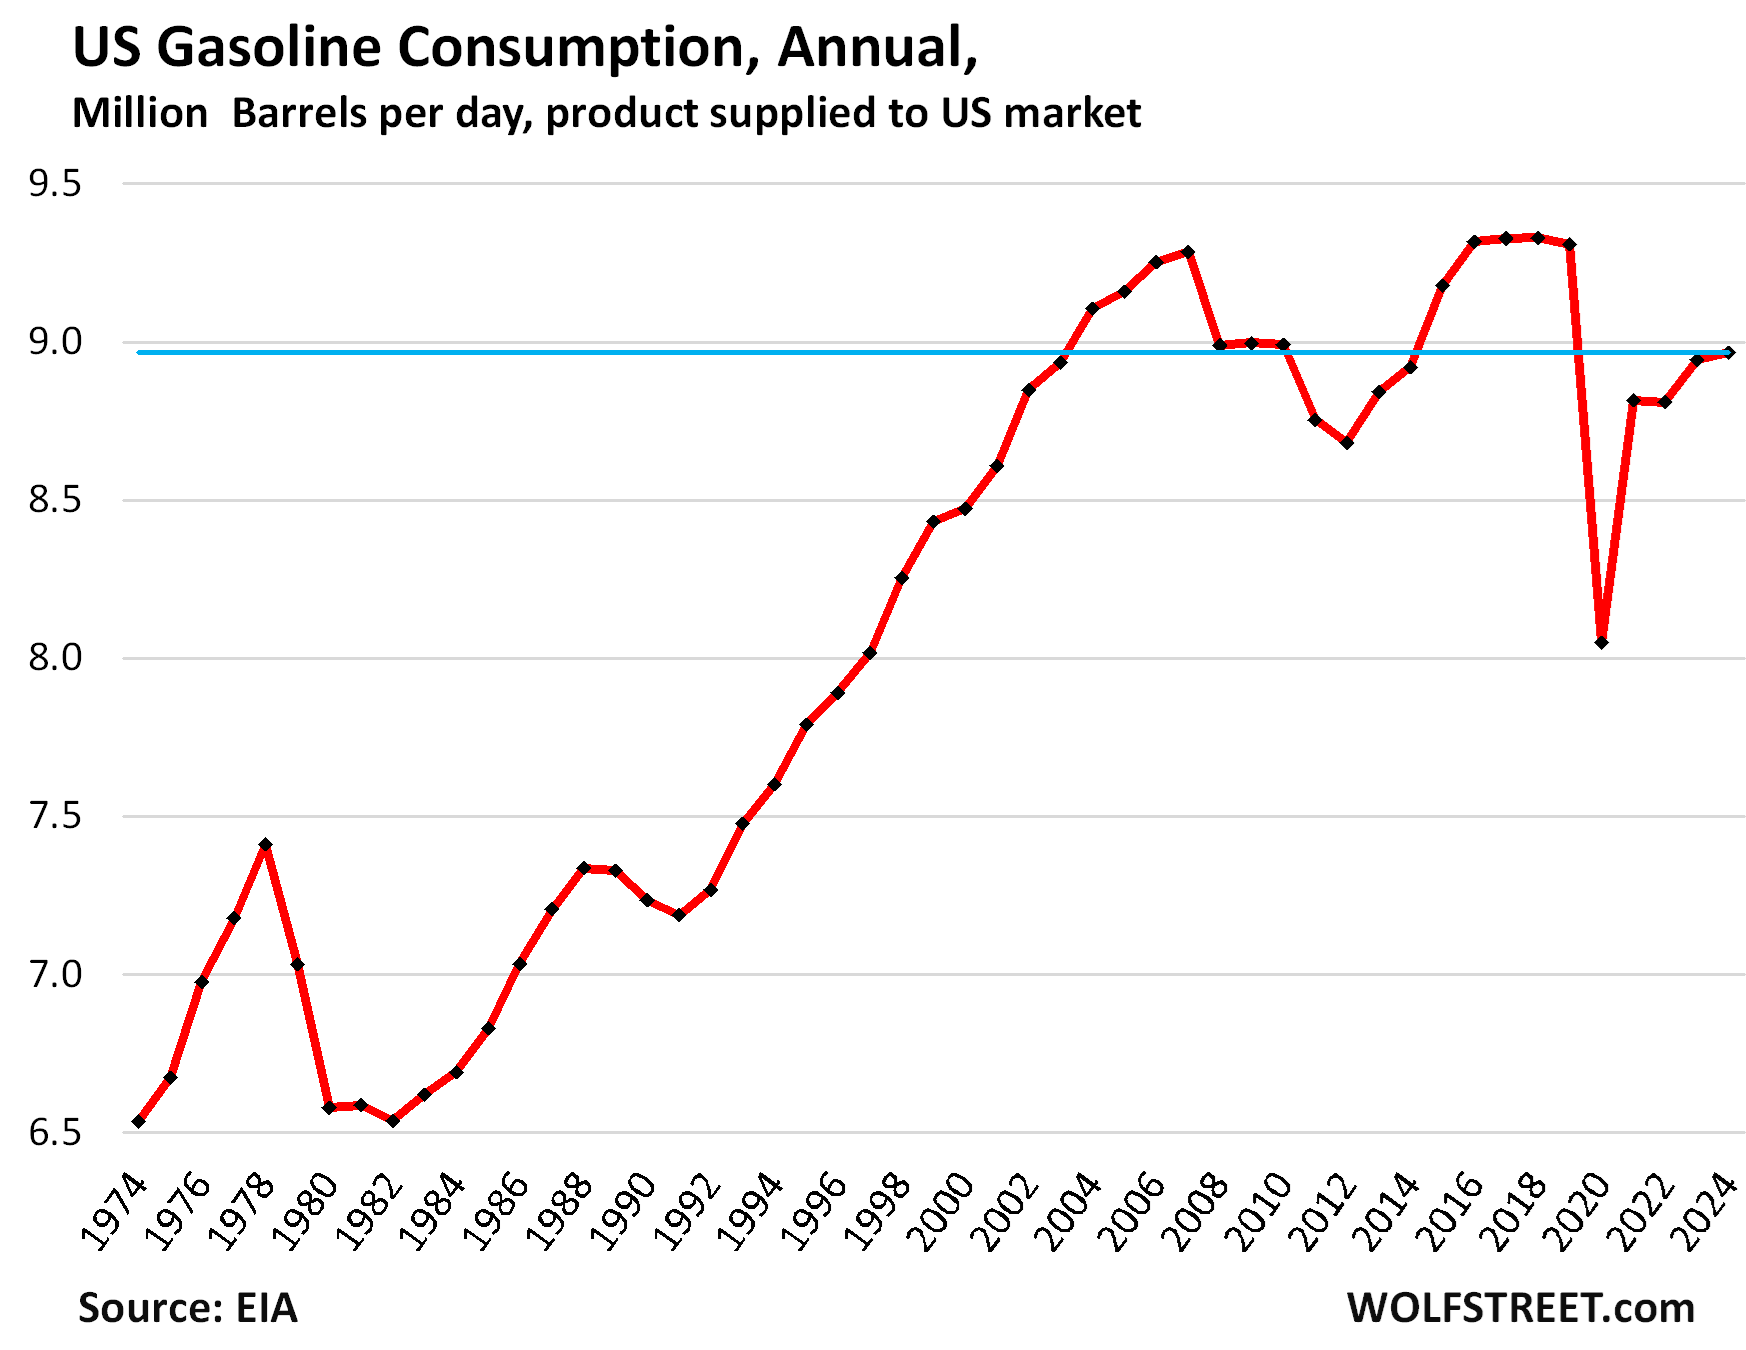
The share of gas station sales, the #6 category, dropped to 7.3% over the past 12 months, from 8.6% in 2015, largely driven by the price of gasoline (blue line in the middle, first chart).
But there is also the long-term issue that gasoline consumption per capita has been declining for over 20 years, as a result of fewer miles driven per capita, and ever more fuel-efficient vehicles (including now increasingly EVs).
In 2024, gasoline consumption in the US was 3.9% below the 2018 peak and 3.4% below the prior peak in 2007, and about where it had been in 2003 (details and charts are here):
In case you missed it: My Thoughts about those June Retail Sales
Enjoy reading WOLF STREET and want to support it? You can donate. I appreciate it immensely. Click on the mug to find out how:
![]()