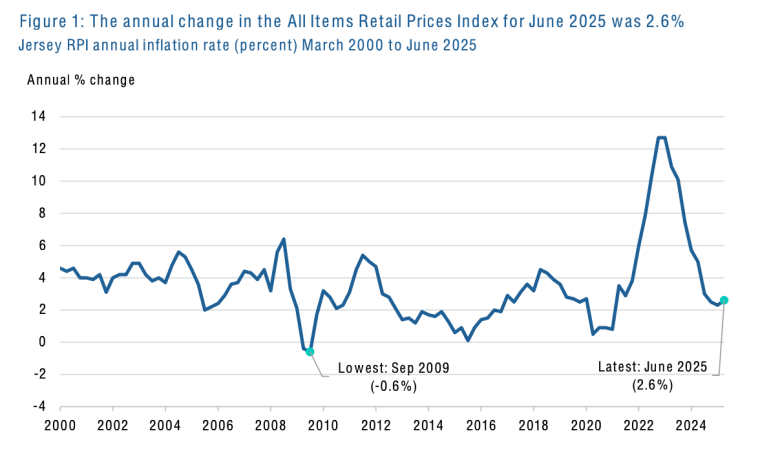
The cost of living in Jersey is rising slightly faster than it was three months ago, the latest inflation figures have revealed.
The figures from Statistics Jersey show that prices were 2.6% higher in June than a year ago, and up from 2.3% in March.
The data comes from the latest Retail Prices Index report, published this morning.
 Pictured: The rate at which prices are increasing has gone up this year. (Stats Jersey)
The Retail Prices Index is the main way inflation is measured in Jersey. It tracks how much the prices of goods and services bought by households have changed over time, and is often used as a measure of the island’s cost of living.
What’s gone up over the past year?
- Tobacco: up 8.6%
- Fares and other travel: up 7.1%
- Leisure services (e.g. entertainment, sport, holidays): up 6.4%
- Fuel and light: up 6.3%
- Catering (e.g. eating out, takeaways): up 4.3%
- Personal goods and services (e.g. toiletries, dental/medical/beauty treatments): up 4.3%
- Food (e.g. shop bought): up 4.1%
- Alcoholic drinks: up 3.9%
- Motoring (e.g. vehicles and petrol): up 3.5%
- Household services (e.g. school fees, phone bills, subscriptions): up 3.2%
- Clothing and footwear: up 1.3%.
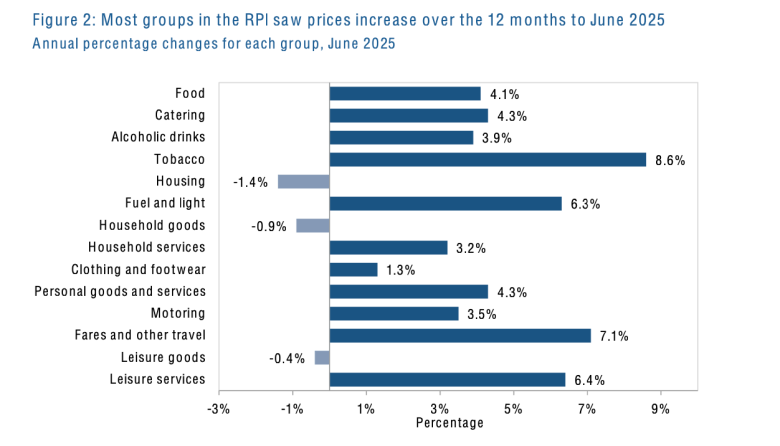 Pictured: Over the past year, prices have risen across most spending categories. (Stats Jersey)
What’s gone down?
- Leisure goods (e.g. books, games, gardening items): down 0.4%
- Household goods (e.g. furniture, appliances): down 0.9%
- Housing (e.g. rents and mortgage interest payments): down 1.4%
What’s driving the change?
The increase in the annual rate of inflation by 0.3 percentage points compared to March was due to “upward contributions from several groups”, most notably leisure services, food and household services, according to the report.
It read: “Leisure services which includes entertainment, sport and leisure fees, and off-Island holidays, was the price group that made the largest contribution to the annual rate of inflation, contributing +0.6 pp to the rate.”
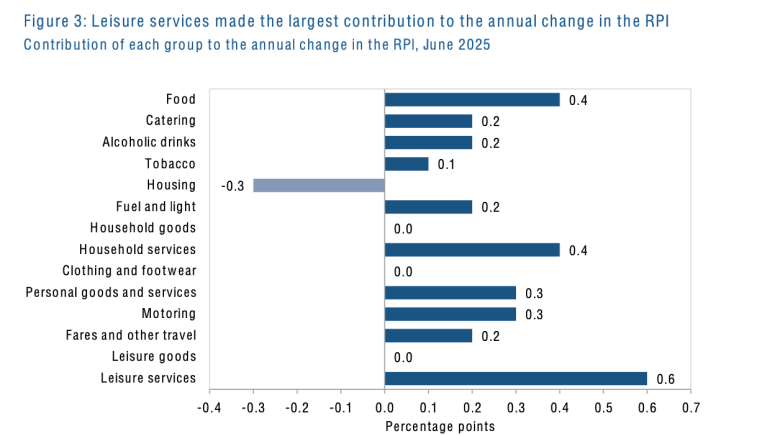 Picutred: The rise in the annual rate of inflation was driven by several categories, with the biggest contribution coming from leisure services. (Stats Jersey)
At the same time, the fall in mortgage interest rates meant that housing made a bigger negative contribution than in previous quarters.
The report read: “Prices in the housing group decreased more, on average, over the 12 months to June 2025 than the same period of time to March 2025, giving a slight downward contribution to the change in the annual rate of increase.”
Impact on vulnerable islanders
The report also looks at how vulnerable islanders – such as pensioners and those on low incomes – are faring.
It does this by looking two specific measures of inflation: RPI Pensioners and RPI Low Income.
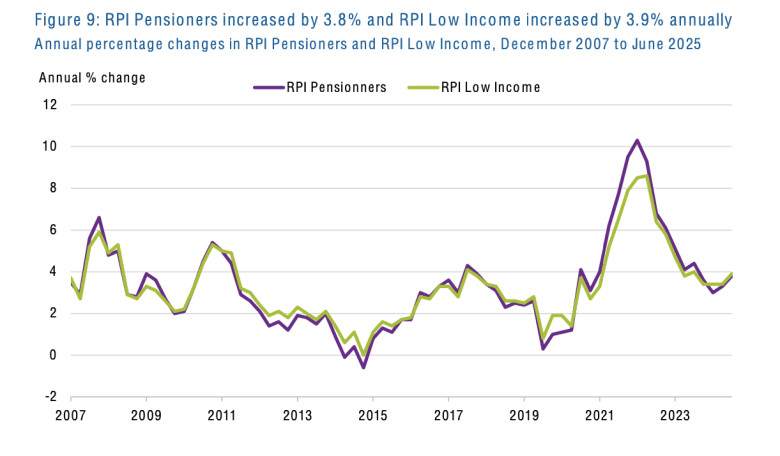
Pictured: RPI Pensioners increased by 3.8% and RPI Low Income increased by 3.9% annually. (Stats Jersey)
These are calculated based on the different spending patterns of pensioner households and the lowest-income households in Jersey.
Over the past 12 months:
- RPI Pensioners rose by 3.8% (up from 3.3% in March)
- RPI Low Income rose by 3.9% (up from 3.4% in March)
How do we compare to the UK?
The rate of inflation in Jersey as measured by the RPI, was 1.5 percentage points lower than the UK’s comparable CPIH figure (Consumer Prices Index), which stood at 4.1% in June.
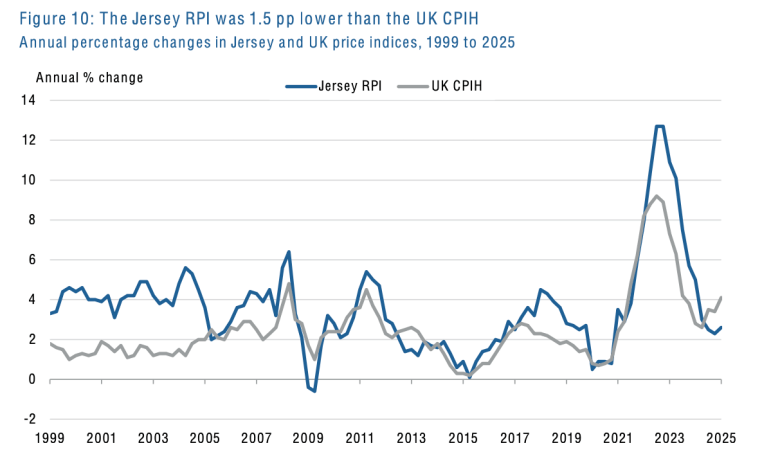
Pictured: Over the 12 months to June 2025, the Jersey RPI and UK CPIH increased by 2.6% and 4.1%, respectively, hence the headline rate of inflation in Jersey was 1.5 pp lower than that of the UK. (Stats Jersey)
Differences in how housing costs are measured and the impact of interest rates account for part of the gap.
Related