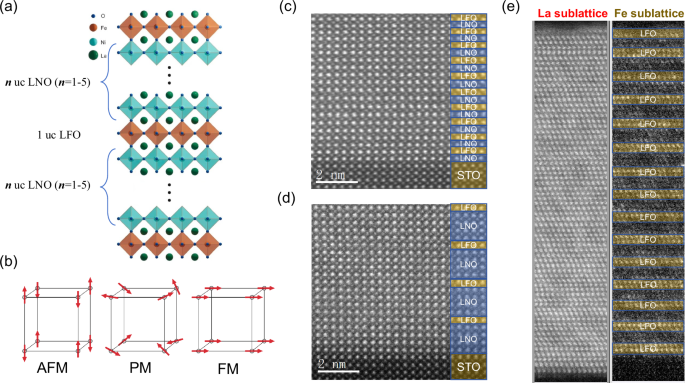
Creation of LNOn/LFO1 superlattices with layered ordering of cations
We have grown LNOn/LFOm superlattices (SLs) by alternately stacking LNO and LFO layers using pulsed laser deposition on SrTiO3 (STO) (001) substrates (see the “Methods” section), where n and m represent the layer thickness of LNO and LFO in pseudo-cubic uc, respectively. Here n was varied from n = 1 to 5 uc, while the LFO layer was set to 1 uc thick. The LNOn/LFO1 bilayer was repeated 10–20 times to form the SL. The SL growth was monitored in-situ by reflection high-energy electron diffraction (RHEED). Streaked RHEED patterns with clear intensity oscillations were observed during the growth of both LNO and LFO films, implying a 2D layer-by-layer film growth mode (Supplementary Fig. S1). The epitaxial growth of the high-quality LNOn/LFO1 SLs was also confirmed by X-ray diffraction experiments and high-resolution scanning transmission electron microscopy (STEM). Notably, although clear Laue fringes are visible for all the SLs from high-resolution XRD θ–2θ scans (Supplementary Fig. S2) due to their atomically smooth surfaces as confirmed by atomic force microscopy (Supplementary Fig. S3), the satellite peaks indicating the chemically modulated structure with well-defined interfaces were only visible for n ≥ 3, consistent with the previous results on similar structure17. Moreover, for n ≤ 3, the SL is under compressive strain with c ≥ 3.905 Å. While as n > 3, the SL is under tensile strain. Such decrease of out of plane c with increasing n is consistent with the smaller lattice constant of LNO compared to LFO (LFO is orthorhombic with a pseudo-cubic lattice constant a0 = 3.93 Å17, and LNO is rhombohedral with pseudo-cubic a0 = 3.838 Å). Figure 1c and d show the atomically resolved high-angle annular dark-field (HAADF) image of the cross-section of the LNO1/LFO1 SL and LNO4/LFO1 SL samples, respectively, recorded along the [100] zone axis. As the intensity of HAADF-STEM images is sensitive to atomic number (Z), both SLs show coherent epitaxial lattice as demonstrated by the brightest sublattice of the La ions. No dislocations, defects, or any nano-scale phase-separated microstructures such as Fe or Ni metal clusters were observed. The compositional electron energy-loss spectroscopy (EELS) maps obtained from the analysis of the La M4,5 (Fig. 1e left), Fe L2,3 (Fig. 1e right), and Ni L2,3 signals reveal the epitaxial growth of the periodic layered structure, which is flat and continuous over long lateral distances. Cation intermixing of Fe and Ni ions when occurs is found to be confined within 1–2 uc of LFO (within 1 p.l. of the SL). Shortly, high-quality LNOn/LFO1 superlattices with layered ordering of configurations for Fe and Ni cations are successfully fabricated.
Magnetic and transport properties of the emergent ferromagnetic superlattices
LNO is a paramagnetic metal, and LFO is a G-type AFM insulator with intralayer antiparallel spin alignments, which shows one of the highest ordering temperatures of perovskite oxide (TN ≈ 740 K). Remarkably, when they were epitaxially grown along the (001) directions but absent for the (110) and (111) directions (Supplementary Fig. S4), the LNOn/LFO1 SLs show strong signatures of ferromagnetism, which depends critically on the stacking thickness, n, of LNO. Figure 2a shows the hysteresis curves of the LNOn/LFO1 SLs measured at 300 K, i.e. the dependence of the magnetization (M) as a function of the magnetic field B, which is saturated under the applied field above 3.5 kOe. All samples exhibited key characteristics of FM behavior, including hysteresis and remnant magnetization. At n = 5, the SL shows weak saturation ferromagnetism similar to LaFe0.5Ni0.5O3 thin films. Remarkably, as n decreases, the highest saturation magnetization increases significantly, reaching 252.8 emu/cm3 for n = 1, ~4.0 μB/p.l., comparable to the 4.96 μB/f.u. (f.u. = formula unit) for the FM DP La2NiMnO628, and much larger than that of the LaFe0.5Ni0.5O3 thin films (Fig. 2b). Figure 2c shows the temperature dependence of magnetization (M–T curve) for the typical LNOn/LFO1 (n = 1, 3 and 5) SL samples in addition to the LaNi0.5Fe0.5O3 film. The Curie temperature, TC, could be determined based on the minimum value of the temperature coefficient TCM, defined as TCM = 1/M(dM/dT). Remarkably, all the SL samples show a TC much higher than room temperature, around TC = 608, 589, and 419 K, respectively, for n = 1, 3, and 5. It is also noteworthy that the LaNi0.5Fe0.5O3 film shows a TC = 109 K, much lower than those of the SL but higher than the bulk spin glassy temperature of 83 K27. The results strongly suggest that a unique FM order is accessed in the SLs structures with the strongest magnetism obtained at n = 1, an emergent La2NiFeO6 DP structure with B-site layered ordering configuration along (001) direction. As illustrated in Table 1 its TC is close to the highest value (TC = 625 K) reported for Sr2CrReO6 among the DP compounds29. The temperature-dependent resistivity, ρ, of the LNOn/LFO1 (n = 1, 3 and 5) SL sample was also measured between 2 and 300 K, as shown in Fig. 2d. All the SLs show a semiconductive behavior with small polaron conduction mechanism (n ≤ 4) (Supplementary Fig. S5), although the LaFe0.5Ni0.5O3 thin film is found to be highly insulating. This strong conduction difference, in addition to the strong difference in magnetism, may be related to the difference in the ordered arrangement of the Fe and Ni cation atoms over the B-sites, where the higher level of cations ordering prefers higher magnetization and higher conductivity19. We thus obtained an emergent La2NiFeO6 DP with Curie temperature much higher than room temperature, which has been predicted to be a half-metallic ferromagnet26.
Fig. 2: Magnetic and transport properties of the atomically engineered LNOn/LFO1 SLs.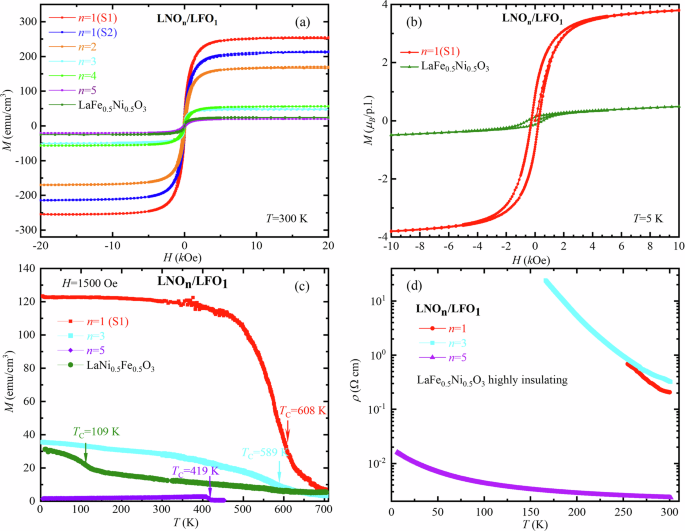
a The hysteresis curves of the LNOn/LFO1 SLs measured at 300 K, for comparison the results of LaFe0.5Ni0.5O3 thin films, is also presented. b The hysteresis curve of the LNO1/LFO1 SL measured at 5 K in comparison to the LaFe0.5Ni0.5O3 thin film. c The temperature dependence of magnetization for the LNOn/LFO1 (n = 1, 3 and 5) SLs and the LaNi0.5Fe0.5O3 film. d The temperature-dependent resistivity, ρ, of the LNOn/LFO1 (n = 1, 3, and 5) SLs, showing semiconductive behavior.
Table 1 The emerging ferromagnetic SLs and the typical double perovskites (DP) with ferromagnetism near and above room temperatureMagnetic domain microstructure characterized by magnetic force microscopy
The magnetic domain microstructure and its evolution with respect to the applied field for the LNO1/LFO1 SL were also investigated by magnetic force microscopy (MFM). Generally, the magnetograms obtained by MFM provide information on the effective magnetization along the z direction of the local domains. Figure 3 shows the magnetograms obtained at 2 K in different out-of-plane magnetic fields corresponding to the critical points on the M–H loop in Fig. 2b. Here the red or blue-colored regions represent net-magnetization oriented up (+Mz) or down (−Mz), respectively, and the green color represents the zero Mz signal. As shown in Fig. 3, the as-grown LNO1/LFO1 SL first demonstrates nearly zero-magnetization along the z direction after the zero-field-cooling (ZFC) process. By applying a positive magnetic field along the out-of-plane direction, discrete upward domains begin to appear and grow continuously (+900 Oe), eventually reaching an upward single-domain state at the saturation field of +20 kOe. By applying a negative magnetic field, the single-domain state turns to fragments of upward and downward domains at the coercive field of approximately −250 Oe, corresponding to the zero net magnetization in the M–H loop. The typical size of the fragment domains after magnetization (measured at +250 Oe) is about 300–500 nm (Supplementary Fig. S6). The magnetic domain evolution is repeatable during the field-sweeping process, as further evidenced by the downward single-domain state at −20 kOe and then the fragment-domain state at +250 Oe (the positive coercive field). The domain structures after ZFC and their evolution upon applying magnetic fields are consistent with the direct magnetization measurements. This further confirms that the strong magnetism is intrinsic to our SL samples, where the plausible magnetic contribution from the STO bulk substrate is negligible.
Fig. 3: Magnetic force microscopy (MFM) domain structure of the LNO1/LFO1 SL sample obtained at 2 K.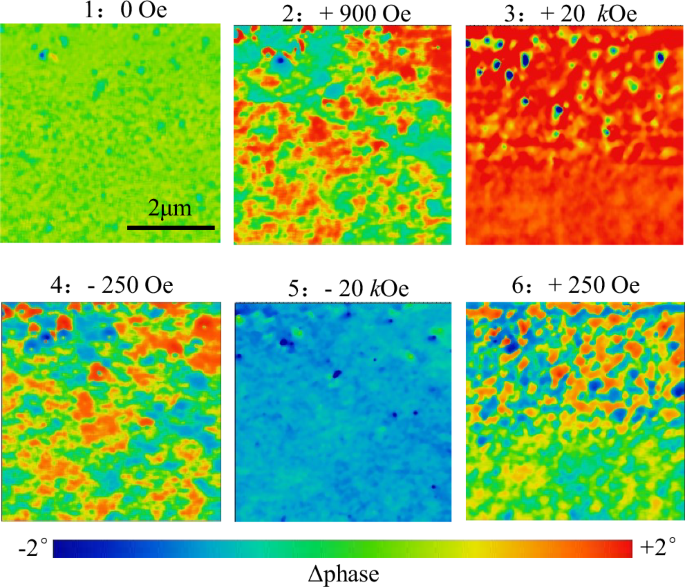
The magnetic contrasts (Δφ) are represented by colors: the red (blue) colored area with positive (negative) Δφ represents the net magnetization projecting along the upward (downward) z direction, and the green colored area with nearly zero Δφ represents for domain walls or the grains with zero-magnetization.