
Aug 10, 2025
IndexBox has just published a new report: EU – Polycarbonates (In Primary Forms) – Market Analysis, Forecast, Size, Trends and Insights.
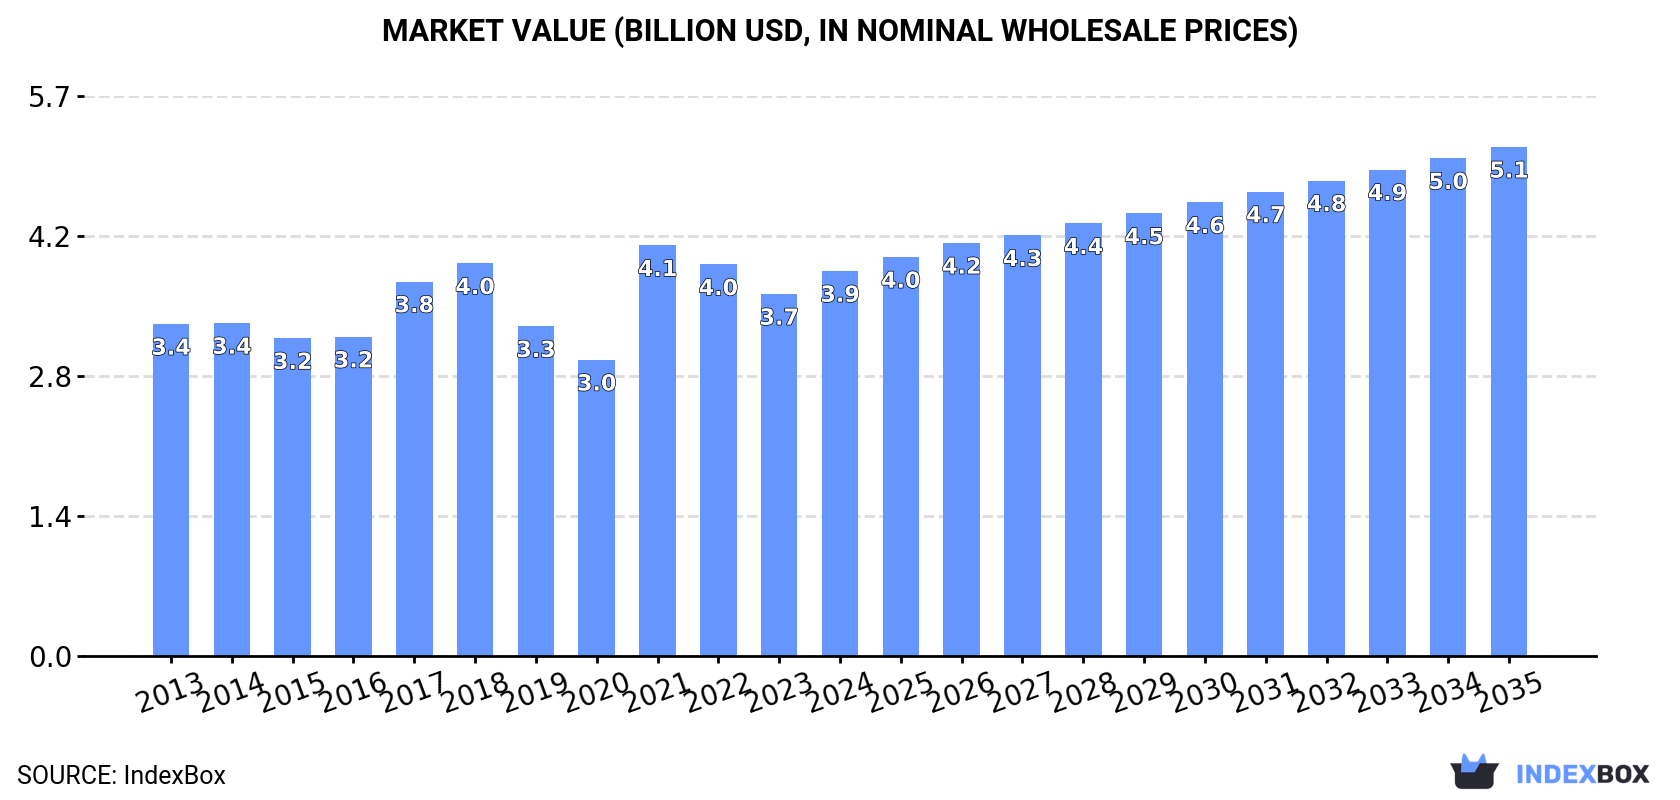
The market for polycarbonates in the European Union is projected to experience steady growth over the next decade, with a forecasted CAGR of +1.4% in volume and +2.6% in value from 2024 to 2035. This growth is driven by increasing demand for polycarbonates and is expected to reach 1.4M tons in volume and $5.1B in value by the end of 2035.
Market Forecast
Driven by increasing demand for polycarbonates (in primary forms) in the European Union, the market is expected to continue an upward consumption trend over the next decade. Market performance is forecast to retain its current trend pattern, expanding with an anticipated CAGR of +1.4% for the period from 2024 to 2035, which is projected to bring the market volume to 1.4M tons by the end of 2035.
In value terms, the market is forecast to increase with an anticipated CAGR of +2.6% for the period from 2024 to 2035, which is projected to bring the market value to $5.1B (in nominal wholesale prices) by the end of 2035.
 ConsumptionEuropean Union’s Consumption of Polycarbonates (In Primary Forms)
After two years of decline, consumption of polycarbonates (in primary forms) increased by 9% to 1.2M tons in 2024. Overall, consumption showed a relatively flat trend pattern. As a result, consumption reached the peak volume of 1.4M tons. From 2022 to 2024, the growth of the consumption remained at a somewhat lower figure.
The value of the polycarbonate market in the European Union expanded remarkably to $3.9B in 2024, growing by 6.3% against the previous year. This figure reflects the total revenues of producers and importers (excluding logistics costs, retail marketing costs, and retailers’ margins, which will be included in the final consumer price). The market value increased at an average annual rate of +1.4% over the period from 2013 to 2024; the trend pattern remained consistent, with only minor fluctuations in certain years. As a result, consumption reached the peak level of $4.1B. From 2022 to 2024, the growth of the market remained at a lower figure.
Consumption By Country
Germany (382K tons) remains the largest polycarbonate consuming country in the European Union, accounting for 31% of total volume. Moreover, polycarbonate consumption in Germany exceeded the figures recorded by the second-largest consumer, Spain (163K tons), twofold. Italy (140K tons) ranked third in terms of total consumption with an 11% share.
From 2013 to 2024, the average annual growth rate of volume in Germany amounted to -1.4%. In the other countries, the average annual rates were as follows: Spain (+7.0% per year) and Italy (+2.9% per year).
In value terms, Germany ($1.3B) led the market, alone. The second position in the ranking was held by Spain ($491M). It was followed by the Netherlands.
In Germany, the polycarbonate market remained relatively stable over the period from 2013-2024. The remaining consuming countries recorded the following average annual rates of market growth: Spain (+6.5% per year) and the Netherlands (+1.6% per year).
The countries with the highest levels of polycarbonate per capita consumption in 2024 were Slovakia (7.4 kg per person), the Netherlands (7.1 kg per person) and Hungary (6.3 kg per person).
From 2013 to 2024, the biggest increases were recorded for Spain (with a CAGR of +6.9%), while consumption for the other leaders experienced more modest paces of growth.
ProductionEuropean Union’s Production of Polycarbonates (In Primary Forms)
In 2024, production of polycarbonates (in primary forms) was finally on the rise to reach 1M tons after two years of decline. In general, production, however, recorded a slight curtailment. The pace of growth appeared the most rapid in 2021 when the production volume increased by 5.3%. As a result, production reached the peak volume of 1.3M tons. From 2022 to 2024, production growth failed to regain momentum.
In value terms, polycarbonate production amounted to $3.3B in 2024 estimated in export price. Overall, production, however, saw a relatively flat trend pattern. The growth pace was the most rapid in 2021 with an increase of 28%. Over the period under review, production hit record highs at $4.1B in 2018; however, from 2019 to 2024, production stood at a somewhat lower figure.
Production By Country
The countries with the highest volumes of production in 2024 were Spain (261K tons), Germany (249K tons) and the Netherlands (240K tons), together accounting for 74% of total production. Belgium, Italy and Hungary lagged somewhat behind, together accounting for a further 25%.
From 2013 to 2024, the most notable rate of growth in terms of production, amongst the main producing countries, was attained by Italy (with a CAGR of +3.5%), while production for the other leaders experienced a decline in the production figures.
ImportsEuropean Union’s Imports of Polycarbonates (In Primary Forms)
In 2024, overseas purchases of polycarbonates (in primary forms) were finally on the rise to reach 872K tons after two years of decline. The total import volume increased at an average annual rate of +2.0% over the period from 2013 to 2024; however, the trend pattern indicated some noticeable fluctuations being recorded in certain years. The pace of growth was the most pronounced in 2021 with an increase of 20%. As a result, imports reached the peak of 1M tons. From 2022 to 2024, the growth of imports failed to regain momentum.
In value terms, polycarbonate imports dropped to $2.9B in 2024. Total imports indicated a moderate increase from 2013 to 2024: its value increased at an average annual rate of +2.2% over the last eleven-year period. The trend pattern, however, indicated some noticeable fluctuations being recorded throughout the analyzed period. Based on 2024 figures, imports decreased by -10.4% against 2022 indices. The most prominent rate of growth was recorded in 2021 when imports increased by 50% against the previous year. The level of import peaked at $3.2B in 2022; however, from 2023 to 2024, imports failed to regain momentum.
Imports By Country
In 2024, Italy (161K tons) and Germany (133K tons) were the main importers of polycarbonates (in primary forms) in the European Union, together mixing up 34% of total imports. Poland (78K tons) ranks next in terms of the total imports with an 8.9% share, followed by the Czech Republic (8.7%), Slovakia (6.1%), Spain (5.9%), the Netherlands (5.9%), Hungary (5.8%) and France (5.1%).
From 2013 to 2024, the most notable rate of growth in terms of purchases, amongst the leading importing countries, was attained by Spain (with a CAGR of +7.4%), while imports for the other leaders experienced more modest paces of growth.
In value terms, the largest polycarbonate importing markets in the European Union were Germany ($447M), Italy ($440M) and the Czech Republic ($263M), together accounting for 40% of total imports. Poland, Slovakia, the Netherlands, Spain, France and Hungary lagged somewhat behind, together comprising a further 39%.
The Netherlands, with a CAGR of +6.2%, saw the highest rates of growth with regard to the value of imports, among the main importing countries over the period under review, while purchases for the other leaders experienced more modest paces of growth.
Import Prices By Country
The import price in the European Union stood at $3,314 per ton in 2024, falling by -4.2% against the previous year. Overall, the import price, however, showed a relatively flat trend pattern. The most prominent rate of growth was recorded in 2021 when the import price increased by 25% against the previous year. Over the period under review, import prices reached the peak figure at $3,530 per ton in 2022; however, from 2023 to 2024, import prices failed to regain momentum.
Average prices varied somewhat amongst the major importing countries. In 2024, major importing countries recorded the following prices: in France ($3,851 per ton) and Slovakia ($3,578 per ton), while Italy ($2,729 per ton) and Hungary ($2,882 per ton) were amongst the lowest.
From 2013 to 2024, the most notable rate of growth in terms of prices was attained by the Netherlands (+3.9%), while the other leaders experienced more modest paces of growth.
ExportsEuropean Union’s Exports of Polycarbonates (In Primary Forms)
In 2024, shipments abroad of polycarbonates (in primary forms) decreased by -7.6% to 657K tons, falling for the third year in a row after nine years of growth. Over the period under review, exports continue to indicate a mild setback. The growth pace was the most rapid in 2015 when exports increased by 8.8% against the previous year. Over the period under review, the exports reached the maximum at 981K tons in 2021; however, from 2022 to 2024, the exports remained at a lower figure.
In value terms, polycarbonate exports declined to $2.2B in 2024. In general, exports showed a relatively flat trend pattern. The pace of growth was the most pronounced in 2021 when exports increased by 33%. The level of export peaked at $3B in 2022; however, from 2023 to 2024, the exports failed to regain momentum.
Exports By Country
In 2024, the Netherlands (166K tons), Spain (150K tons) and Belgium (136K tons) was the major exporter of polycarbonates (in primary forms) in the European Union, making up 69% of total export. Italy (79K tons) took the next position in the ranking, followed by Hungary (37K tons). All these countries together held near 18% share of total exports. The following exporters – Poland (24K tons) and the Czech Republic (12K tons) – together made up 5.6% of total exports.
From 2013 to 2024, the biggest increases were recorded for Poland (with a CAGR of +14.5%), while shipments for the other leaders experienced more modest paces of growth.
In value terms, the largest polycarbonate supplying countries in the European Union were the Netherlands ($592M), Spain ($451M) and Belgium ($439M), together comprising 66% of total exports. Italy, Hungary, Poland and the Czech Republic lagged somewhat behind, together comprising a further 26%.
Among the main exporting countries, Poland, with a CAGR of +16.0%, recorded the highest growth rate of the value of exports, over the period under review, while shipments for the other leaders experienced more modest paces of growth.
Export Prices By Country
The export price in the European Union stood at $3,401 per ton in 2024, waning by -4.3% against the previous year. Over the last eleven-year period, it increased at an average annual rate of +1.3%. The most prominent rate of growth was recorded in 2021 when the export price increased by 31% against the previous year. Over the period under review, the export prices reached the maximum at $3,566 per ton in 2022; however, from 2023 to 2024, the export prices failed to regain momentum.
Average prices varied somewhat amongst the major exporting countries. In 2024, major exporting countries recorded the following prices: in Italy ($4,179 per ton) and the Netherlands ($3,563 per ton), while Spain ($3,012 per ton) and the Czech Republic ($3,212 per ton) were amongst the lowest.
From 2013 to 2024, the most notable rate of growth in terms of prices was attained by the Czech Republic (+2.4%), while the other leaders experienced more modest paces of growth.
Source: IndexBox Market Intelligence Platform