1,141 notified TB cases met the inclusion criteria across the study period. Of these, 1,096 (96%) were Welsh individuals treated in Wales and thus information on culture positivity was available. Samples from 796 of those were culture positive (72.6%), with 280 of those (35.2%) subsequently being sequenced. Of all cases that were not sequenced (n = 1,141–280 = 861), 689 were culture positive (80%).
This sequencing coverage may, however, be an underestimation due to data linkage constraints. In addition, WGS for TB did not become routine in Wales until 2019, so prior to this point, only a subset of samples were sequenced, primarily for testing and validation purposes. From 2019 onwards, the PenGU routinely sequenced culture positive samples whenever possible, such that sequencing coverage has subsequently improved. Indeed, of the 1,096 patients treated in Wales over the study period, 317 (28.9%) were notified from 2019 onwards, and samples from 250 of those were culture positive (78.9%), of which 203 were subsequently sequenced (81.2%). Of the 114 cases since 2019 that were not sequenced, 90 were culture-positive (78.9%).
Different subsets of the sequenced cases had subsequently been submitted to the UKHSA drug resistance and clustering pipelines. Consequently, of the 1,141 total notified TB cases, 215 (18.8%) were eligible for the clustering analysis reported below, and 238 (20.9%) were eligible for the resistance profile analysis (Fig. 1).
Fig. 1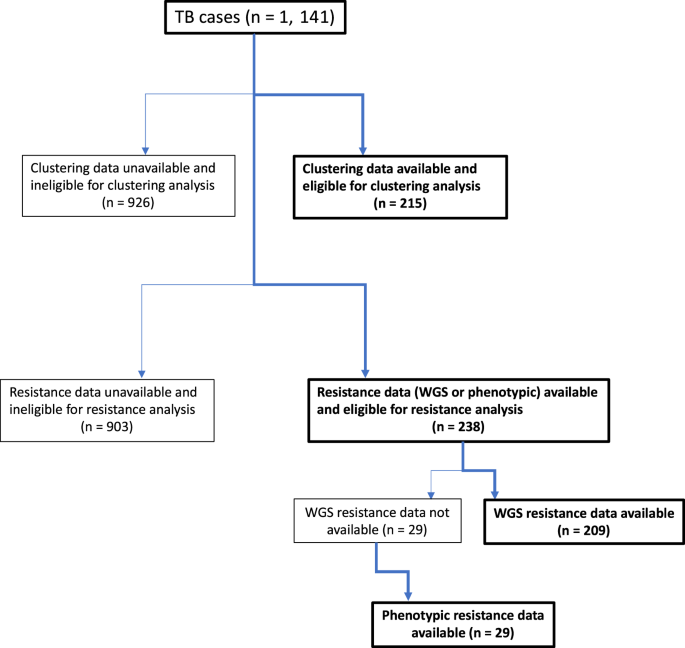
Flowchart of cases eligible and included in the clustering analysis and cases eligible and included in the resistance analysis of all eligible TB cases over the study period.
Sample demographics/characteristics
115/215 included cases were part of 30 genomic clusters. These clusters belonged to Lineage 2 (n = 5), Lineage 3 (n = 5), and Lineage 4 (n = 17) (Fig. 2a). The lineage was unknown for three clusters. Case dates ranged from 2012 to 2022 with the majority of cases from 2019 onwards. Clusters belonging to Lineage 2 were the smallest in size, with a maximum of four cases per cluster. The maximum cluster size in Lineage 3 was 10 cases, whilst for Lineage 4 it was 19. Most clusters/cases were located in local authorities in South Wales, with the exception of five clusters in North Wales, and four in West Wales (Fig. 2b).
Fig. 2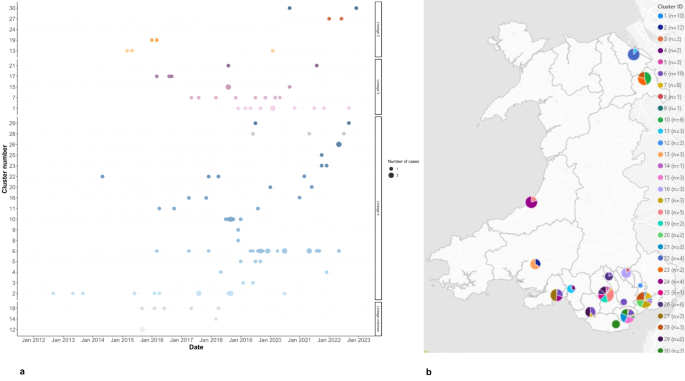
(a) Timeline of genotypic TB clusters in Wales, 2012–2022. Clusters are ordered on the y-axis by TB lineage, and the number of cases is indicated by the size of the dots. TB Lineages are given by the point colours: Lineage 2 = orange; Lineage 3 = purple; Lineage 4 = blue; Lineage unknown = grey. (b) Map showing the number of genotypic clusters per local authority, in Wales, 2012–2022. Pie chart size indicates the number of cases, colour indicates the cluster ID. Note: A small number of clusters are shown as comprising N = 1 cases over the study period because other linked cases were notified outside the study window or could not be retrieved from NTBS.
The characteristics of the study population and the sub-population that were part of a genomic cluster are summarised in Table 1. Approximately two thirds of the cases, and cases part of a genomic cluster, were male. The largest proportion of cases, approximately a quarter, were aged 25–34. The same was true of those in a genomic cluster although a similar number were aged 35–44 and 45–54. Few cases were under 19 years of age. There was a significant difference between the sample and Welsh population distributions for age group (X2 = 466.02, p 3).
Table 1 Demographic and clinical characteristics of genomic clustered and non-clustered cases in wales, united Kingdom 2012–2022. Univariate and multivariable regression analysis on the factors associated with genomic clustering.Fig. 3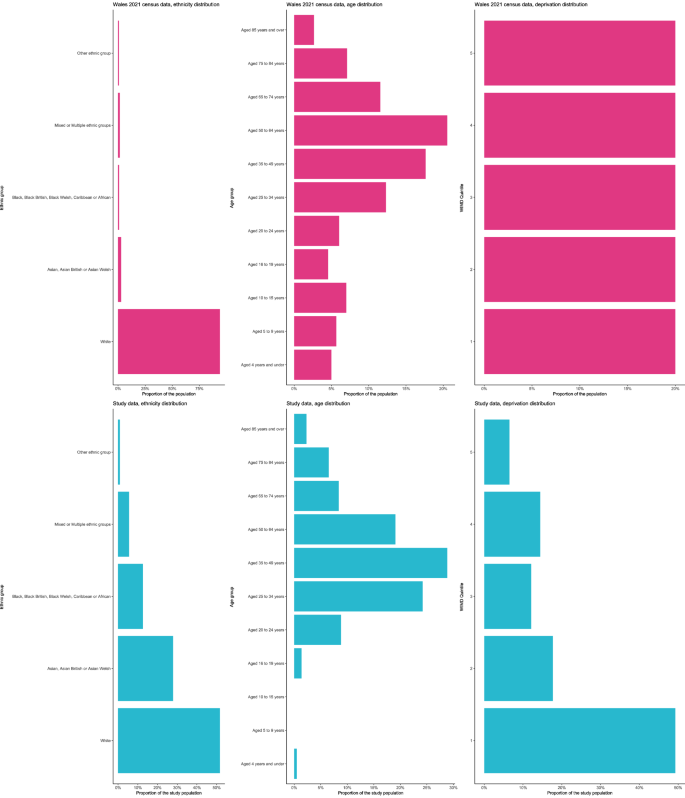
Distribution of ethnic groups, age groups and WIMD in the study population (blue) vs. the Welsh population (Census data from 2021) (pink). Note: Unknowns within the study data have not been visualised, counts can be found within Table 1.
Over two thirds of cases part of a genomic cluster were UK-born despite overall, a similar number of cases being born outside of the UK. Over half of cases, and cases part of a genomic cluster, were White. There was a significant difference between the sample and Welsh population distributions for ethnicity (X2 = 7635.9, p 3), reflecting the disproportionate representation of non-White ethnic groups in our study sample.
Almost half of the cases, and more than half of the cases that were part of a genomic cluster lived within WIMD quintile 1 (the most deprived). The fewest number of cases lived within in WIMD quintile 5 (least deprived). There was a significant difference between the sample and Welsh population distributions for WIMD quintile (X2 = 122.51, p 3), reflecting the disproportionate representation of individuals living within WIMD quintile 1.
Over a quarter of cases had at least one social factor potentially associated with genomic clustering (imprisonment, homelessness status, drug misuse, and/or alcohol misuse); more than two thirds of these cases belonged to a genomic cluster. More than 40% of all cases which were part of a genomic cluster had any social factor potentially associated with genomic clustering. Most cases, and cases part of a genomic cluster, had pulmonary TB.
Factors associated with genomic clustering
Fisher’s exact tests (Table 1) revealed that for country of birth, ethnic group, WIMD quintile, any social factor potentially associated with genomic clustering, diabetes, and site of disease, there was a statistically significant relationship with being part of a genomic cluster (Table 1).
In the univariate analysis, the odds of being in a genomic cluster were greater for cases with any social factor potentially associated with genomic clustering, compared to those without (OR = 2.98, 95% CI = [1.6–5.71], p p = 0.006); OR = 0.4, 95% CI = [0.17–0.94], p = 0.038; OR = 0.43, 95% CI = [0.18–0.97], p = 0.047).
The odds of being in a genomic cluster for cases born in the UK were increased in both the univariate and multivariate model, compared to those born outside of the UK, (aOR = 14.1, 95% CI = [4.67–47.8], p p = 0.008). The odds of being in a genomic cluster for cases living in WIMD quintile 3 were decreased in both the univariate and multivariate model, compared to those living in quintile 1, (aOR = 0.24, 95% CI = [0.06–0.86], p = 0.032).
Finally, 208 cases were included in the treatment outcome analysis; seven cases were excluded as outcome was unknown. The aOR of having a favourable outcome when part of a genomic cluster was not significantly different. A statistically significant result was observed, however, for those who were immunosuppressed (aOR = 0.16 95% CI = [0.03–0.61], p = 0.007), and whose HIV status was unknown.
Drug resistance analysis
Resistance/predicted resistance was low amongst all drugs: isoniazid (2.52%), ethambutol (1.68%), rifampicin (1.26%), aminoglycosides (0.42%), pyrazinamide (0.42%), and quinolone (0.42%). The proportion of cases for which the degree of resistance or predicted resistance was unknown or not tested ranged from 0 to 36.97% (Fig. 4). One case was MDR, but there were no cases of pre-XDR or XDR TB.
Fig. 4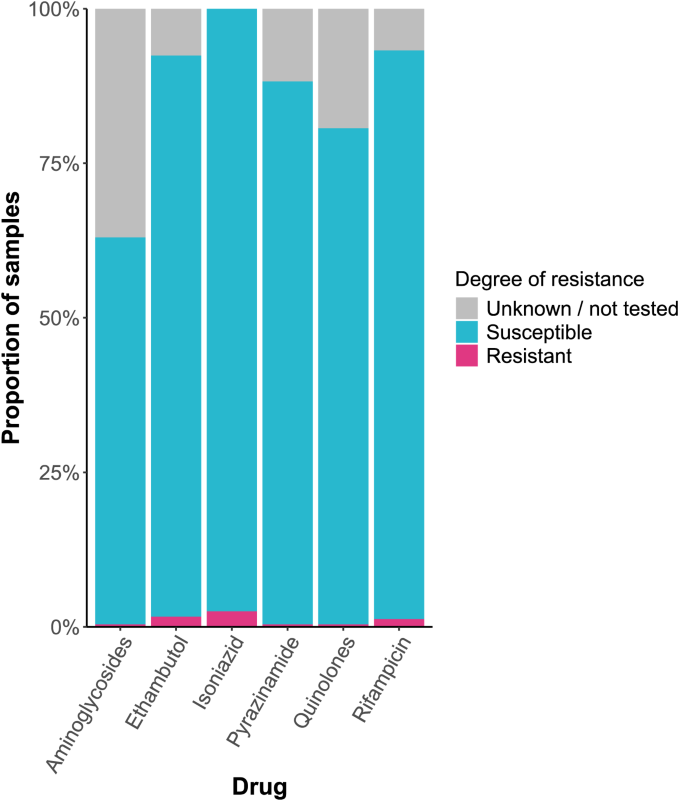
Resistance profile of Mycobacterium tuberculosis in Wales, 2014–2022.