Integrating genetics, plasma metabolomics and dietary intakes to study ADRD etiology in long-running prospective studies
We prospectively followed 4,215 women in the NHS from 1989 to 2023 (mean age, at baseline, 57 years; Fig. 1a and Supplementary Table 1), during which 485 participants developed dementia. In addition, we longitudinally assessed objective cognitive function using a telephone-based battery, including the Telephone Interview for Cognitive Status (TICS), in a subset of 1,037 participants (1995–2008). In the replication analyses in the HPFS, 1,490 men (mean age 63 years at baseline) were prospectively followed from 1993 to 2023, with 121 dementia cases documented (Extended Data Fig. 1a and Supplementary Table 2). Details of baseline characteristics in both cohorts are provided in Supplementary Text.
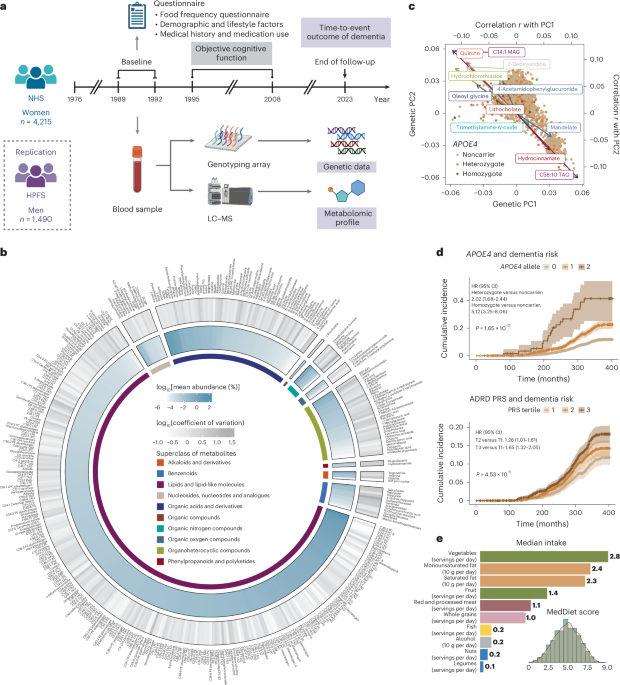
Fig. 1: Prospective cohort studies examining the interrelationship of genetics, plasma metabolomics, MedDiet, cognitive function and dementia risk.
a, Prospective follow-up of 4,215 women in the NHS from 1989 to 2023. Genetic and metabolomic profiles were generated from blood samples collected at baseline. Detailed demographic, lifestyle, dietary, medical history and medication use data were collected via questionnaires. Dementia cases were ascertained through the follow-up as a composite endpoint of incident dementia and death due to dementia. In addition, a telephone-based neuropsychological assessment battery was administered longitudinally from 1995 to 2008 to assess cognitive function in a subset of 1,037 participants. A total of 1,490 men from the HPFS were included as a replication cohort (Extended Data Fig. 1a). b, Distribution of plasma metabolites (n = 401). The outer circle represents the variation of each metabolite, with a gradient in gray indicating the coefficient of variation. The inner circle displays the mean relative abundance of each metabolite, shown as a gradient in blue. The innermost circle color codes represent the different HMDB superclasses defined based on chemical structural similarities. c, Overall genetic structure associated with individual metabolites. Each dot represents an individual and is colored by APOE4 genotype, showing no clear pattern between the overall population substructure and APOE4 genotype. The metabolites with the highest Pearson’s correlations with the top two genetic PCs from each metabolite superclass are included on the plot as arrows, colored by their superclass (see legend for b). The arrowhead coordinates represent the correlation coefficients of the metabolites with genetic PC1 and PC2. d, Associations between established genetic risk factors for AD/ADRD and dementia risk. The lines indicate cumulative incidence across APOE4 genotypes and tertiles of the PRS of ADRD (excluding the APOE region) over the follow-up period, with shaded areas representing 95% CIs and P values from the log-rank test annotated. Consistent with the curves, unadjusted hazard ratios (HRs) were estimated using Cox proportional hazards (PH) model; covariate-adjusted HRs with 95% confidence intervals (CIs) are provided in Supplementary Table 4. Person time was accrued from baseline until the earliest occurrence of an incident dementia case, dementia death or the end of follow-up. No adjustment was made for multiple comparisons, because this was a hypothesis-driven analysis. e, A wide range of adherence to the MedDiet, as assessed by a dietary index and intake levels of food and nutrient components of MedDiet. All analyses and distributions were based on data from 4,215 NHS participants. All statistical tests were two sided. MAG, monoacylglycerol; TAG, triacylglycerol. Panel a created using BioRender.com.
Metabolomic data were generated from plasma samples using a liquid chromatography–mass spectrometry (LC–MS)-based platform in both the NHS and the HPFS; a total of 401 metabolites from 10 Human Metabolome Database (HMDB) superclasses were included in the NHS analyses after quality control (QC), with 254 of the metabolites available in the HPFS (Fig. 1b and Supplementary Table 3). Genotyping data were generated from blood samples, followed by QC and imputation (Methods). We extracted the two APOE variants along with 73 other common variants identified from AD/ADRD GWASs9,21 and calculated two polygenic risk scores (PRSs) for ADRD; one included the two APOE variants and one excluded the APOE region, using weights from published studies9,21. We first investigated the global influence of genetic variations on the plasma metabolome, using principal components (PCs) to capture genetic structure. Strong correlations were observed between genetic PC1 or PC2 and metabolites previously linked to ADRD risk, such as trimethylamine N-oxide22 and lithocholate23 (Fig. 1c and Extended Data Fig. 2a). We next assessed the specific influence of APOE4 genotype on the metabolome. As expected, APOE4 homozygosity was broadly associated with elevated lipid metabolites compared to noncarriers (Extended Data Fig. 2b).
To validate the dementia outcome, we examined plasma phosphorylated tau 217 (p-tau217), an established biomarker for early AD diagnosis24, in 103 NHS participants and found an approximately 3-fold higher dementia risk comparing the highest and lowest quartiles of p-tau217. We further confirmed that carrying APOE4 alleles or having a higher PRS of ADRD was associated with significantly increased risk of dementia and poorer cognitive function in both cohorts (Fig. 1d, Extended Data Fig. 1b, Supplementary Fig. 1, Supplementary Table 4 and Supplementary Text).
We collected long-term dietary data using extensively validated semiquantitative food frequency questionnaires (SFFQs) in both cohorts. To assess dietary quality, we employed the MedDiet index, the only dietary pattern causally linked to delayed cognitive decline in a long-term, randomized controlled trial25. A widespread distribution of MedDiet adherence was observed (Fig. 1e), with higher MedDiet index scores associated with older age, lower body mass index, higher education level and more physical activity (Supplementary Tables 2 and 5).
APOE4 homozygosity exhibited distinct metabolomic profiles of dementia risk
We identified 49 significant interactions of metabolites with APOE4 genotypes in relation to dementia risk at a false discovery rate (FDR) 2a,b, Extended Data Fig. 3 and Supplementary Table 6). All significant interactions were specific to APOE4 homozygotes, aligning with recent findings on this isoform in AD pathology7 and suggesting that it exhibits a distinct plasma metabolomic profile associated with ADRD risk, evident even decades before disease onset.
Fig. 2: Associations of plasma metabolomic profiles, dementia risk and cognitive function differ according to individuals’ genetic predisposition to AD/ADRD.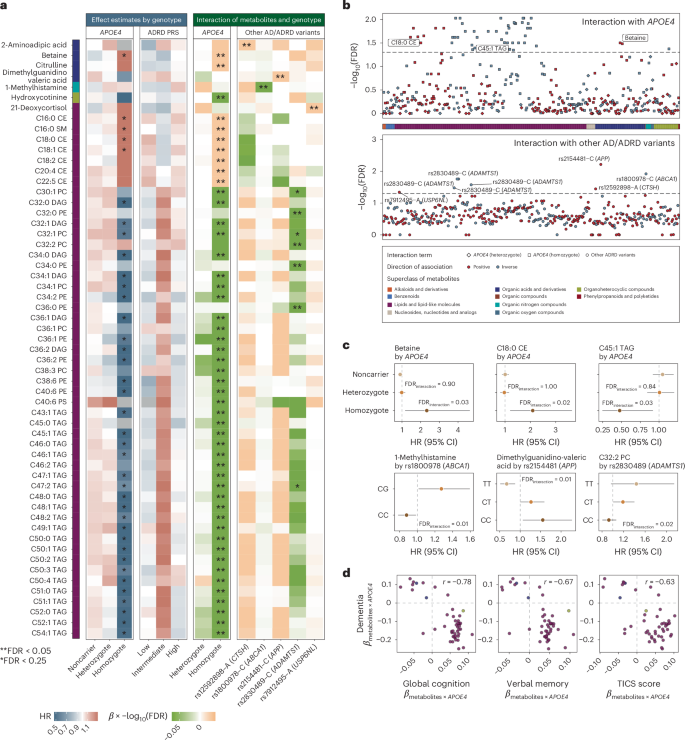
a, Significant variation in the association between metabolites and dementia risk across different genotypes. Left, in the two heatmaps, the color gradient denoting the HR for dementia risk per 1-s.d. increment in metabolite levels among individuals with different genetic predispositions, as defined by APOE4 genotype or PRS of ADRD (including the APOE variants), estimated using Cox PH model. Only metabolites with FDR β coefficient and the −log10(FDR) of the interaction term between each metabolite and genotype, as defined by the APOE4 genotype or other common AD/ADRD genetic variants, from Cox PH model. In all heatmaps, associations or interactions with FDR b, Gene–metabolite interactions related to dementia risk widely distributed across metabolite superclasses and genotypes. The Manhattan plot displays metabolome-wide interaction results, represented by −log10(FDR) values for interaction terms from Cox PH models. Each dot represents a metabolite colored by the direction of interaction and grouped by HMDB superclass. Top, for the APOE4 genotype, the data point with the lower FDR between heterozygous (diamond) and homozygous (square) APOE4 interactions included for each metabolite. Bottom, for other common AD/ADRD variants, the most significant interaction across all 73 variants shown for each metabolite. The analyses were conducted among 4,215 NHS participants. c, Selected associations between metabolites and dementia risk with FDR for interaction APOE4 genotype, with FDR values for interaction terms between APOE4 heterozygosity and homozygosity annotated (using the noncarrier as the reference group). The second row displays stratified results (HR and 95% CIs per 1-s.d. increment in metabolite level) by AD/ADRD variants, with FDR values for interaction terms with the variant effect allele dosage annotated. Genotype groups were defined based on rounded allele dosages. Results for the rs1800978 GG genotype group are excluded due to data sparsity. The analyses were conducted across 4,215 NHS participants. d, Consistency of metabolite–APOE4 interaction results across models with dementia risk and cognitive function as dependent variables. Each dot represents a metabolite with significant APOE4 interactions, colored by the HMDB superclass. Pearson’s correlation coefficients in the β coefficients for interaction terms between metabolites and APOE4 carrier status estimated from Cox PH models, with dementia as the dependent variable, and from generalized linear models, with cognitive function scores as the dependent variable, are annotated on each figure. APOE4 carriers were not further divided into heterozygotes and homozygotes due to data sparsity among homozygotes with non-missing values for each metabolite in the cognitive function subset. Dementia risk analyses were conducted among 4,215 NHS participants and cognitive function analyses among 1,037 NHS participants. All statistical tests were two sided. DAG, diacylglycerol; PC, phosphatidylcholine; PE, phosphatidylethanolamine; TAG, triacylglycerol.
Subgroup analyses further confirmed distinct association patterns between metabolites and dementia risk among APOE4 homozygotes compared to others, with variations in both the magnitude and, in some cases, the direction of associations (Fig. 2a, Supplementary Fig. 2 and Supplementary Table 7). For example, a significant positive association between betaine and dementia risk was observed only among APOE4 homozygotes (Fig. 2c). Plasma betaine levels reflect both dietary intake and one-carbon metabolism activity26. The protective, albeit nonsignificant, association observed among APOE4 noncarriers and heterozygotes may primarily reflect dietary betaine’s benefit for cognitive health27, whereas, in APOE4 homozygotes, elevated betaine may indicate methylation imbalance and metabolic dysregulation, contributing to an increased dementia risk26,28. We observed broadly positive associations across cholesteryl esters (CEs), sphingomyelins (SMs) and dementia risk in all genetic risk groups, with the strongest associations in APOE4 homozygotes. The APOE4 allele promotes the accumulation of cholesterol and CEs in the brain29, activating inflammatory pathways that exacerbate neuronal damage and contributing to the formation of amyloid plaques and tau tangles, thereby increasing dementia risk30. We observed inverse associations between glycerides and dementia risk, specifically among APOE4 homozygotes, where elevated glyceride levels likely reflect this reduced delipidation, which may, in turn, limit the aggregation of apolipoprotein E (ApoE) and the formation of amyloid plaques31.
Replication of the findings for dementia risk in objective cognitive function yielded broadly consistent results (Pearson’s r ranging from −0.78 to −0.63 for the interaction effect estimates; Fig. 2d and Supplementary Tables 8 and 9). Sensitivity analyses, excluding family history of dementia from the covariates or modeling dementia case and death separately, showed similar results (Supplementary Figs. 3 and 4). Independent replication of the NHS findings in the HPFS yielded broadly consistent results (Pearson’s r = 0.40), with 32 out of 38 significant interactions (84.2%) in the same direction. Notably, 4 interactions reached P P 4 and Supplementary Table 10).
Common AD/ADRD risk variants modified the associations between plasma metabolites and dementia risk
Although APOE4 is the major contributor to the genetic risk of dementia, recent GWASs have identified many other common variants linked to AD/ADRD risk8,9. We examined how these risk variants, either aggregated into PRSs or as individual variants, may modify the associations between metabolites and dementia risk (Supplementary Tables 11 and 12). Although no significant interaction between PRSs and metabolites was detected after multiple testing correction (Fig. 2a and Supplementary Tables 13 and 14), we identified eight significant interactions between individual AD/ADRD variants, including those mapped to ABCA1, APP, ADAMTS1, CTSH and USP6NL, and metabolites in relation to dementia risk with an FDR 2a,b, Supplementary Fig. 5 and Supplementary Table 15).
We observed that the positive association between 1-methylhistamine, a metabolite involved in immune and inflammatory responses in the brain32 (Fig. 2c), and dementia risk was significantly more pronounced in individuals carrying the rs1800978-G allele mapped to ABCA1, a gene that plays a crucial role in clearing Aβ peptide from the brain33. Dimethylguanidino-valeric acid, a metabolite associated with impaired fatty acid and amino acid metabolism, showed a stronger positive association with dementia risk among individuals carrying the C allele at rs2154481, a variant mapped to the APP gene that encodes Aβ precursor protein (APP), suggesting that dysregulated lipid and glucose metabolism may influence the processing of APP, leading to increased Aβ production34. In addition, lipid metabolites showed significant interactions with AD/ADRD genetic variants. For example, C32:2 phosphatidylcholine exhibited a positive interaction with an ADAMTS1-linked variant (rs2830489-T), implicating extracellular matrix remodeling and neuroinflammation in neurodegeneration35 (Supplementary Text).
MedDiet may more effectively modulate metabolites implicated in dementia risk in APOE4 homozygotes
A key distinction between metabolomics and genetics is that metabolites can be modified by exogenous factors and may serve as targets for intervention; in particular, diet significantly impacts the metabolome36. We thus examined whether diet, specifically the MedDiet, which has been implicated in cognitive health25, could modulate metabolite levels in individuals with different genetic predispositions to AD/ADRD.
We found that individuals with greater adherence to the MedDiet had a significantly lower risk of dementia and better cognitive function (Fig. 3a and Supplementary Fig. 6). Notably, these protective associations for dementia risk were more pronounced among APOE4 homozygotes compared to noncarriers and heterozygotes (Fig. 3b), although no clear trend was observed when stratifying by ADRD PRS (Extended Data Fig. 5). The same patterns were observed in the HPFS (Extended Data Fig. 6a,b). Next, to evaluate MedDiet’s impact on the overall metabolomic profile, we used a random Forest (RF) classifier to distinguish individuals with high versus low MedDiet adherence based on plasma metabolite levels. This classifier demonstrated excellent performance, with an area under the receiver operating characteristic (ROC) curve (AUC) of 0.76 in the NHS (Fig. 3c) and 0.72 when replicating in the HPFS (Extended Data Fig. 6c). In addition, individual components of the MedDiet, such as nuts, fruit and monounsaturated fats, were strongly associated with overall metabolomic patterns, as captured by the top two metabolite PCs (Extended Data Fig. 7).
Fig. 3: MedDiet adherence is associated with cognitive health and plasma metabolites in an APOE4-dependent manner.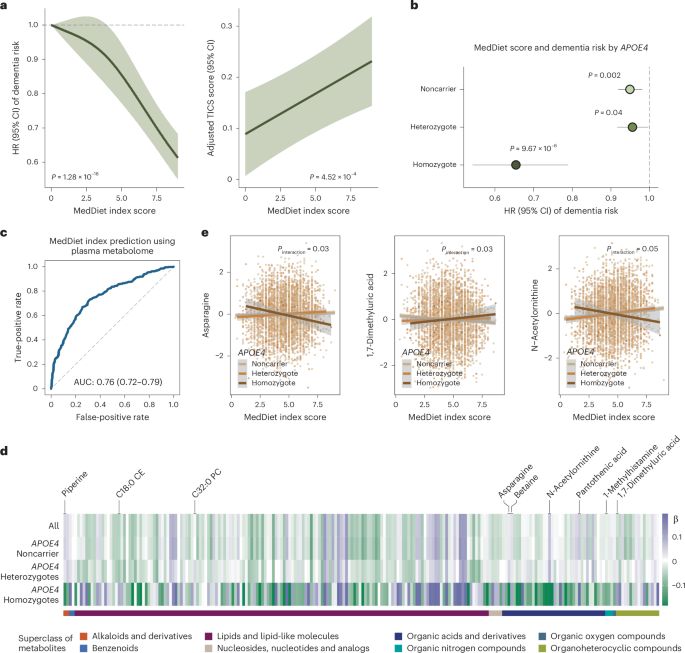
a, Higher adherence to the MedDiet prospectively associated with a lower risk of dementia and enhanced cognitive performance, as assessed by the telephone-based neuropsychological assessment battery (TICS). For dementia risk analysis, a restricted cubic spline Cox PH model estimated HRs and 95% CIs across varying levels of the MedDiet index, using 0 as the reference. The P value from a likelihood ratio test comparing the model without the MedDiet index and the model with its spline term is annotated. For the TICS score analysis, a generalized linear model estimated the adjusted TICS score and corresponding 95% CI across MedDiet index levels, with P values annotated. The analyses were conducted among NHS participants with cognitive and dietary data (n = 86,740 for dementia analysis and n = 16,244 for cognitive function analysis). b, The protective association between adherence to the MedDiet and risk of dementia most pronounced among APOE4 homozygotes. Stratified HR and 95% CIs for dementia risk per a 1-unit increment in the MedDiet index score, categorized by the APOE4 genotype, were estimated from Cox PH models, with stratified P values annotated (unadjusted for multiple comparisons in the hypothesis-driven analysis). The analyses were conducted among NHS participants with genetic, dietary and dementia outcome data (n = 16,497). c, Strong association between adherence to MedDiet and the overall plasma metabolome from an RF model to classify individuals in the top versus the bottom quartile of the MedDiet index based on plasma metabolites. For the RF classification, the dataset was randomly divided into training (60%) and test (40%) sets. The ROC curve for the test set is shown, with the AUC and 95% CI annotated on the plot. The analyses were conducted among 4,215 NHS participants. d, Associations between MedDiet adherence and plasma metabolite levels differing by APOE4 genotype. The heatmap shows β coefficients representing a 1-s.d. increment in the MedDiet index from a generalized linear model, with plasma metabolite levels as the dependent variable. The analyses were conducted among 4,215 NHS participants. e, Select associations between the MedDiet index and plasma metabolite levels with P APOE4 genotype and MedDiet index in relation to metabolites, using a generalized linear model stratified by APOE4 genotype. Covariate-adjusted residuals of metabolites are shown along with fitted linear regression lines, 95% CIs and P values for interaction. These results were not adjusted for multiple testing. The analyses were conducted across 4,215 NHS participants. All statistical tests were two sided.
To assess whether the metabolic response to MedDiet is genotype dependent, particularly in relation to APOE4, we examined the association between MedDiet adherence and metabolite levels across APOE4 genotypes. As anticipated, the overall association patterns differed among APOE4 homozygotes and heterozygotes compared to noncarriers (Fig. 3d and Supplementary Table 16), with interaction analysis supporting these distinctions (Supplementary Table 17). Similar patterns were observed in the HPFS (Extended Data Fig. 6d, Supplementary Fig. 7 and Supplementary Table 18). Consistent with findings from the PREDIMED trial involving a randomized MedDiet37, greater adherence to the MedDiet was associated with higher levels of unsaturated glycerides and lower levels of saturated glycerides, lipid patterns potentially beneficial for cognitive health, as well as increased levels of established neuroprotective compounds, including piperine, betaine and pantothenic acid38,39 (Extended Data Fig. 8 and Supplementary Table 16). Among the metabolites showing suggestive APOE4–MedDiet interactions (P APOE4 homozygotes (Fig. 3e). This may reflect MedDiet-driven changes in amino acid metabolism, including glutaminolysis and the tricarboxylic acid cycle, which are key to asparagine regulation. Given asparagine’s role in protein and nucleotide synthesis, its reduction may signal broader metabolic benefits specific to APOE4 homozygotes40. We also identified nominally significant interactions between MedDiet and the APOE4 genotype in relation to 1,7-dimethyluric acid, a derivative of caffeine metabolism with established antioxidant properties and potential neuroprotective effects41 (Supplementary Text).
Furthermore, we found that 39.5% of the association between MedDiet adherence and dementia risk was mediated by a set of metabolites among APOE4 carriers (P = 0.05), whereas no mediation effect was observed among noncarriers or in the full dataset (Methods). Besides the APOE4 genotype, broad interactions were also observed for ADRD PRS and individual variants (Supplementary Tables 19–21). These findings collectively indicated that the MedDiet’s potential to modulate cognitive health-related metabolites varied by APOE4 genotype, suggesting that this dietary pattern could be an effective strategy to delay dementia onset in APOE4 homozygotes, despite their higher risk profile.
Prediction of dementia risk using genetic, metabolomic and dietary factors
Given that genetics, metabolites and MedDiet adherence are all linked to dementia risk, we further examined how incorporating these factors could enhance the prediction of cognitive outcomes. Compared to a baseline model, which included age, family history of dementia, education level, smoking status, history of depression or regular antidepressant drug use and the MedDiet index, adding APOE4 and ADRD PRS to Cox model moderately improved the performance for predicting dementia risk (Fig. 4a; average AUC improved from 0.75 to 0.77). This also demonstrated that genetic factors capture additional information beyond family history of dementia and that the ADRD PRS adds modest but incremental predictive value beyond APOE4. Adding metabolites predictive of dementia risk to the model further improved the time-specific model performance, indicating that metabolites provide additional predictive value beyond the MedDiet and other major dementia risk factors (average AUC = 0.78; Supplementary Table 22). As expected, these baseline characteristics were better at predicting short-term dementia risk, that is, 15-year risk, compared to long-term risk, which may be attributed to the inherent within-individual variability of metabolomic measurements over longer follow-up periods, potentially introducing random measurement error. Similar patterns were observed for Harrell’s C-index (Extended Data Fig. 9). The performance of different models in APOE4 subgroups did not substantially deviate, likely due to the limited sample size and number of cases within these subgroups, which may have introduced substantial instability. Future studies with larger sample sizes are warranted to more reliably evaluate prediction performance within APOE4 subgroups.
Fig. 4: Integrating genetic variation with plasma metabolites and MedDiet enhances the prediction of dementia risk and cognitive status.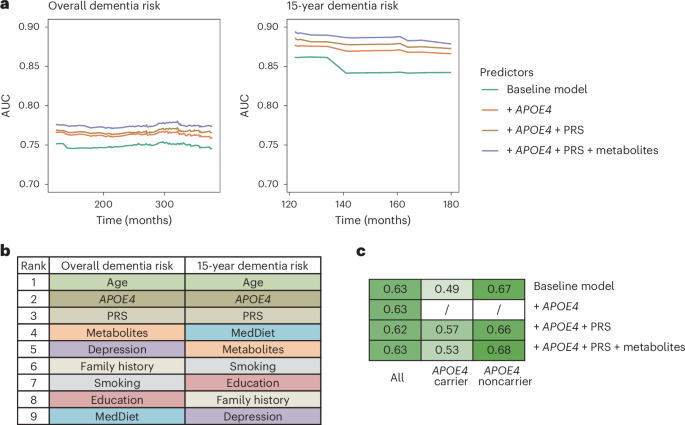
a, The inclusion of genetic factors improving dementia risk prediction using Cox PH model, with an additional modest enhancement when plasma metabolites also included. Time-dependent ROC curve analyses were conducted for dementia risk over both the entire follow-up period and the first 15 years of follow-up. The baseline model predictors included age, family history of dementia, education level, smoking status, history of depression or regular antidepressant use and MedDiet index. The PRS of ADRD excluded variants in the APOE region (see Methods for selection of metabolite predictors). b, Plasma metabolites among the top contributors for predicting dementia risk as quantified by the SHAP value. Feature contributions were evaluated for Cox PH model to predict overall and 15-year dementia risk, including the full list of predictors. SHAP values were calculated for each category of predictors by summing the SHAP value of all predictors in that category. Features were ranked by the SHAP value from the highest to the lowest for predicting the overall and 15-year dementia risk. c, Integration of genetic and metabolomic data enhancing cognitive status prediction within APOE4 subgroups. The heatmap displays AUCs from an RF model classifying participants in the highest versus the lowest tertile of the overall TICS score. In subgroup analyses by APOE4 carrier status, APOE4 genotype was excluded as a predictor. For all analyses, the NHS dataset (n = 4,215) was randomly divided into training (60%) and test (40%) sets; models were fitted on the training set and evaluated on the test set. All results shown are from the test set.
We employed the SHapley Additive exPlanation (SHAP) values to quantify the contributions of individual predictors to dementia risk predictions. As anticipated, age, APOE4 and ADRD PRS were among the top contributors (Fig. 4b and Supplementary Table 23). Plasma metabolites meaningfully contributed to the prediction throughout the entire follow-up period, with their overall contribution ranking just below age and genetic factors. In contrast, for short-term risk prediction, MedDiet emerged as a major predictor. The relatively modest contribution of MedDiet to overall follow-up predictions likely reflects the use of baseline dietary data only, which does not account for changes in dietary behavior over time. We observed similar patterns in the HPFS (Extended Data Fig. 10a,b) and when predicting a dichotomized TICS score (highest versus lowest tertile) within APOE4 subgroups, whereas no improvement was observed in the full dataset (Fig. 4c and Supplementary Fig. 8). The unstable results for cognitive score prediction likely reflect limited sample size in the subset. Larger studies are needed to further assess the predictive utility of these models for cognitive function.
Putative causal relationships between metabolomic features and cognitive outcomes
Last, genetics can offer mechanistic insights by using variants as instrumental variables to test whether associations between metabolites and cognitive outcomes are causal using the MR approach. To maximize the statistical power and mitigate biases, we implemented a two-sample MR design leveraging data from published GWASs and selected genetic instruments for 657 metabolites and 133 ratios of metabolite pairs sharing an enzyme or transporter (reflecting metabolic flux; Supplementary Tables 24 and 25)11. Cognitive outcomes included overall dementia, AD, vascular dementia and cognitive function (Fig. 5a and Methods).
Fig. 5: Genetics enables the inference of putative causal relationships between plasma metabolites and cognitive outcomes.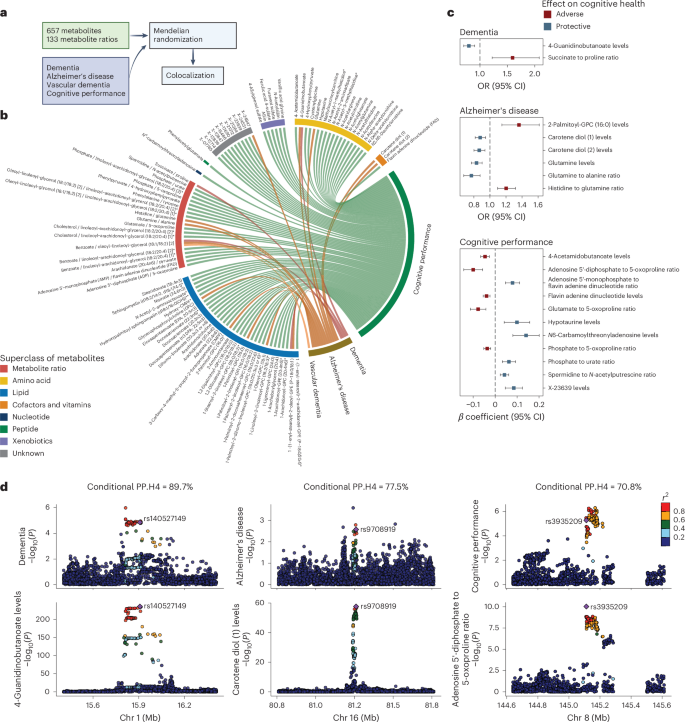
a, Schematic of the two-sample MR and colocalization analyses. Genetic instruments were selected for 657 metabolites and 133 metabolite ratios from a published GWAS. Summary statistics for overall dementia, AD, vascular dementia and cognitive performance were also obtained from published GWASs (Methods). Two-sample MR was performed to identify putative causal relationships between metabolites or ratios and cognitive outcomes, followed by colocalization analysis for the causal associations with an FDR b, Identification of numerous putative causal interrelationships of various metabolites, metabolite ratios and cognitive outcome using genetic instruments. The chord diagram displays causal relationships with an FDR c, Colocalization analyses strengthening evidence of causality, suggesting that the identified putative causal relationships between metabolites or ratios and cognitive outcomes have potential shared causal variants and biology. Putative causal relationships, represented by the odds ratios (ORs) or β coefficients with 95% CIs, are shown for associations with FDR Methods). If multiple instruments were used, a causal association was reported if the metabolite or ratio and cognitive outcomes colocalized at least one genetic locus. Colocalization signals were reported for a locus if the conditional probability of colocalization, PP.H4/(PP.H3 + PP.H4), was >70%, where PP.H3 is posterior probability that the two traits have independent causal variants and PP.H4 is the posterior probability that the two traits share a single causal variant. d, Regional genetic association plots providing evidence of potential shared causal variants affecting both metabolites or ratios and cognitive outcomes at specific genetic loci. The plots display genetic association results for metabolites or ratios and cognitive outcomes at three colocalized loci with PP.H4/(PP.H3 + PP.H4) > 70%. Each plot is annotated with the genetic instrument and dots are color coded according to their linkage disequilibrium with the instrumental variant. The −log10(P) values for both metabolites or ratios and cognitive outcomes were obtained from the original GWASs. The sample sizes for the original GWASs are as follows: metabolites or ratios (n = 8,299), cognitive performance (n = 257,841), dementia (5,933 cases and 166,584 controls), AD (90,338 cases and 1,036,225 controls) and vascular dementia (881 cases and 211,508 controls) (Methods). All statistical tests were two sided. Panel a created using BioRender.com.
We identified 99 significant causal relationships involving 95 metabolites or ratios across all 4 outcomes at an FDR 5b and Supplementary Table 26). A colocalization analysis was further performed to prioritize metabolite–outcome pairs with potential shared genetic basis and biology; we identified 19 pairs with a conditional posterior probability of colocalization >70% under a single causal variant assumption (Fig. 5c and Supplementary Table 27).
A notable finding was the protective causal effect of 4-guanidinobutanoate (4-GBA) on dementia, supported by colocalization signals (Fig. 5d); 4-GBA is a gamma-aminobutyric acid (GABA)-related metabolite involved in inhibitory neurotransmission42 and may counteract excitotoxicity, a known contributor to dementia pathogenesis43. The genetic instrument, rs140527149, is mapped to AGMAT, which encodes agmatinase, an enzyme involved in the degradation of agmatine in the brain44. Evidence suggests that agmatine may have therapeutic potential for AD by modulating Aβ production, aggregation and clearance45. Our findings highlight potential shared pathways involving 4-GBA, GABA and agmatine in dementia pathology. Carotene diol (1) and (2), naturally occurring carotenoids with potent antioxidant properties46, showed protective effects against AD, consistent with randomized controlled trial evidence causally linking carotenoid intake to reduced cognitive decline47. Building on studies showing altered glutamine levels in the brain and cerebrospinal fluid of individuals with AD48, our findings also highlighted glutamine’s potentially neuroprotective role in AD (Supplementary Fig. 9). For cognitive function, N6-carbamoylthreonyladenosine exhibited a strong beneficial effect, with colocalization signals allowing for multiple causal variants (Methods and Supplementary Table 28). A number of causal relationships were identified between metabolites involved in ATP metabolism, suggesting a causal role for the interplay between disrupted energy metabolism and oxidative stress in the pathophysiology of cognitive decline (Supplementary Text). Future investigations into these pathways could inform targeted therapeutic strategies.