Ethics
The study (GPPAD dried blood spot omics to predict health and autoimmunity outcomes in children) was approved by the ethical committee of the Technical University Munich (Nr. 517/21 S). Consent to donate samples to the GPPAD-biobank was obtained for 770 children, for whom dried blood spots (DBS) samples for DNA extraction, protein measurements, as well as clinical follow-up data were available. The informed consent was obtained in accordance with country-specific guidelines and ethical review board requirements, providing written and verbal information explaining the objectives of the GPPAD study. The work has been carried out in accordance to the criteria set by the Declaration of Helsinki.
GPPAD Cohort and study samples
Detailed descriptions of the GPPAD cohort recruitment and selection criteria have been described in previous publications6,33. Briefly, GPPAD consists of a clinical network of seven clinical trial centres from five countries: Germany, UK, Poland, Belgium, and Sweden. Children with elevated risks for T1D, detected by HLA typing, SNP-based genetic risk score, and first-degree family history of T1D, were screened and recruited from these centres. 1050 children were enrolled in the POInT trial (a randomized double-blind placebo-controlled prevention trial for T1D)7.
Genotype analysis and QC
Genotypes of individuals were measured with Illumina Infinium Global Screening Array-24 (GSA) chips. The calling was done using GenCall by Illumina, and the genotypes were mapped to GRCh37/hg19 using online tools from [http://www.well.ox.ac.uk/~wrayner/strand/index.html]. Sample QC and variant QC were carried out. In the first pre-filtering step, samples and variants with a call rate 34. In the sample QC stage, samples were filtered based on call rates (excluded if 1% and MAF 3 standard deviations), dubious sex status (samples excluded if there were discrepancies between annotated sex vs. genotypic sex, or if chromosome X heterozygosity between 0.2 and 0.8), identity by descent (IBD) (samples excluded if PI_HAT > 0.9). To determine ethnicity outliers, the sample genotypes were overlapped with genotypes from the 1000 Genomes Project ([http://internationalgenome.org])35. Only SNPs that were found in both datasets were used. Multidimensional scaling was performed using plink. Ethnicity outliers were excluded based on visual examination of the first 2 dimensions. For variant QC, exclusion criteria include SNP call rates p-value (pHWE) −4. Prior to imputation, variants with strand, position and allele frequency differences were compared to the HRC panel using the script from [http://www.well.ox.ac.uk/~wrayner/tools/]; v4.2.7. Imputation was performed using Sanger Imputation Service ([https://www.sanger.ac.uk/tool/sanger-imputation-service/]).
Eagle2 v2.4 was used to phase the genotypes36. PBWT was used for imputation, with the Haplotype Reference Consortium as reference panel37,38. Post-imputation checks were performed using ic v1.10.0 ([http://www.well.ox.ac.uk/~wrayner/tools/Post-Imputation.html]). Variants with MAF −4, and INFO score
Sample extraction from dried-blood-spots (DBS)
Blood samples were withdrawn from infant heel-prick or umbilical cordon and collected on Ahlstrom Munksjö TFN filter papers. From each blood spot (DBS), two 3 mm ø punches are generated by using the PerkinElmer DBS Puncher equipped with the Software Wallac DBS Puncher and a Punch Head 3.2 mm. The punches were collected in a separate wells of a low-binding 96-well plate (96-well PCR plate full skirt), and subsequently transferred into a low-binding Eppendorf tube for extraction. Each punch was extracted with 25 µl of extraction buffer (1X PBS + 0.05% TWEEN20 + protease inhibitor cocktail tablets from Roche) for 1 h at room temperature. Eluates were stored at −80 °C until usage. Samples were fully randomized in the plates according to gender, study center and storage temperature (−80 °C, −20 °C, RT). The samples were measured using the Olink Explore 3072 panel (Cardiometabolic I and II, Inflammation I and II, Oncology I and II, and Neurology I and II).
Olink QC
The Olink technology utilises a Proximity Extension Assay in which a pair of protein-targeting antibodies are tagged with unique complementary oligonucleotide probes. Once bound to the target protein, the probes can hybridize to allow DNA amplification. The amplified signal is finally read using next-generation sequencing.
The samples of 770 children from the GPPAD POINT trial were processed by the Helmholtz Munich proteomics core facility. Reports were generated with data for 2941 proteins from the Olink Explore assay which comprises eight panels targeting inflammation (Inflammation I and II), oncology (Oncology I and II), cardiometabolic (Cardiometabolic I and II) and neurological (Neurology I and II) proteins. Average intra-assay variation was 8%, and average inter-assay variation (between-run) was 20%. The NPX values, which is a log2 arbitrary scale unit, were intensity normalized by Olink39. For the QC, proteins labelled as a hook protein (a protein whose normalized value has a non-linear relationship with protein quantity in the assay; n = 286) or a bimodal protein (a protein with bimodal rather than normal distribution; n = 3) were removed. Olink internal quality control was used to further remove poor quality samples and proteins by using the Sample_QC and Assay_QC status. Samples with +/− 0.3 NPX receive a sample warning status. The median value of the negative control triplicates is also required to be within 5 standard deviations of a predefined value set for each assay or it would receive an assay warning status. Samples with >10% of warning statuses across assays (by either Sample_QC or Assay_QC) were removed (n = 44). Proteins with >5% of samples with the warning status were also removed (n = 668). Samples with annotated sex that did not match its genotype sex were removed. Samples without corresponding genotypes were removed. The final protein dataset used for data analysis contained 1985 proteins and 695 samples (N. females = 346).
Power curves
The R package PowerEQTL v0.3.4 was used to generate power curves as a function of minor allele frequency (MAF; Supplementary Fig. 5). For the calculation, the sample size was set to 695 and the significance threshold to 5 × 10⁻⁸. Since the protein levels were inverse normal transformed, the outcome standard deviation was set to 1. PowerEQTL was also used to estimate the minimum detectable beta for which we had a power of 50% and 80% as a function of MAF. The so calculated curves were then overlayed to the true data which closely followed the power lines. A data point that, for a given MAF, show an absolute beta estimate much smaller than the estimated minimum detectable beta from the power curves would be an indication of likely false positive.
pQTL
The single-point-analysis-pipeline version 0.0.2 (dev branch) [https://github.com/hmgu-itg/single-point-analysis-pipeline/tree/dev] was used to perform protein quantitative trait locus association (pQTL) analysis between genotypes and circulating protein levels. Covariates including sex, birth year, plate, mean protein expression per sample, and the top 10 genotype PCs were regressed out with R’s lm function. The residuals were then z-score transformed and used as traits to test for associations with genotypes.
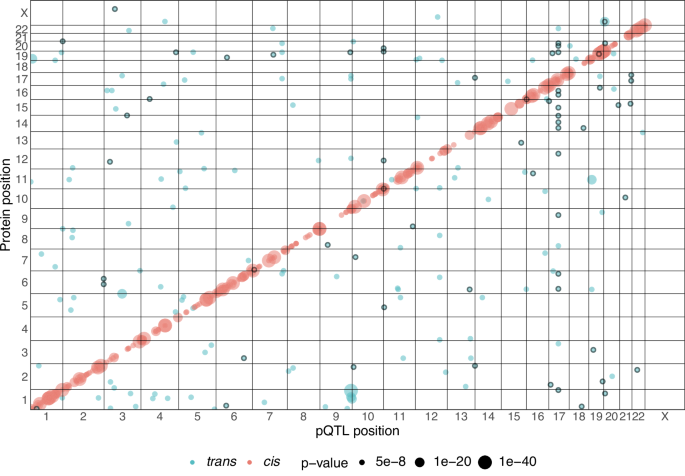
GCTA version 1.93.2 beta was used to perform mixed linear model association (MLMA)40. The GRM function in GCTA was used to estimate genetic relationships between individuals. Plink 1.9 was used to clump the output of GCTA results. GCTA-COJO, an approximate conditional and joint stepwise model selection analysis was then used to calculate independent SNV at each associated locus for each protein. cis-pQTLs were defined as variants that lie within 1 Mb upstream or downstream of transcription start site according to the canonical gene’s transcription start site using Biomart v.2.50.3 Ensembl hg19 annotation41. trans-pQTLs were defined as all variants lying outside of the cis-pQTL regions. A genome-wide threshold of 5 × 10⁻⁸ was used to define the threshold for the pQTLs42.
Assessment of newborn pQTLs in adult cohorts
To assess if the identified newborn-pQTLs have been previously reported in adults, we built a database of previously reported signals at genome-wide significance (5 × 10⁻⁸) from 46 genome-wide pQTL studies (Supplementary Data 2) as previously described42. Briefly, we collected and pooled the summary statistics of 46 studies that measured the levels of circulating proteins also present in our panel. For each of the study, we collected information such as author, PMID, size of discovery cohort, peak coordinates, UniProt ID, alleles, allele frequencies, effect sizes and direction, mapped gene, p-value, and cis/trans status. Missing information was manually curated. When required, the genomic coordinates of both the SNP and the protein-encoding gene’s transcription start site were lifted over using the liftOver function from the R package rtracklayer. The database for further updated to include a recent study which looked at 2936 unique proteins3, and the latest UKBB pQTL data based on Olink Explore 3072 panel4, the same panel used in the current study. First, we determined if the pQTL proteins were previously studied by matching either their protein or gene names. We then looked for the overlap of the lead pQTL SNP in the database with a +/− 1 Mb window around the pQTL signals reported in the current study. A pQTL was declared novel if no genome-wide significant pQTL overlapped the window for a matched protein.
ClusterProfiler43 v4.12.0 was used to test for enrichment of the pQTL-targeted proteins in the KEGG pathways. The 1985 proteins used in the pQTL analysis were used as background. A Benjamini–Hochberg corrected p-value
Comparison to adult proteogenomic data
Affinity-based assay measurements could be affected by protein-structure-altering variants which would result in a false cis-pQTL signal. To determine whether the identified pQTL-targeted proteins are similarly detected across technologies, we retrieved the Olink-SomaScan protein level correlation coefficients from the Eldjarn, Ferkingstad and Lund et al. supplementary materials4, which calculated the correlation of protein measurements between the two technologies using matching samples. For the 4, novel, cis-pQTL signals, we queried GTEx44 and eQTLGen45 to determine if the pQTL SNPs have been previously detected as eQTL for the gene encoding the pQTL-targeted proteins with the same direction of effect following reference allele matching.
We also downloaded the full UKBB pQTL summary statistics, made available by Sun, Chiou, Traylor et al.5, through Synapse (project ID syn51364943 [https://www.synapse.org/Synapse:syn51364943/wiki/622119]) using the synapser R package. For each OlinkID-SNP pair, the chromosome, position, effect size, effect allele, minor allele frequency and p-value information were extracted. Pearson correlation was used to calculate the correlation coefficients between betas and MAFs in the UKBB and newborn datasets. The full UKBB pQTL summary statistics were examined to determine whether previously unreported pQTLs showed evidence of association in the UKBB while not reaching their study significance threshold.
To assess if the novel associations could be identified in adult individuals with T1D, we accessed genotype (version 3) and Olink (release 9) data for 61 UKBB study participants with self-reported type 1 diabetes. For the Olink dataset, only time point 0 was used. For the matching OlinkID-SNP pair, we used linear regression in R to calculate the genotype association with inverse normal transformed NPX values. Sex, age, mean NPX and time between sample collection (field 3166) and data generation were used as covariates.
Colocalization
To see if the circulating blood protein levels in newborn blood and T1D have shared causal variants, colocalization was performed between protein QTL summary statistics and T1D GWAS results. Summary statistics from the most recent T1D GWAS were downloaded from the NHGRI-EBI GWAS catalogue (accession number GCST90014023)11. Regions ± 1MB of 136 independent T1D GWAS signals were used to check for overlap with 535 pQTLs of this study. The Coloc.fast function from [https://github.com/tobyjohnson/gtx/blob/526120435bb3e29c39fc71604eee03a371ec3753/R/coloc.R] was used for the analysis. The colocalization of the signal in the locus was defined as a posterior probability of sharing the same causal variant at (PP4) > 80%. A PP4 > 60% was also considered as probable for colocalization. As 2 reported T1D risk variants were in the ± 1 MB region of the start site of APOBR, we conditioned each T1D signal (in the +/− 1 Mb window) against the other using GCTA-COJO. The summary statistics from the conditional analysis were then used for colocalization.
Mendelian randomization
The R package TwoSampleMR v.0.5.646 was used to perform Mendelian randomization as a complementary step for the proteins whose pQTL signals colocalized with T1D GWAS signals. Since only the lead pQTL for each cis or trans signal for each of the proteins was used as instrument, the Wald ratio test was performed. For the outcome data, the utilised T1D GWAS study (accession number GCST90014023) is the result of inverse-variance weighted meta-analysis of 9 European cohorts. The meta-analysis has a combined sample size of 18,942 patients with T1D and 501,638 controls. The reported summary statistics are in the log-odds scale and represent the unit increase/decrease risk of having T1D. The lead pQTL variants from the COJO conditional analysis (p-value −8) were used as instrumental variables (Table 1). Betas and standard errors were available for all the instrumental variables from the T1D summary statistics (Supplementary Data 7). The F-statistic, defined as beta2/se2, was used to determine the strength of the association between IVs and the exposure. All the tested IVs had an F-statistic >15 (Supplementary Data 7). The effect size of the Wald ratio test represents the T1D risk per one standard deviation of the genetically predicted protein levels. P-values were adjusted for multiple testing correction using the Bonferroni method and a corrected p-value 8.
Reporting summary
Further information on research design is available in the Nature Portfolio Reporting Summary linked to this article.