Large TBG drumhead resonators
The TBG drumhead nanomechanical resonators are prepared by a ‘tear-and-stack’ method using both wet and dry transfer techniques (see Methods). Supplementary Table S1 presents our devices based on their size, their twist angle, and the transfer technique we have used. Figure 1a displays the TBG drums, suspended over cylindrical cavities, that we have investigated. They are labelled as drum 1 (diameter D = 6 μm), drum 2 (D = 8 μm) and drum 3 (D = 12 μm) in Device A. A moderate twist angle θ ~ 12° was set during the fabrication and extracted from micro-Raman spectroscopy measurements (see Methods). To drive the flexural vibrations of the drums, a time-dependent gate voltage is applied to the Ti/Au leads as shown in Fig. 1b. The DC component of the resulting force allows us to control the static deflection ξ and the deflection-induced in-plane stress and strain, while the AC voltage provides a harmonic driving force that actuates the TBG drums. A single laser beam is used to interferometrically measure the mechanical responses of the TBG drums and to simultaneously record the micro-Raman scattering responses of the membrane35. All measurements are performed at room temperature under high vacuum (see Methods).
Fig. 1: Characterisations of TBG drum and butterfly-shaped hysteresis loop.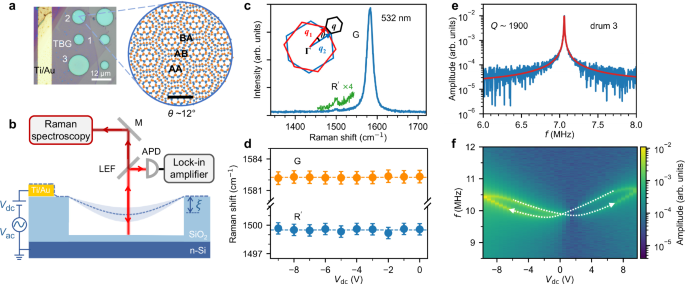
a Optical image of Device A with three TBG drums (1, 2, 3) contacted by a Ti/Au lead. The right panel shows the schematics of the moiré pattern formed by a twist angle of θ ~ 12°, where alternating AA, AB and, BA stacked regions appear (scale bar: 1 nm). b Sketch of our experiment combining electrostatic actuation, optical displacement readout, and micro-Raman spectroscopy. The TBG (with its static displacement ξ) is represented by the dark blue dashed line; its flexural motion is sketched in light blue. M, LEF, and APD represent a mirror, a long-pass edge filter, and an avalanche photodiode, respectively. c Raman spectrum of TBG measured at the centre of drum 2 (D = 8 μm) by excitation at 532 nm plus the extended spectral region for the \({{{{\rm{R}}}}}^{{\prime} }\) mode. Inset: a mini-Brillouin zone with a twist angle dependent lattice vector q(θ). d The frequencies of the G and the \({{{{\rm{R}}}}}^{{\prime} }\) modes extracted from Raman spectra measured with Vdc varying from − 9 V to 0 V. The straight dashed line is a guide for the eye. Error bars are extracted from the fits to the Raman spectra. e The resonant mechanical response measured in drum 3 (D = 12 μm) at Vdc = − 10 V shows a large Q of ~ 1900 at room temperature. f Mechanical frequency responses measured with Vdc undergoing the forward-then-backward sweep sequence (indicated by arrows), forming a butterfly-shaped hysteresis loop.
We first estimate θ from the moiré superlattice-activated Raman mode. Figure 1c shows the Raman spectrum of the suspended TBG measured at the centre of drum 2 with a 532 nm excitation (see Methods), which shows two main features: the strong G mode and the weak \({{{{\rm{R}}}}}^{{\prime} }\) mode, arising from the zone-centred (i.e., zero momentum) phonons and the moiré superlattice-activated phonons with momentum \(q(\theta )=\frac{8\pi }{\sqrt{3}a}\sin (\frac{\theta }{2})\) (as shown in the inset to Fig. 1c), respectively. The value of θ is extracted from the frequency of the \({{{{\rm{R}}}}}^{{\prime} }\) mode, which is close to the target value specified in the fabrications. Figure 1d shows the positions of the \({{{{\rm{R}}}}}^{{\prime} }\) mode and of the G mode as the gate voltage Vdc decreases from 0 V to − 9 V. Surprisingly, both modes are less sensitive to Vdc, within our experimental accuracy, than the G mode in monolayer graphene (MLG)35. Meanwhile, the intensity of the G mode remains almost unchanged for Vdc down to − 5 V before decreasing by ~ 10% at Vdc = − 9 V (see Fig. S1c and Methods). These observations indicate that the Vdc-induced tensile strain is negligible compared to the initial built-in strain (ϵ0), which means that our TBG drums are under high tensile stress.
Large Q at room temperature
Figure 1e shows the mechanical response of drum 3 (D = 12 μm) at Vdc = − 10 V. The resonant frequency fr and corresponding Q are extracted by fitting a linear harmonic resonator model to the measured response (see Methods). The largest Q we measure reaches ~ 1900 at room temperature, more than one order of magnitude higher than Q in graphene resonators at room temperature9. Note that such large Q appears at the gate voltage far from the near-zero DC bias, in contrast to graphene resonators35. We observe that resonances with unusually large Q exhibit a butterfly-shaped hysteresis loop as the gate voltage is cycled.
Butterfly-shaped hysteresis loop
To measure the hysteretic nanomechanical responses, we increase and decrease the gate voltage in cycles. Figure 1f shows the amplitude response as a function of drive frequency and Vdc under a forward-then-backward sweep between Vdc = ± 9.5 V, forming a butterfly-shaped hysteresis loop that crosses at Vdc = 0 V (white-dashed arrows in Fig. 1f). Within the butterfly-shaped hysteresis loop, fr increases by only ~ 5%, which is far less than the typical value of ~ 50% in the low-tensioned MLG drum35. Note that all of the mechanical data in this study are from drum 2 in Device A unless otherwise stated. The butterfly-shaped hysteresis loop also shrinks as the sweep range decreases (Fig. S5a). We find that such viscoelastic responses can be controllably obtained by specifying θ close to 15° in our TBG drums, whereas the TBG with θ = 0° does not show a butterfly-shaped hysteresis loop. Supplementary Section S3 provides the statistics on the hysteresis loops of our TBG drums with increasing θ. It suggests that the viscoelasticity in TBG drums is angle-dependent, as we discuss below.
Viscoelastic behaviours
To study the dependence of the shape of the frequency loop on the step rate dVdc/dt, in Fig. 2a we show the hysteresis loops measured at three different values of dVdc/dt. They have been recorded in a backward-then-forward sequence with a step size of 0.25 V. Remarkably, the maximal fr reached by the loop is revealed with the slow step rate. Furthermore, the width of the hysteresis loop, ΔVdc, defined by the largest Vdc shift between the forward and backward traces, shows a non-linear monotonic increase with increasing dVdc/dt, as shown by the experimental data in Fig. 2d.
Fig. 2: Rate and time dependent hysteresis loops and gate tuning of the quality factors Q.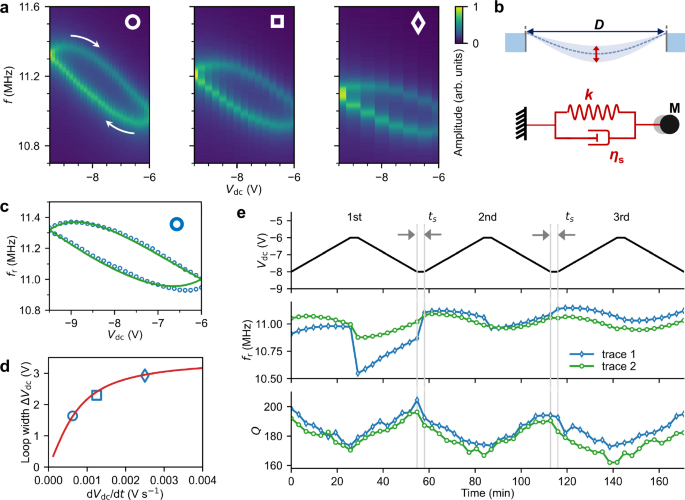
a Resonant frequency loops at different step rates, dVdc/dt. ○, □, ♢ correspond to a slow, medium, and fast step rate, respectively. The arrows indicate the direction of the sweep. b Schematic of the flexural drum vibration (top panel) and the reduced viscoelastic model (bottom panel). The membrane flexural motion is modelled by a mass (M) connected to a spring (k) and a dashpot (ηs) in parallel (Kelvin-Voigt model) to include the effects of viscoelasticity. D is the diameter of the drum. c Experimental and fitted (ϵ0 = 2.67 × 10⁻⁴ and ηs = 10.5 × 10¹⁵ Pa s) resonant frequency loop under the slow stepping rate (○). d Experimental and calculated ΔVdc as a function of dVdc/dt. e Evolution of fr and Q upon repeating the forward-then-backward step sweep of Vdc in three consecutive rounds (1st, 2nd, 3rd) for two traces (trace 1 and trace 2) corresponding to different initialisations. ts is the time interval (only denoted between two different rounds) when the step direction is reversed.
Below we consider various mechanisms that may explain our observations. We rule out contamination as the origin of the viscoelastic behaviour by reproducing the hysteresis loop on optimally clean TBG drums fabricated by the all-dry transfer method (see Supplementary section S1.4 for surface characterization by atomic force microscopy). Euler instabilities36 and mechanically conservative nonlinearities36, which would also give rise to hysteresis frequency loops, can be safely ruled out. Nonlinearities can be disregarded because the shape of our frequency loops does not depend on the strength of the driving force (Fig. S9). Sliding motion at the clamping points can also be excluded because such a sliding produces a plateau for fr near the switching points37.
Alternatively, a process that may account for our observations is a viscoelastic one. We model the TBG drums as a spring and a dashpot connected in parallel (Fig. 2b), known as the Kelvin-Voigt model (KVM), to include the effects of viscoelasticity1. The constitutive relation is expressed as a first-order linear differential equation, \(\sigma=E(\epsilon+{\tau }_{\sigma }\frac{{{{\rm{d}}}}\epsilon }{{{{\rm{d}}}}t}\, )\), where σ is stress, ϵ is strain, E is Young’s modulus, τσ = η/E is the relaxation time, with η the viscosity of the material. Based on this constitutive equation, the resonant frequency of TBG drums is expressed as (see Methods):
$${f}_{{{{\rm{r}}}}}=\frac{1}{2\pi }\sqrt{\frac{E}{4{m}_{{{{\rm{eff}}}}}{D}^{2}}({k}_{0}+{k}_{{{{\rm{s}}}}})}$$
(1)
with the normal term \({k}_{0}=2{\epsilon }_{0}+\frac{3}{2}{z}^{2}\), the viscoelastic term \({k}_{{{{\rm{s}}}}}=\frac{3}{2}{\tau }_{\sigma {{{\rm{s}}}}}z\frac{{{{\rm{d}}}}z}{{{{\rm{d}}}}t}\), where z = ξ/D is the dimensionless deflection at the centre of the drum, ϵ0 is the built-in strain, τσs = ηs/E with ηs the viscosity of the dashpot, and meff is the effective mass of the vibrational mode. The dynamical equation of motion for z can be constructed from the force equilibrium relation (see Methods). The parameters obtained by numerically solving the dynamical equation are plugged into Eq. (1) to calculate fr. Using these experimental parameters, the KVM reproduces the shape of the frequency loops well, as shown in Fig. 2c for a slow step rate (see Supplementary section S2.2 for the fits to butterfly-shaped loops and the stepping-dependent butterfly-shaped loops). The model also reproduces the relationship between ΔVdc and dVdc/dt (Fig. 2d). The implications of the non-linear relationship revealed in Fig. 2d are twofold: first, ΔVdc will decrease to zero for an extremely slow rate, namely without any hysteresis loop; second, ΔVdc will saturate for a fast rate, corresponding to the case where the dynamic system can not follow the external stimuli. Therefore, the time dependence of fr is slow on the scale of the ring-down time and on the scale of the vibrational period.
To gain an intuitive understanding of the behaviour of TBG drums as the gate voltage is cycled, we estimate the damping force, \({F}_{{{{\rm{d}}}}}=S\cdot {\eta }_{{{{\rm{s}}}}}\frac{{{{\rm{d}}}}\epsilon }{{{{\rm{d}}}}t}\approx 1.859\times 1{0}^{-4}\) N, with S the surface area of the drum and viscous energy losses \({E}_{{{{\rm{v}}}}}=S\cdot \oint {\eta }_{{{{\rm{s}}}}}\frac{{{{\rm{d}}}}\epsilon }{{{{\rm{d}}}}t}\,{{{\rm{d}}}}\epsilon \approx 1.41\times 1{0}^{-13}\) J, based on the frequency loop in Fig. 2c which we fit with two parameters, namely ϵ0 = 2.67 × 10⁻⁴ and ηs = 10.5 × 10¹⁵ Pa s, yielding τσs ≈ 104 s. Our damping force corresponds to a shear stress γ = Fd/S ≈ 3.7 MPa, which is larger than in bilayer graphene38, but comparable to that in twisted MoS239. The proportions of k0 and ks corresponding to Fig. 1e and Fig. 2c are provided in Fig. S6b and Fig. S7c, respectively. We find that the increase in fr within the frequency loop can be fully accounted for by the viscoelastic spring constant ks. For drum 4 in Device B where Vdc is cycled between − 5 V and − 1 V, we obtain ϵ0 = 3.82 × 10⁻⁴, ηs = 8.9 × 10¹⁵ Pa s, τσs ≈ 104 s, Fd ≈ 2.867 × 10⁻⁴ N, Ev = 6.1 × 10⁻¹⁴ J, and γ ≈ 2.5 MPa.
We further test the dynamic nature of the system by repeating the backward-then-forward sweeps in three consecutive rounds, as shown in Fig. 2e. Two traces are recorded, corresponding to different initial fr. A slow convergence to a steady state, where a perfect loop, i.e., with no gaps or crossings at the switching points, is observed in the third round. Trace 2 shows a much smoother path as its initial fr closed to the steady state.
Furthermore, within a resonant frequency loop, we find that Q follows fr, both increasing and decreasing concomitantly. The tunability of Q shows an approximately linear increase as decreasing gate voltage (Fig. 2e). Such enhancements of Q are expected to depend on the gate voltage stepping rate (see Fig. S11a) via ks as discussed above. These observations are in stark contrast to the conventional phenomena for 2-D nanoelectromechanical resonators, where the Q decreases rapidly with increasing electrostatic pressure, which is still a subject of debate35.
Viscoelastic dissipation dilution
To explore the mechanism of energy dissipation related to high-frequency mechanical vibrations (tens of MHz), in Fig. 3a we show Q extracted from the frequency loop corresponding to Fig. 2c, where the linear increments with slightly different slopes are revealed for forward and backward sweeps with a step size of 0.25 V. The different increments in Q under other step rates are given in Fig. S11a. Figure 3b summarises Q as a function of Vdc for three drums in Device A. The large drum tends to have a large Q, which is consistent with many reports in the literature40. There are also a few jumps in Q, as shown in Fig. 3b for drum 3 under a large gate voltage sweep. Such an observation may suggest the existence of further stick-slip actions beyond the atomic scale41.
Fig. 3: Viscoelastic dissipation dilution.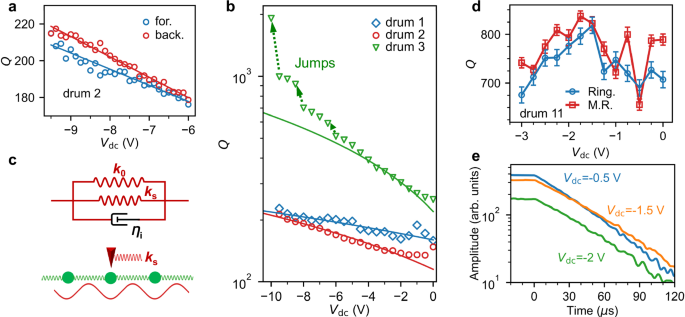
a Quality factors Q corresponding to Fig. 2c for both forward and backward sweeps. b Q extracted from the mechanical response spectra and as a function of Vdc for drum 1 (D = 6 μm), drum 2 (D = 8 μm) and drum 3 (D = 12 μm), respectively. The dashed arrows denote the Q jumps revealed in drum 3. The solid lines in (a, b) are linear fits to the experimental data (see Supplementary section S2.2). c Top panel: the extended Kelvin-Voigt model, i.e., the intrinsic friction dashpot ηi is added in parallel to the model that has been introduced in Fig. 2b, but here ηs is explicitly replaced by a “lossless” viscoelastic spring ks. Bottom panel: a cartoon of the Prandtl-Tomlison model, where the tip slides on top of a one-dimensional chain of springs, which moves on top of a fixed potential. d The Vdc-dependent Q extracted from the ring-down measurements (Ring.) and fitting of the mechanical responses (M.R.) in drum 11 (D = 12 μm) of Device E. Error bars in the traces of Ring. and M.R. are extracted from the fits of energy decay and mechanical responses, respectively. Note that the ringdown trace has been shifted up by 50 for direct comparison (see Methods). e Energy decay traces (in log scale) at different Vdc in drum 11 (D = 12 μm) of Device E (see Methods).
Firstly, we use our estimates of ηs and ϵ0 to estimate the contribution of dissipation dilution in our measurements. The phenomenon of dissipation dilution refers to the reduction in energy dissipation from the contribution of a lossless potential that stores part of the elastic energy of mechanical resonators. The lossless potential may originate from e.g., a geometrical nonlinear deformation12. Such dissipation dilution could not explain our observations, since the small elastic energy increments are fully accounted for by the viscoelastic term ks in Eq. (1). However, due to a long viscoelastic relaxation time (τσs ≈ 104 s for drum 2) compared to the vibrational period ≈ 10−5 s, such a term can play a similar role as that of a nonlinear deformation to store elastic energy and contribute a “lossless” spring constant ks within the period of the oscillator. In order to provide an intuitive picture, we propose an extended KVM (Fig. 3c, top panel), where the intrinsic dissipation is modelled by a new dashpot (ηi) in parallel to the spring (k0) and viscoelastic dashpot (ηs) that have been introduced in Fig. 2b, but here ηs has been replaced by ks. The intrinsic Q can be defined by the material loss tangent, Qint = 1/tan(ϕ), where ϕ is the phase lag between stress and strain. Q is characterised by Q = DQ × Qint, where DQ = (1 + ks/k0) is called the dilution coefficient. Based on the outputs from KVM (see Fig. S7), DQ ≈ 1.06 is found for Vdc = −9.5 V as compared to Vdc = −6 V, which is less than the experimental DQ ≈ 1.20 (forward) and DQ ≈ 1.22 (backward), as shown in Fig. 3a.
We further estimate the impacts of ks on intrinsic damping rate Γ = f/Qint, which is not included in the conventional model of dissipation dilution12. The extracted Γ corresponding to Fig. 3b is shown in Fig. S10a. Notably, three drums in Device A follow a similar slope of ~ 3 kHz V−1. Intrinsic damping arises from the atomic-scale stick-slip behaviour that gives rise to friction. It is commonly interpreted by the Prandtl-Tomlinson model, where a particle is pulled by a linear spring of stiffness kd to slide on a periodic energy landscape (Fig. 3c, bottom panel). The stick-slip action only occurs if the corrugation registration energy is large enough, i.e., 2E0π2/kdb2 > 1, where E0 and b are the amplitude and period of the energy corrugation42. Otherwise, the stick-slip behaviour would undergo the transition to continuous motion without dissipation, thus reducing Γ. The viscoelastic stiffness ks creates a lateral, time-dependent heterostrain that makes the atom slide on a lattice (Fig. 3c, bottom panel), and as such can be considered as a driving kd. The sliding resistance can be reduced or even eliminated by increasing ks by Vdc, reinforcing the effect of dissipation dilution.
Our mechanism of reinforced viscoelastic dissipation dilution is markedly different from the electrical tuning of Q in nanotubes43,44. It is also different from the electrical tuning of Q in graphene due to Ohmic dissipation, where Q decreases as ∣Vdc∣ increases45. Because our measurements do not involve charge transport through the resonator, we believe that the phenomena we observe have a purely mechanical origin. Remarkably, a transition from the purely mechanical region with enhanced Q to the usual electrostatic region with decreased Q as increasing ∣Vdc∣ is revealed for with θ ~ 4° (Fig. 3d), with θ ~ 10. 5° (Fig. S16d) and another drum of θ ~ 12° (Device G) with a small built-in strain introduced by annealing (Fig. S8i). In fact, we can separate the dissipation as 1/Q = 1/Qnormal + 1/Qviscoelastic. Thus, if the normal term competes with the viscoelastic one, either by reducing ϵ0 as in Device G or by reducing viscosity in the case of a small twist angle (Device E), the electrostatic region with decreased Q returns.
To obtain the direct information on the dissipation dynamics, we further perform the ring-down measurements (see Methods) in drum 11 of Device E. The vibrational amplitude at resonant frequency decays exponentially in time as ∝ e−t/(2τ) upon stopping the drive, with τ the decay time constant, which gives Q = 2πfrτ. The energy decay traces (in log scale) corresponding to different Vdc are shown in Fig. 3e. Q obtained from the ring-down measurements is identical to the trajectory extracted by fitting of the mechanical responses (Fig. 3d). Further controlled ring-down measurements using gate voltage pulses or tiny ramps to capture the discrete Q jumps (as shown in Fig. 3b) are needed to elucidate the underlying mechanism.