Cohort selection
The TwinsUK study contains around 16,000 participants. From a preselection of 4,800 donors, we invited 1,796 to participate based on several criteria, receiving buccal swabs from 1,236 donors (Extended Data Fig. 2a). The use of these samples was approved initially by the North West Research Ethics Committee (REC 19/NW/0187 and REC 24/NW/0106), and informed consent was provided by participants. To increase our statistical power to study associations with exposures, risk factors and germline factors, we included all available donors of age 80 or higher (n = 230), as many complete twin pairs as possible, smokers, individuals with obesity (BMI > 30), and individuals with available genome-wide genotyping information. We also favoured the selection of men and people of colour to reduce some of the demographic biases in the TwinsUK registry compared with the general population. To test for associations between the mutational landscape and medications or clinical histories, we favoured the inclusion of individuals with a history of cancer (including all donors with a history of oral cancer, n = 12) or a self-reported treatment history including tamoxifen, immunosuppressants, metformin, aspirin or ibuprofen. 194 samples were excluded from analysis based on several sequencing quality metrics, leaving a total of 1,042 samples in the study. Exclusion criteria included: removal of contaminated samples with either human (n = 17) or non-human (n = 132) DNA, exclusion of samples with mean duplex coverage lower than 50 dx (n = 79) and exclusion of swabs with genotyping information not matching the pre-existing genotyping information from TwinsUK (n = 7) (Extended Data Fig. 2a).
From the final 1,042 donors in the study, we also selected 380 individuals with archival whole-blood DNA available for sequencing in the TwinsUK BioBank. In total, 371 samples passed quality controls for study inclusion (Extended Data Fig. 2a). The selection of blood donors was based on several criteria: 12 donors (and their twins) treated with metformin, 30 donors (and their twins) with the highest mutation burden per year in the buccal swabs, 25 donors (and their twins) with the highest driver fractions, 25 donors (and their twins) with the lowest driver fractions, 25 donors with high driver fractions in the buccals for known clonal haematopoiesis drivers (TET2, SF3B1, DNMT3A) and 5 donors with high driver fractions in the buccal swabs for each of the following drivers: PPM1D, ASXL1 and NOTCH3. The remaining twin pairs were sampled randomly.
Metadata
Metadata were provided by TwinsUK, obtained through periodical questionnaires that were collected longitudinally for most donors. For each participant, TwinsUK provided age, sex, height, weight, BMI, twin zygosity and ethnicity. A few self-reported zygosities were corrected based on genotyping information. Self-reported medication histories were also obtained from questionnaires, however, these are expected to be incomplete. Further information on history of herpes labialis and a short list of prespecified treatments was provided by TwinsUK from anonymized medical records: metformin, tamoxifen, rapamycin, aspirin, non-steroidal anti-inflammatories and immunosuppressants. Cancer history was provided and coded as: 0 (no cancer), 1 (non-melanomatous skin cancer), 2 (other cancer) and 3 (oral cancer).
For major oral cancer risk factors and other relevant variables, we processed available questionnaires further to obtain summary metrics, including: tobacco smoking, alcohol consumption, physical activity, weight, height, BMI, oral hygiene, gastro-oesophageal reflux, diabetes, history of cancer and medication histories.
Smoking and alcohol consumption
Self-reported smoking and alcohol consumption was collated from 14 periodical questionnaires. We focused on the most recent questionnaires due to the relevance of the questions asked in them and the coverage of answers across individuals. For smoking, we kept the maximum value of reported pack-years per donor across questionnaires. As standard, 1 pack-year was defined as 365 packs of cigarettes (7,300 cigarettes). For alcohol intake, self-reported current weekly consumption was available for most donors, but self-reported information on lifetime consumption was only available for a few donors. An estimate of drink-years was calculated by multiplying the average current weekly alcohol consumption, across several questionnaires if available, by the duration of adult life (age minus 18). We note that this estimate is an extrapolation and should be used with caution, but regression models suggest that this estimate was more explanatory than self-reported lifetime consumption (see Supplementary Note 7 for analyses on alternative metrics).
Oral health
Self-reported information on gingivitis, periodontitis and gum bleeding was only available for a few donors. By contrast, the number of natural teeth remaining was available for most donors, recorded as an ordinal variable. For ease of interpretation in the regression models, we inverted this variable to reflect the number of missing teeth, as follows: 0, 20 or more natural teeth; 1, 10–19 natural teeth; 2, 1–9 natural teeth and 3, no natural teeth. Where several answers were available from questionnaires on different years, the lowest number of natural teeth left was used.
BMI, weight and height
Weight and height were provided by TwinsUK for most donors. Both metrics were averaged across questionnaires for each donor. BMI was calculated using the standard formula: weight/(height2).
Buccal swab processing and sequencing
Puritan buccal swab kits with instructions for self-collection were posted to the homes of voluntary donors by TwinsUK (CamBio, CA-1723-H100). Kits contained a primary and secondary plastic container, an outer rigid container (Alpha Laboratories, RF95-LL1) and a prepaid return envelope. Participants mailed their buccal swabs directly to the Wellcome Sanger Institute. Swabs were refrigerated at 4 °C on arrival.
To extract DNA, buccal cells were dissociated into 1 ml of PBS solution in an Eppendorf tube through manual agitation for 1 min. The swab tip was then cut with scissors and left in the tube for 30 min before removal. The solution was then centrifuged at 1,000g for 1 min. The supernatant was removed leaving a cell pellet with minimal residual PBS (less than 100 μl). The QIAamp DNA Micro Kit (QIAGEN, 56304) was used for cell lysis and DNA extraction. First, 180 μl of buffer ATL and 20 μl of proteinase K were added to the resuspended cell pellet, followed by overnight incubation on a thermomixer at 56 °C and 800 rpm. DNA extraction followed the manufacturer’s protocol with several modifications: centrifugation steps were all performed at 20,000g, DNA was eluted in 50 μl if buffer EB (10 mM Tris-Cl, pH 8.5) (QIAGEN, 19086), incubation with the first elution step was for 5 min, and the eluent was passed through the spin column for a repeat elution into a DNA LoBind 1.5 ml tube (Eppendorf, 0030108051). The extracted DNA was quantified using a Qubit High Sensitivity and then stored at −20 °C before 40 μl of the thawed sample being diluted to a final volume of 120 μl with buffer EB (QIAGEN, 19086) and submitted for NanoSeq library preparation on an Abgene AB0800G plate (Thermo Fisher Scientific, AB0800G).
A detailed description of the targeted NanoSeq and standard duplex sequencing library preparation protocols is provided in Supplementary Note 1.
Mutation calling
Sequencing data were mapped to the human genome (GRCh37, hs37d5 build) with BWA-mem57 as described before8. Bases were called when there was duplex consensus with at least two reads per original strand, requiring a minimum consensus base quality score of 60, a VAF lower than 0.1 in the matched normal, a minimum AS-XS of 10 (below), no more than an average of 3 mismatches per read (or 4 if a variant is called), a minimum coverage of 25× in the matched normal and trimming 8 bp from each read end. We note that by counting all mutant bases and all reference bases in each duplex molecule, NanoSeq implicitly considers the VAF of each mutation to calculate mutation burdens. This makes NanoSeq robust to differences in clonal composition across samples. Compared with ref. 8, instead of sequencing independent matched normals to filter out germline variation, we took advantage of the high coverage and polyclonality of the buccal swab samples to remove germline SNPs by filtering out variants with VAF ≥ 10%. We note that this is adequate as long as the samples are highly polyclonal. Relaxing this cut-off to VAF ≥ 30% did not seem to recover genuine mutations in the buccal swabs but led to an increase in mapping artefacts. Because all blood samples had matching buccal swab data, somatic mutations in blood were called using their buccal swabs as matched normals, excluding as probably germline any variants with VAF ≥ 10% in the buccal swabs.
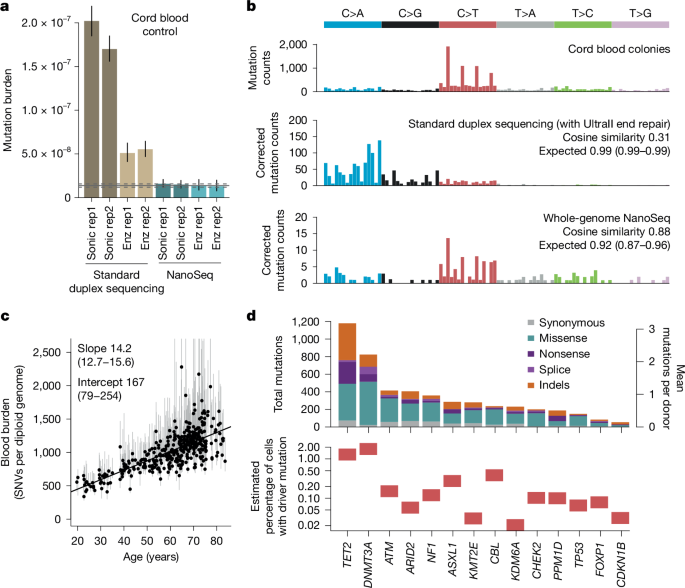
A significant modification in the targeted NanoSeq calling pipeline compared with our published RE-NanoSeq pipeline is the relaxation of the AS-XS threshold from 50 to 10. AS-XS measures the difference in mapping quality between the primary and secondary alignments, excluding regions with ambiguous mapping from analysis. For mutation burden and signature analyses with whole-genome NanoSeq, we previously recommended a strict AS-XS cut-off to minimize the impact of mapping artefacts8. However, for driver discovery it is important to preserve regions with less unique mapping qualities. Using a list of 1,152 oncogenic hotspots from TCGA and MSKCC provided by the dNdScv package22, we noticed that the original AS-XS cut-off would have filtered out a significant number of them. Reducing the AS-XS cut-off from 50 to 10 ensured the retention of duplex coverage on nearly all canonical cancer hotspots while still ensuring accurate mutation rates and signatures in control cord blood samples (Extended Data Fig. 2l–o).
Two extra filters are important to avoid recurrent mapping artefacts and to minimize the effect of inter-individual contamination. First, a ‘SNP+noise’ mask containing common germline SNP sites and recurrent mapping artefacts was generated for targeted NanoSeq as described before8. Second, we noticed that mapping errors not captured by this mask can manifest as recurrent artefacts where the mutant base is often seen at specific positions within a read. This can be caused, for example, by mismapping of reads from polymorphic segmental duplications. A Kolmogorov–Smirnov test on the position of the mutant bases within reads was applied to remove recurrent artefacts after mutation calling. Indels were also filtered out if their overlap with the ‘SNP+noise’ mask was 50% or greater, if they occurred at sites without a base called, if they had a VAF > 0.1 or if they were seen in more than 50 samples. This only removed a small number of artefactual indel sites, which also had a strong read positional bias.
Duplex VAFs and unbiased VAFs
The VAF represents the proportion of reads at a specific site carrying a variant, relative to the total reads at that site. When working with standard duplex sequencing or targeted NanoSeq data, only a fraction of read bundles reach the ‘2 + 2’ requirement for duplex calling (that is, read families with at least two reads from both strands). We can then calculate three separate VAFs: (1) the ‘duplex VAF’, defined as the fraction of callable (2 + 2) read bundles supporting a given mutation, (2) the ‘BAM VAF’, calculated using the deduplicated BAM file containing one representative read per read bundle (and including calling and non-calling read bundles) and (3) the ‘unbiased BAM VAF’, calculated using the deduplicated BAM file but excluding calling read bundles.
These VAFs can be used for different purposes. (1) Estimation of the fraction of cells in a sample carrying a specific mutation. If a mutation was discovered in a sample using duplex (2 + 2) reads, duplex VAFs or BAM VAFs tend to overestimate the fraction of cells carrying the mutation in the sample due to the discovery bias resulting from the inclusion of reads used for mutation calling. For this purpose, ‘unbiased BAM VAFs’ provide an unbiased estimate of the VAF of a mutation in the sample as they are calculated from reads not used for duplex calling. (2) Estimation of the fraction of cells carrying somatic mutations in a given gene. The molecules that reach duplex calling (2 + 2) in a targeted NanoSeq experiment represent a random sample of all copies of a gene in a population of cells. The duplex VAF for a given site represents the fraction of mutant molecules at the site. If we assume that all (or nearly all) cells are diploid and that cells carry at most one driver mutation per gene (heterozygous), then we can estimate the fraction of cells with mutations in a given gene by summing the duplex VAF (vd) of mutations across all sites in the gene (F = 2Σvd). If we assume that cells may carry up to two mutant copies of the gene per cell or if we are looking at a haploid region of the genome (for example, the X chromosome in male individuals), we can estimate the fraction of mutant cells in the sample using the sum of duplex VAFs across all sites in the gene (F = Σvd). Some genes, such as NOTCH1 in squamous epithelia can show biallelic loss by one mutation in each allele (SNVs or indels) or by one mutation and a copy number change (either a deletion or a copy-neutral loss of heterozygosity). We have previously shown that for these conditions, as well as for populations with mixtures of heterozygous and homozygous mutant cells, the fraction of mutant cells in the population falls within the range [Σvd, 2Σvd] (ref. 2). Unless described otherwise, other references to the fraction of mutant cells for a given gene assume a maximum of one driver mutation per cell and a largely diploid population.
As not all non-synonymous mutations in a driver gene are driver mutations22, to estimate the fractions of cells with driver mutations (Figs. 1d and 2e), we multiplied the estimated fraction of cells with non-synonymous mutations by the estimated fraction of mutations that are drivers for each class. We estimated the fraction of mutations that are drivers using (ω − 1)/ω, for mutation classes with ω ≥ 1 (where ω is the dN/dS ratio per mutation type per gene). To account for potential differences in clone sizes for driver mutations, we used dN/dS ratios calculated without collapsing mutations reported by many molecules into single entries to dNdScv (Supplementary Code).
Epithelial purity and targeted methylation
To quantify the epithelial fraction of a representative set of buccal swabs, we used two approaches: (1) targeted enzymatic methylation sequencing on 187 buccal swabs, and (2) comparing the VAFs of clonal haematopoiesis mutations in the buccal swabs of donors with blood and buccal swab data.
From 187 swabs, we generated low-input enzymatic methylation libraries and then undertook targeted capture with a panel of informative CpG sites, using the NEBNext Enzymatic Methyl-seq Kit (NEB, E7120L). We used a custom Twist Bioscience hybridization panel targeting 1,162 CpGs selected from the centEpiFibFatIC.m, centDHSbloodDMC.m and centEpiFibIC.m matrices in the EpiDISH R package58, to deconvolute epithelial, fibroblast, fat and blood cell types. We also targeted 353 CpG from the original Horvath clock59 and 50 CpGs in the promoters of 25 driver genes. The design is available in Supplementary Table 2.
For each sample, DNA was quantified and normalized to roughly 1 ng μl−1. Normalized DNA samples were then sheared with the NEBNext UltraShear fragmentation mix (NEB, M7634L), end-repaired, A-tailed, adapter-ligated with a methylated TruSeq-compatible adapter stub (all using NEB Ultra II reagents) and, after a SPRI (solid-phase reversible immobilization) clean-up, the resulting libraries were oxidized using TET2 (converting methylcytosines to carboxylcytosines) and deaminated using APOBEC (converting bare cytosines to uracils but retaining the carboxylcytosines, thus preserving the locations of methylation marks). The deaminated libraries were amplified, and sequencing indexes (and the rest of the adapter sequence) were introduced using NEB Q5U and the Sanger Institute’s UDI primers. After a further SPRI clean-up, libraries were requantified and mixed in an equimolar pool with a cumulative DNA mass of 1–4 μg. Twist Bioscience probes targeting the sequences of interest were then added. After evaporating all the liquid, the probes hybridized to the DNA and the targets were pulled down and cleaned up (using Twist fast hybridization reagents and Thermo DynaBeads MyOne streptavidin-coupled beads). After a final PCR amplification (KAPA HiFi) and SPRI clean-up, a pool of all samples underwent quality control by Agilent Bioanalyser and sequenced in a single S4 lane of Illumina NovaSeq 6000.
Epithelial, fibroblast and blood cell fractions were estimated using EpiDISH and hEpiDISH58. The latter allows hierarchical deconvolution, first relying on centEpiFibIC to estimate epithelial, fibroblast and blood fractions, and applying centDHSbloodDMC to deconvolute the different types of blood cell. The median epithelial fraction across all 187 swabs was 95.1% (Extended Data Fig. 2h). Most of the non-epithelial cells were neutrophils, probably a result of saliva contamination of the buccal swabs.
As a complementary analysis of blood contamination in the buccal swab samples, we compared the VAF of blood mutations in buccal swabs. To do so, we used 43 pairs of buccal and archival blood samples in which the date of collection of the blood sample was within 3 years of the buccal swab, and which contained at least 1 large clone in blood (VAF ≥ 1%). The median of the ratio of buccal VAF to blood VAF for 58 blood mutations that met these criteria was 0.076, which provides an alternative estimate of the median blood contamination in these samples around 7–8%.
Removal of DNA contamination
The ability of NanoSeq to detect somatic mutations in single molecules of DNA makes it particularly sensitive to DNA contamination, either from other humans (calling germline SNPs from the contaminant individual as somatic mutations in the affected sample) or from other species with sufficient conservation to map to the human genome (which is more likely in targeted NanoSeq due to the higher conservation of coding regions).
Human DNA contamination
We have previously shown8 that when analysing whole-genome NanoSeq data, the percentage of contaminating DNA can be estimated using verifybamID60. However, we found verifybamID to be unreliable for targeted NanoSeq data. To qualitatively detect human DNA contamination on targeted NanoSeq data, a useful metric is the fraction of all substitutions filtered by the ‘SNP+noise’ mask. Although useful, this metric may not be reliable for samples with low duplex coverage and few mutations. As a complementary approach, we genotyped common SNPs in targeted regions to identify homozygous alternative (non-reference) SNPs. Presence of reference bases at these sites is indicative of contamination. Although this is not a direct estimate of the percentage of contamination given the difficulty of determining the genotype of the contaminant at those alternative homozygous SNPs, it can serve as a sensitive indicator of inter-individual DNA contamination.
We called SNPs with bcftools61 using the following commands: bcftools mpileup –max-depth 20000 -Ou -f $genome $bam | bcftools call –ploidy GRCh37 -mv -Ob -o BCFTOOLS/$OUT_PREFIX.calls.bcf; bcftools view -i ‘%QUAL > = 100’ BCFTOOLS/$OUT_PREFIX.calls.bcf > BCFTOOLS/$OUT_PREFIX.calls.filtered.vcf.
For the assessment of contamination, we restricted the analysis to SNPs overlapping both our SNP mask and our targeted panel. We used bam2R (from the deepSNV R package)62 to obtain the number of reads supporting the alternative and reference alleles, and kept SNPs with a mean coverage across samples greater than 200×. For each SNP in each sample, the genotype was set to ‘NA’ if the coverage was less than 20×, to alternative homozygous (1/1) if the VAF was greater than 0.8, to heterozygous (0/1) if the VAF was between 0.3 and 0.7, and to reference homozygous (0/0) if the VAF was less than 0.1. Finally, we only kept SNPs seen in 2 or more samples and in fewer than 1,000 samples. For each homozygous SNP, we calculated the reference fraction and we report the median across all homozygous SNPs in the sample. We considered 17 samples with a median reference base VAF > 0.01 at non-reference homozygous SNP sites to be contaminated and excluded them from all further analyses (Extended Data Fig. 2d).
Cross-species contamination
Donors were requested to rinse their mouths before buccal swab collection to minimize non-human DNA contamination from food or bacteria. However, some samples showed evidence of non-human DNA contamination, which resulted in mismapping of non-human DNA reads to the human genome, detectable as an excess of clustered synonymous mutations. To systematically identify these samples, we used Kraken v.2 (ref. 63), using 1 million unmapped reads per swab and a database of potential sources of contamination able to map to the human genome: Mus musculus, Bos taurus, Ovis aries, Sus scrofa, Equus caballus, Oryctolagus cuniculus, Meleagris gallopavo and Gallus gallus. Bacterial contamination should not be a problem given their sequence divergence from the human genome. In addition, for each sample we calculated the global dN/dS ratio across passenger genes, and compared the contamination fractions estimated with Kraken with the observed dN/dS ratios. dN/dS ratios decrease with non-human contamination because of evolutionary conservation of non-synonymous sites. On the basis of the impact of contamination on dN/dS ratios (Extended Data Fig. 2e), we excluded from further analyses 132 samples with more than 0.25% of non-human unmapped reads.
HPV detection and characterization
The genome sequence of 19 HPV types considered high-risk64 were retrieved from GenBank. We built a multiple sequence alignment of these genomes with MAFFT65 using Jalview66. Based on conservation across these highly divergent HPV strains, we retained roughly 3,000 bp for each of the strains to design HPV-specific probes that we included in our Twist target gene panel. The GenBank accession numbers of the 19 selected HPV types were: KU298887.1, KU298893.1, KU298928.1, KX514417.1, KX514421.1, KX514431.1, KY225967.1, LR862061.1, LR862064.1, LR862079.1, MT218010.1, MT783412.1, MT783416.1, MT783417.1, MZ374448.1, MZ509108.1, NC_001357.1, NC_001526.4 and NC_001583.
Once our targeted sequencing data were mapped to the human genome we retrieved the unmapped reads and remapped them to the genomes of the 19 HPV strains using BWA-mem57. Mapping results were reviewed manually to distinguish between unreliable mappings (very repetitive, low-complexity, soft-clipped reads) and probably true HPV sequences. For ambiguous cases, we searched the mapped read with BLAST against the National Center for Biotechnology Information’s non-redundant nucleotide database. This allowed us to identify some hits to HPV strains not originally covered in our panel.
We detected HPV in 12 samples, in some cases supported by thousands of reads while in others by as little as one single read. Several HPV strains were detected. The following (anonymized) list of donors show the results: X1 donor (HPV 16, 44 reads), X2 (HPV 53, 6 reads), X3 (HPV 33 and HPV 58, 20 and 5 reads), X4 (HPV 33, 115 reads), X5 (HPV 53, 6667 reads), X6 (HPV 59, 12 reads), X6 (HPV 56, 707 reads), X7 (HPV 51, 236 reads), X8 (HPV 56, 1 read), X9 (HPV 21 not in panel, 2 reads), X10 (HPV 24 not in panel, 1 read), X11 (HPV 30, not in panel, 1 read) and X12 (HPV 33, 6 reads).
Given that only 12 out of 1,042 samples had detectable HPV presence using the targeted capture and that this is not a validated assay for HPV detection, we were unable to study the impact of HPV on the mutation and selection landscape in the oral epithelium, which remains an important question for future studies. Instead, we excluded these 12 samples from the epidemiological regression analyses to reduce the risk of confounding effects.
Germline genotypingGenotyping array data
Pre-existing array genotyping data from TwinsUK were used for GWAS and other analyses. The samples had been genotyped with the following arrays: HumanHap300, HumanHap610Q, 1M-Duo and 1.2MDuo 1M. Following genotype calling, some samples were excluded from analyses involving genotyping data based on different criteria: a sample call rate less than 98%, heterozygosity across all SNPs that were 2 or more standard deviations from the sample mean, evidence of non-European ancestry as assessed by principal components analysis comparison with HapMap3 populations, observed pairwise identity by descent probabilities suggestive of sample identity errors. We also used identity by descent probabilities to correct misclassified zygosity. We then excluded SNPs using the following criteria: Hardy–Weinberg P −6, assessed in a set of unrelated samples; minor allele frequency of 1%, assessed in a set of unrelated samples; SNP call rate less than 97% (SNPs with a minor allele frequency of 5% or more) or less than 99% (for 1% less than or equal to minor allele frequency of less than 5%). Following genotype and sample filtering, the data were imputed using the Haplotype Reference Consortium reference panel and SNPs with an imputation R2
Germline genotyping from sequencing data
For analyses relying on common SNPs, we called SNPs using bcftools as described in the DNA contamination section. For analyses relying on both common and rare SNPs we run GATK’s HaplotypeCaller (v.4.0.1.2)67, using default options, setting ploidy to 2 except for the male chromosome X (haploid) and providing dbSNP v.141 (ncbi.nlm.nih.gov/snp, ref. 68) for annotation of the calls. The resulting VCF files were intersected with our panel regions using bedtools69 and missing genotypes were annotated as REF with bcftools +missing2 (ref. 61), on the basis of the high coverage available.
Selection analyses
A detailed description of the methods used to analyse positive and negative selection in this study is provided in Supplementary Note 2. This includes a description of the new one-sided tests in dNdScv, the use of duplex coverage correction in dNdScv, estimates of the number of driver mutations in the dataset and a description of dN/dS analyses at the level of single sites and groups of functionally related sites within genes.
Mutation burdens and signatures
Mutation burden is defined as the number of mutations per base pairs in a given region, and it is calculated in NanoSeq data as the number of mutant bases divided by the total number of bases sequenced with duplex information. Estimating mutation rates from targeted data can have several challenges. First, the mutation burden of a given region of the genome will be affected by its sequence composition. We can remove this confounding effect by correcting mutation burdens by the trinucleotide frequencies of a targeted region (relative to the whole genome) and the mutability of each trinucleotide, as described before8. Whereas this corrects for the effect of different sequence composition, it does not correct for a systematic difference in the mutability of different regions, such as genic and intergenic sequences, as explained in the text. RE-NanoSeq (and the full whole-genome NanoSeq protocols introduced in this study) can be used for an unbiased genome-wide measurement of mutation burdens (for example, Extended Data Fig. 4a–f and Supplementary Note 3). Second, when estimating mutation rates from gene sequences, particularly from panels of positively selected genes, positive selection can lead to an inflation of the apparent mutation rate. To avoid this, the mutation burdens described in this paper were estimated only from passenger genes. Synonymous sites can also be used as a proxy for the neutral mutation rate, as described before2. Finally, mutation burdens estimated from targeted regions can be inflated or deflated by the undue influence of one or a few large clones. For example, if a sample is dominated by a large clone, the presence of a passenger mutation in the clone overlapping the target region would lead to an overestimation of the mutation burden, whereas the absence of any mutation in the clone in the target region would lead to a modest underestimate of the burden. This is apparent in the targeted NanoSeq data for blood (Fig. 1c), in which a few samples show inflated burden estimates due to high VAF passenger mutations. Some duplex sequencing studies avoid this by counting each mutant site only once, but this leads to a systematic underestimation of mutation burdens, leading to lower bound estimates of the mutation burden. Instead, for the targeted NanoSeq blood data, we calculated the CIs for the mutation burden using Poisson bootstrapping of the mutant sites, resulting in wider CIs when one or a few sites had an undue influence in the burden estimate. In general, burden estimates from targeted NanoSeq are expected to be most reliable when working with highly polyclonal samples or when the size of the panel is considerably larger than the inverse of the mutation rate per base pair.
We inferred mutational signatures of SBS using the sigfit (v.2.1.0) R package70. Genome strand information for each target gene was used to produce transcriptional strand-wise (TSW) trinucleotide mutation catalogues (192 mutation categories) for mutations within genes, using the build_catalogues function in sigfit. Inference was performed for a range of signature numbers (N = 2,…,5), using the TSW mutation counts from 92 oral epithelium samples having 500 or more mutations each. To account for variation in sequence composition, observed mutation opportunities (trinucleotide frequencies based on the NanoSeq coverage per site for each sample) were supplied to the extract_signatures function. Mutation opportunities were assumed to be equal between the transcribed and untranscribed strands. The best-supported number of signatures, on the basis of overall goodness-of-fit and consistency with known COSMIC signatures (v.3.0; cancer.sanger.ac.uk/signatures), was found to be N = 2. Of the two inferred signatures, signature A corresponded to a combination of COSMIC signatures SBS1 (6%) and SBS5 (94%) (cosine similarity 0.90), whereas signature B was highly similar to COSMIC SBS16 (cosine similarity 0.97). To estimate the contribution of both signatures to all oral epithelium samples, these two signatures were fitted to the TSW mutation counts for each sample using the fit_signatures function. Signature burdens (mutations per diploid genome attributed to each signature) were calculated by multiplying the signature exposure estimates by the whole-genome passenger mutation burden estimates for each sample. Before plotting using the plot_spectrum function, signatures were transformed to a genome-relative representation by scaling their probability values according to the corresponding whole-genome human trinucleotide frequencies, using the convert_signatures function.
A high rate of T>C mutations at ApT dinucleotides is common to the COSMIC SBS5 and SBS16 signatures. To explore whether these T>C mutations are caused by similar underlying processes, we studied the extended (pentanucleotide) sequence context of T>C mutations in several datasets. To do so, we obtained TSW pentanucleotide counts for T>C substitutions (256 mutation categories) applying a custom R function to mutations in the following sample sets: (1) matched blood samples (n = 371); (2) hepatocellular carcinoma (Liver HCC) samples from the Pan-Cancer Analysis of Whole Genomes study71 (downloaded from dcc.icgc.org/pcawg) for which signature fitting estimated a COSMIC SBS16 exposure greater than 0.2 (n = 4); (3) oral epithelium samples with signature B exposure greater than 0.25 (n = 121) and (4) oral epithelium samples with signature B exposure less than 0.25 (n = 921). Before plotting using custom R functions, pentanucleotide catalogues were transformed to a genome-relative representation by scaling mutation counts according to the corresponding whole-genome human pentanucleotide frequencies. The results of this analysis are described in Extended Data Fig. 8 and Supplementary Note 3.
Mutation catalogues of DBSs (78 mutation categories) and indels (83 mutation categories) were produced for mutations in the following sample sets: (1) all oral epithelium samples (n = 1,042); (2) oral epithelium samples from heavy-smoking non-drinking donors (n = 27) and (3) oral epithelium samples from non-smoking non-drinking donors (n = 224). DBS catalogues were produced using a custom R function, whereas indel catalogues were produced using the indel.spectrum function in the Indelwald tool (24 September 2021 version; github.com/MaximilianStammnitz/Indelwald). Although we attempted both de novo extraction and fitting of mutational signatures to the DBS and indel catalogues, mutation numbers were not large enough to allow inference of informative signatures or exposures. Mutation spectra for DBS and indels were plotted using the plot_spectrum function in sigfit. The results of this analysis are described in Extended Data Fig. 8 and Supplementary Note 3.
Regression analyses
To test for associations between epidemiological variables and rates of mutational signatures or driver mutation frequencies, we used mixed-effect regression models (lmer function in the lme4 R package72) as described below.
Outcome variables
For the analyses shown in the main text, we ran a separate regression model for each outcome variable: SNV burden, signature A burden, signature B burden, indel burden, dinucleotide burden, the sum of all driver frequencies in a sample and the driver density per sample for ten major driver genes. To avoid excessive loss of statistical power due to multiple testing correction across all outcome variables and predictors, and to focus on the genes with the highest information content, we restricted the regression analyses to 10 driver genes with ≥1,000 or more coding mutations across mutation types (missense, truncating or no-SNVs) in the dataset, and with dN/dS ≥ 5 (that is, with an estimated driver fraction of 80% or more).
Predictor variables
For the analyses in the main text, we selected nine variables as predictors in multiple regression models, including major oral cancer risk factors as well as other potentially relevant variables: age, sex (female individuals or male individuals), pack-years, drink-years, type 2 diabetes (T2D, Y/N), body mass index, missing teeth, physical activity score (International Physical Activity Questionnaire (IPAQ)) and cancer history (Y/N). The twin structure was modelled with a random effect. The R code used for these and supplementary regressions is provided in the Supplementary Code, but for illustrative purposes the structure was as follows:
$$\begin{array}{c}{\rm{lmer}}({\rm{SNVburden}} \sim {\rm{age}}+{\rm{sex}}+{\rm{packyears}}+{\rm{drinkyears}}+{\rm{T2D}}\\ \,+{\rm{BMI}}+{\rm{missingteeth}}+{\rm{IPAQ}}+{\rm{cancer}}\\ \,+(1| {\rm{familyID}}),{\rm{REML}}=F)\end{array}$$
Only samples with a mean duplex coverage across genes ≥200 dx and available metadata for all the predictor variables and the outcome variable in each multiple regression model were included for analyses. Twelve samples with potential evidence of HPV reads (above) and six samples with a self-reported history of chemotherapy were excluded from the regression. These variables may be expected to have mutagenic and/or selectogenic effects on the oral epithelium, but the number of affected donors was too low for a robust analysis in the current study.
P values were calculated for each covariate in each multivariate regression model using a likelihood-ratio test by comparing the likelihood of the full model with a model without each variable, using the drop1 function in R. Multiple testing adjustment using the Benjamini–Hochberg procedure was then applied to all P values in the main text analyses (126 tests: 14 predictors × 9 outcome variables).
Extra regression models, GWAS and heritability analyses
Extra regression analyses, including using extended medication data as predictors, interaction analyses between smoking and alcohol, and measures of selection (corrected for mutation rates) as outcome variables for the detection of selectogenic influences, are described in Supplementary Note 7. Methods and supplementary results for GWAS analyses and heritability tests are described in Supplementary Note 8.
Reporting summary
Further information on research design is available in the Nature Portfolio Reporting Summary linked to this article.