SSR polymorphism and genetic diversity
In this study, a total number of 233 apple genotypes were genotyped using a set of 15 SSR markers. Based on the molecular data, 51 synonymous genotypes (22%) were detected, which were therefore not included in the subsequent analysis of genetic diversity and structure to avoid bias in genetic analyses. Among the 51 synonyms, 20 groups of duplicates (accessions with the same name and genotype, but grown in different locations) and 21 groups of synonyms (accessions with different names and the same genotype) were identified.
All SSR markers were polymorphic. The primer pair CH02c11 amplified two loci but the secondary locus was monomorphic, as reported by other authors [45, 46], and only the amplification of the main locus was considered. A total of 228 alleles were amplified with an average of 15.2 per locus (Table 2), ranging from 10 (CH02c09) to 23 (CH01f02), but the number of effective alleles per locus was lower (Ne = 6.47). With the exception of locus CH09c09, the other 14 loci contained rare alleles (NR; frequency less than 1%), ranging from 2 (GD147) to 9 (CH01f02) and becoming more frequent as the number of alleles per locus increased. The 15 loci had a polymorphism information content (PIC) ranging from 0.64 (CH-Vf1) to 0.89 (CH02c11), with a mean of 0.80. The power of discrimination (PD) has an overall mean of 0.94 (ranging from 0.86 to 0.98), indicating that the loci are sufficiently polymorphic in discriminating individuals. With an average value of 0.83, the expected heterozygosity (He) of the SSR ranged from 0.70 (CH01h10, CH-Vf1) to 0.90 (CH02c11). The observed heterozygosity (Ho) varied from 0.73 (CH-Vf1) to 0.94 (CH02c11), with a mean value of 0.86.
Table 2 Measures of genetic diversity of 182 unique genotypes. Locus, number of alleles (NA), number of effective alleles (Ne), number of rare alleles (NR), expected (He) and observed (Ho) heterizigosity, power of discrimination (PD), polymorphsm information content (PIC) and inbreeding coefficient (Fi)Accession identification
Pairwise comparison of the SSR profiles revealed 37 groups of genotypes that had the same SSR profile (marker duplicates). The size of these groups, totalling 88 genotypes, ranged from two to six accessions. As a result, 20 groups of duplicates were identified (Weisser Klarapfel, Steirischer Maschanzker, Gravensteiner, Charlamowsky, Geflammter Cardinal, Mollies Delicious, Harberts Renette, Easygro, Goldparmane, Jonathan, Kronprinz Rudolph, Jakob Lebel, Kanada Renette, Gloria Mundi, Bleinheim Renette, Bohnapfel, Glockenapfel, Ontario, Krumstiel, Petnošter). In addition, there were 21 groups in which the names of the genotypes were different or their names were unknown, as shown in Table 3. In two groups the synonyms originated from both locations, in 8 groups the synonyms originated from a different location and in 13 groups the synonyms originated from the same location.
Table 3 Groups of synonyms
In addition, 26 groups of homonyms (same name, different genotype) were found in this study: Roter Astrachan, Weisser Klarapfel, Harberts Renette, Mcintosh, Blauacher Wadenswil, Ananasrenette, Spartan, Bismarckapfel, Obilnaja, Solnečna, James Grieve, Burgundy, Baumanns Renette, Weisser Winterkalvil, Cox’s Orange Renette, Ananasrenette, Dolenjska Voščenka, Reinette de Boskoop, Štajerski Pogačar, Obilnaja, London Pepping, Rožmarinka, NY 623,452, Pesnica, Steirscher Maschanzker and Zgodnja Kavčič. The number of trees with different homonyms varies between 2 and 4, with 20 groups with two genotypes, 5 groups with three genotypes and one group of homonyms with 4 genotypes. Furthermore, in 15 groups of homonyms the genotypes originate from the same location and in 11 groups from different locations (Table 4).
Table 4 Homonyms present in the same and different locationsGenetic structure analysis
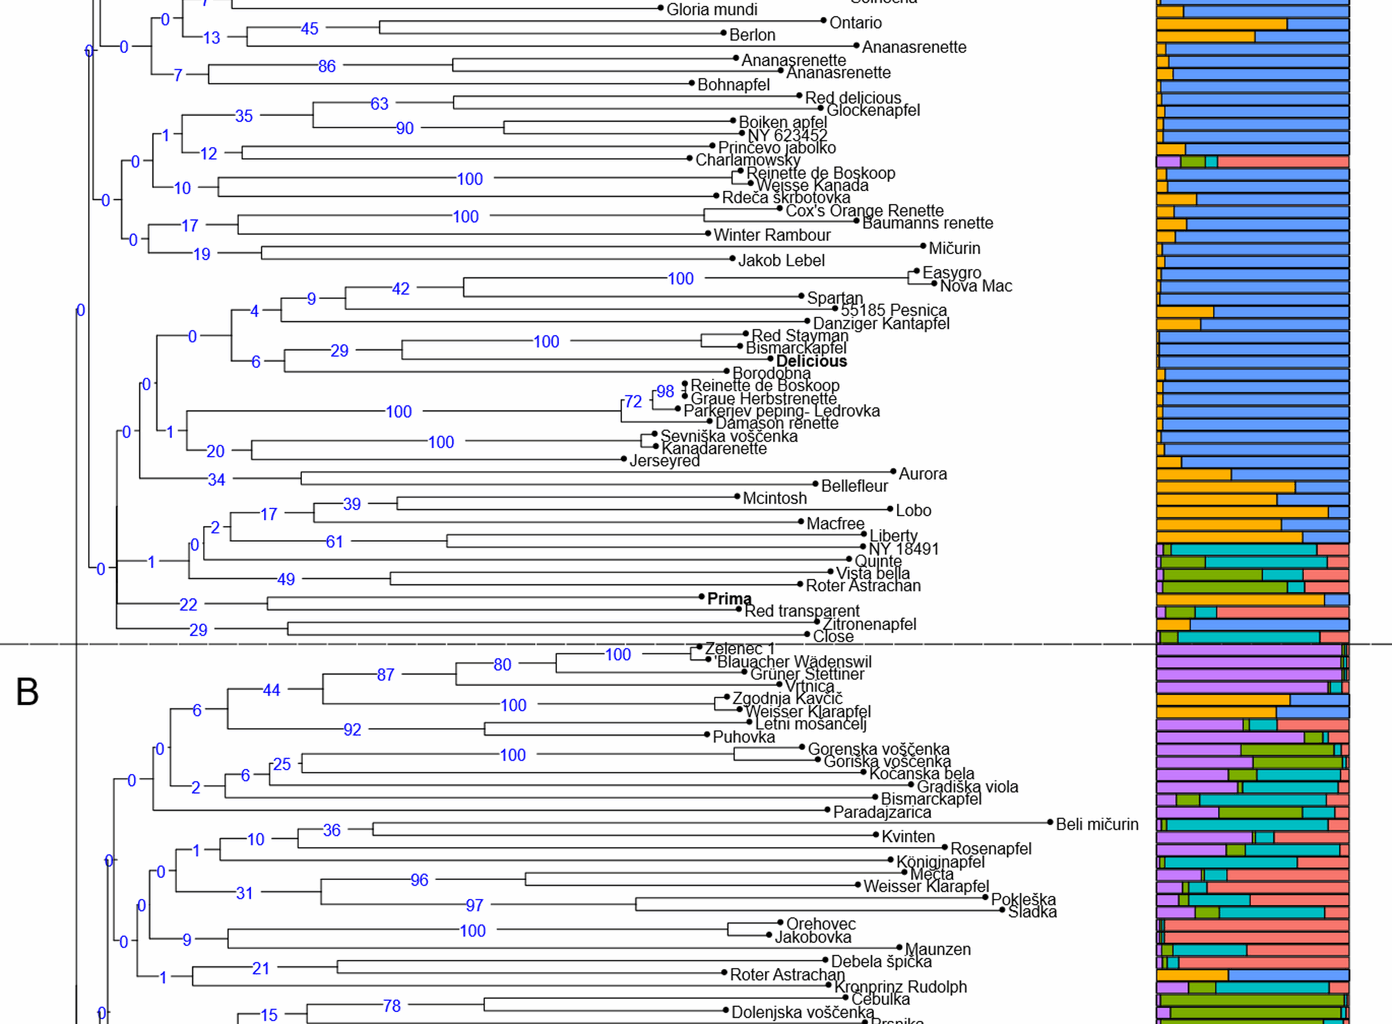
The genetic relationship between the analysed genotypes is represented by UPGMA clusters (Fig. 1). Neighbour-joining tree analysis identified three main groups comprising both diploid and triploid unique genotypes. Group A comprises 106 genotypes, including four reference varieties (Fiesta, Worcester Pearmain, Delicious, Prima), 78 genotypes from Pleterje and 24 from Kozjansko. This group also includes two local varieties, Zelenec 2 and Velika Vahna. It also includes five traditional varieties, Jonathan, Melrose, Ontario, Bohnapfel and Red Delicious. Group B includes 78 genotypes, 23 genotypes from Pleterje and 51 from Kozjansko as well as four reference varieties (Michelin, M9, Malus floribunda 821, Robusta). This group includes seven local varieties Zelenec 1, Gorenska Voščenka, Vivanka, Karla, Dolenjska Voščenka, Goriška Sevka and Paplerjev Bobovec as well as a traditional variety Kronprinz. Group C contains 6 genotypes, 3 genotypes from Pleterje, 3 from Kozjansko and none reference variety. It includes a traditional variety Krumstiel.
Fig. 1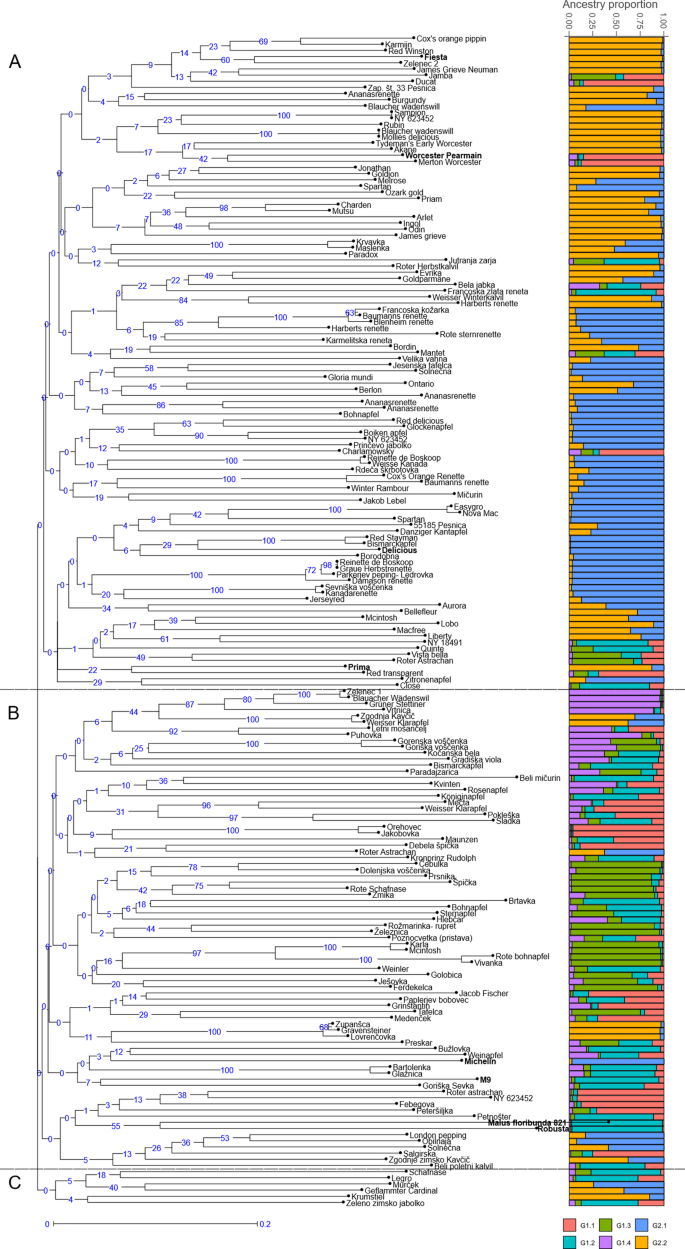
A UPGMA dendrogram showing the genetic relationships between 182 genotypes and 8 reference varieties (in bold). B Group probabilities obtained for K = 2 by Bayesian clustering and its sub-groups. Each bar represents the genetic background of an individual according to the proportion derived from each of the six sub-groups
In addition, a Bayesian analysis of the genetic structure of 182 unique genotypes and 8 reference varieties was performed with STRUCTURE 2.3.4 using K values between 1 and 10, with ten independent assessments of the log likelihood of the data for each K value. The results of the analysis were processed with Structure Selector and showed the most probable hierarchy division into two groups (K = 2, ΔK = 35.5) (Fig. 1). This partition reflected that the analysed material could be divided into two main groups, one comprising 81 genotypes (G1) and the other 111 genotypes (G2). In addition, we decided to perform a nested-Bayesian clustering in which each genotype from group K = 2 was analysed individually. Analysing the relationships between K and ΔK for G1 and G2 resulted in maximum ΔK values at K = 4 for G1 and K = 2 for G2. The descriptive statistics for these final sub-groups obtained in this study are shown in Table 5. The classification of genotypes with qI > 0.80 was 72% for G1, 65% for G2, 43% for G1.1, 21% for G1.2, 55% for G1.3, 50% for G1.4, 78% for G2.1, 72% for G2.2. Group G1.1 contained 21 genotypes and one reference variety (Worcester Pearmain), most of which belong to cluster B in the UPGMA dendrogram. This group contains a local variety Paplerjev Bobovec and other international varieties such as Merton Worcester, Jakob Fischer and Roter Astrachan. Admix varieties in this group are Mečta, Charlamowsky, Grinštantin, Pokleška and Maunzen. Group G1.2 contains 34 genotypes and three reference varieties (M9, Robusta, M. floribunda 821), most of which belong to cluster B in the UPGMA dendrogram. This group includes the local variety Goriška Sevka and international varieties such as Close, Rožnik, Kronprintz Rudolph and Bismarckapfel. Admix varieties in this group are Gradiška Viola, Jutranja Zarja, Poznocvetka, Bela jabka, Sladka and Bohnapfel. Group G1.3 contained 22 genotypes and no reference variety, most of which belong to cluster B in the UPGMA dendrogram. This group includes the local varieties Karla, Vivanka, Gorenska Voščenka and Dolenjska Voščenka as well as international varieties like Roter Astrachan, Rote Schafnase, McIntosh and Rote Bohnapfel. Admix varieties in this group are Preskar, Ješovka, Paradajzarica, Jamba and Vista Bella. Group G1.4 contained 8 genotypes and no reference variety, most of which belong to cluster B in the UPGMA dendrogram. A local variety Zelenec 1 and international varieties such as Blauacher Wadenswil, Gruner Stettiner and Vrtnica are represented in this group. Admix varieties in this group are Kvinten, Letni Mošancelj and Goriška Voščenka. Group G2.1 contains 55 genotypes and two reference varieties (Michelin and Delicious), most of which belong to cluster A in the UPGMA dendrogram. This group includes the local variety Velika Vahna, some traditional varieties such as Melrose, Bohnapfel and Red Delicious and some international varieties such as Ananasrenette, Baumanns Renette, Bleinheim Renette, Harberts Renette, Kanadarenette, Damason Renette, Renette de Boskoop and Glockenapfel. Admix varieties are Maslenka, Aurora, Solnečna and Karmeliter Renette. Group G2.2 contains 50 genotypes and two reference varieties (Prima and Fiesta), most of which belong to cluster A in the UPGMA dendrogram. This group includes the local variety Zelenec 2, some traditional varieties such as Jonathan, Ontario and Krumstiel. Some of the international varieties that belong to this group are: Gravensteiner, Cox’s Orange Pippin, Karmijn, Red Winston, Sampion, Mollies Delicious, James Grieve and Rother Herbst Calvil. Admix are Goldparmane, McIntosh, Zgodnja Kavčič, Geflammter Cardinal and Weisser Klarapfel.
Table 5 Genetic diversity measures for each of the genetic groups and sub-groups defined with STRUCTURE. Number of varieties (n), number of reference varieties (nR), percentage of genotypes with qI > 0.80 to the group, number of local and traditional varieties, number of alleles (NA), number of alleles per locus (NA/locus), expected heterozygosity (He)
Finally, a multivariate principal coordinate analysis (PCoA) performed in DARwin confirmed the genetic discrimination between the groups. The six sub-groups revealed by the structural analysis were distinguished using the PCoA plot, with the two-principal axes (one and two) explaining 5.04% and 4.59% of the variation (Fig. 2).
Fig. 2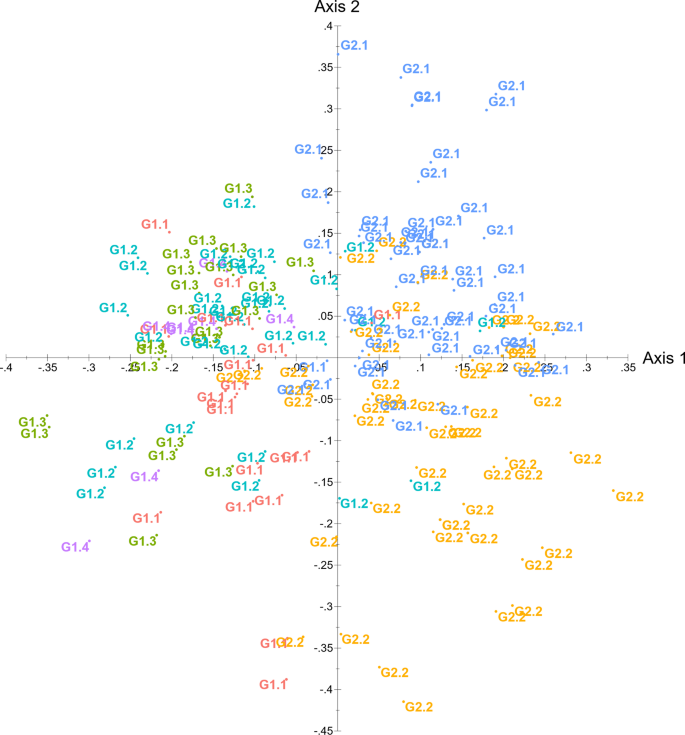
Principal coordinate analysis (PCoA) based on 15 SSR loci of 182 genotypes and 8 reference varieties using DARwin software. The colour codes are based on grouping in Bayesian clustering
Ploidy
SSR peak analysis revealed the presence of polyploidy within the apple germplasm. Fifty-two of the 182 genotypes analysed (28%) had at least three triallelic loci, indicating a triploid nature. Among the analysed loci, CH01h10 had three alleles in all loci of at least 10 genotypes. In addition, locus CH02c11 had three alleles in 46 genotypes, demonstrating its high sensitivity for the detection of triploid genotypes. The distribution of triallelic loci varied between genotypes, with some genotypes showing triallelic patterns across multiple loci, such as Rožnik with three alleles at 10 loci, while others show this pattern at fewer loci, such as Zupanšca with three alleles at 4 loci.
To confirm the presence of triploid genotypes, flow cytometry was performed. Among 182 genotypes analysed, 41 triploids were identified, corresponding to 23% of all genotypes analysed (Table 6). All genotypes predicted as triploids by SSR analysis were confirmed by flow cytometry.
Table 6 Triploid genotypes identified by flow cytometry