Oct 18, 2025
IndexBox has just published a new report: United Kingdom – Non-Household Ventilation Fans – Market Analysis, Forecast, Size, Trends And Insights.
The UK non-household ventilation fan market experienced a contraction in 2024, with consumption falling to 13M units and market revenue declining to $273M. Despite this short-term dip, the long-term outlook remains positive, with the market forecast to grow at a CAGR of +4.7% in volume and +5.4% in value, reaching 21M units and $485M by 2035. The UK is heavily reliant on imports, which totaled 14M units in 2024, with China being the dominant supplier by volume (62%), while the United States, Germany, and China were the top suppliers by value. Domestic production was stable at 534K units, valued at $54M. Exports saw growth, reaching 1.6M units valued at $322M, with the United States being the most valuable export destination. Significant price disparities exist, with the average import price at $40 per unit and the average export price at $202 per unit, reflecting different product segments and quality.
Key Findings
- Market forecast to grow to 21M units and $485M by 2035, with CAGRs of +4.7% and +5.4% respectively
- 2024 saw a market contraction with consumption at 13M units and revenue at $273M
- Imports dominate supply, with China providing 62% of volume but the US being the top value supplier
- Exports are high-value, averaging $202 per unit, with the US as the key market
- Domestic production is limited, accounting for only about 4% of the domestic market volume
Market Forecast
Driven by increasing demand for non-household ventilation fans in the UK, the market is expected to continue an upward consumption trend over the next decade. Market performance is forecast to retain its current trend pattern, expanding with an anticipated CAGR of +4.7% for the period from 2024 to 2035, which is projected to bring the market volume to 21M units by the end of 2035.
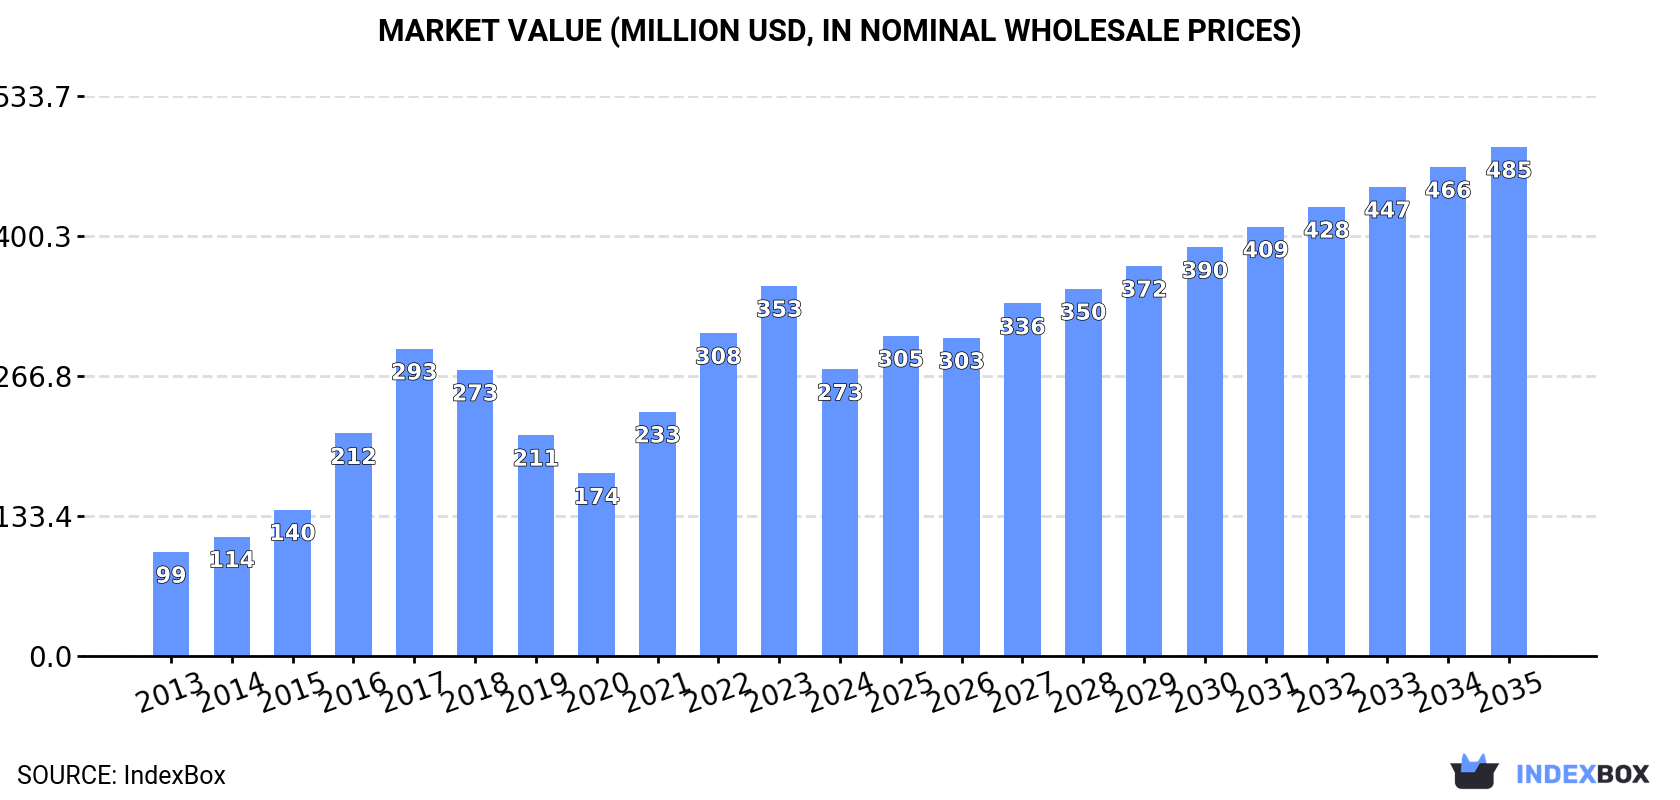
In value terms, the market is forecast to increase with an anticipated CAGR of +5.4% for the period from 2024 to 2035, which is projected to bring the market value to $485M (in nominal wholesale prices) by the end of 2035.
 ConsumptionUnited Kingdom’s Consumption of Non-Household Ventilation Fans
Non-household fan consumption in the UK declined to 13M units in 2024, waning by -11.2% on the previous year’s figure. Overall, the total consumption indicated a noticeable expansion from 2013 to 2024: its volume increased at an average annual rate of +4.1% over the last eleven years. The trend pattern, however, indicated some noticeable fluctuations being recorded throughout the analyzed period. Based on 2024 figures, consumption increased by +38.4% against 2020 indices. As a result, consumption attained the peak volume of 14M units, and then declined in the following year.
The revenue of the non-household fan market in the UK reduced sharply to $273M in 2024, with a decrease of -22.6% against the previous year. This figure reflects the total revenues of producers and importers (excluding logistics costs, retail marketing costs, and retailers’ margins, which will be included in the final consumer price). In general, consumption, however, continues to indicate a prominent increase. Non-household fan consumption peaked at $353M in 2023, and then reduced remarkably in the following year.
ProductionUnited Kingdom’s Production of Non-Household Ventilation Fans
In 2024, the amount of non-household ventilation fans produced in the UK reached 534K units, flattening at 2023. In general, the total production indicated a remarkable increase from 2013 to 2024: its volume increased at an average annual rate of +6.1% over the last eleven years. The trend pattern, however, indicated some noticeable fluctuations being recorded throughout the analyzed period. Based on 2024 figures, production decreased by -1.4% against 2022 indices. The pace of growth appeared the most rapid in 2017 when the production volume increased by 51%. Over the period under review, production attained the maximum volume at 542K units in 2022; however, from 2023 to 2024, production stood at a somewhat lower figure.
In value terms, non-household fan production fell slightly to $54M in 2024 estimated in export price. Overall, production continues to indicate a buoyant expansion. The pace of growth appeared the most rapid in 2021 with an increase of 44%. As a result, production attained the peak level of $58M. From 2022 to 2024, production growth remained at a lower figure.
ImportsUnited Kingdom’s Imports of Non-Household Ventilation Fans
In 2024, approx. 14M units of non-household ventilation fans were imported into the UK; shrinking by -9.7% on the previous year’s figure. The total import volume increased at an average annual rate of +2.7% from 2013 to 2024; however, the trend pattern indicated some noticeable fluctuations being recorded in certain years. The growth pace was the most rapid in 2016 with an increase of 27% against the previous year. Over the period under review, imports reached the peak figure at 15M units in 2023, and then reduced in the following year.
In value terms, non-household fan imports dropped to $541M in 2024. In general, total imports indicated a strong increase from 2013 to 2024: its value increased at an average annual rate of +6.4% over the last eleven years. The trend pattern, however, indicated some noticeable fluctuations being recorded throughout the analyzed period. Based on 2024 figures, imports increased by +56.0% against 2020 indices. The most prominent rate of growth was recorded in 2022 with an increase of 28% against the previous year. Imports peaked at $579M in 2023, and then declined in the following year.
Imports By Country
In 2024, China (8.5M units) constituted the largest supplier of non-household fan to the UK, accounting for a 62% share of total imports. Moreover, non-household fan imports from China exceeded the figures recorded by the second-largest supplier, Germany (1.4M units), sixfold. Hungary (814K units) ranked third in terms of total imports with a 6% share.
From 2013 to 2024, the average annual growth rate of volume from China totaled +9.7%. The remaining supplying countries recorded the following average annual rates of imports growth: Germany (-7.7% per year) and Hungary (+45.2% per year).
In value terms, the United States ($145M), Germany ($112M) and China ($82M) were the largest non-household fan suppliers to the UK, with a combined 63% share of total imports. Italy, France, Hungary, North Macedonia, the Netherlands, the Philippines, Taiwan (Chinese) and Hong Kong SAR lagged somewhat behind, together accounting for a further 23%.
North Macedonia, with a CAGR of +90.4%, recorded the highest growth rate of the value of imports, in terms of the main suppliers over the period under review, while purchases for the other leaders experienced more modest paces of growth.
Import Prices By Country
The average non-household fan import price stood at $40 per unit in 2024, picking up by 3.5% against the previous year. Overall, import price indicated tangible growth from 2013 to 2024: its price increased at an average annual rate of +3.6% over the last eleven years. The trend pattern, however, indicated some noticeable fluctuations being recorded throughout the analyzed period. Based on 2024 figures, non-household fan import price decreased by -8.5% against 2022 indices. The pace of growth appeared the most rapid in 2022 an increase of 36% against the previous year. As a result, import price attained the peak level of $44 per unit. From 2023 to 2024, the average import prices remained at a lower figure.
Prices varied noticeably by country of origin: amid the top importers, the country with the highest price was the United States ($589 per unit), while the price for Hong Kong SAR ($3.7 per unit) was amongst the lowest.
From 2013 to 2024, the most notable rate of growth in terms of prices was attained by the United States (+12.1%), while the prices for the other major suppliers experienced more modest paces of growth.
ExportsUnited Kingdom’s Exports of Non-Household Ventilation Fans
In 2024, approx. 1.6M units of non-household ventilation fans were exported from the UK; picking up by 8.6% against the year before. Over the period under review, exports, however, recorded a noticeable decrease. The most prominent rate of growth was recorded in 2022 when exports increased by 44%. Over the period under review, the exports hit record highs at 3M units in 2016; however, from 2017 to 2024, the exports stood at a somewhat lower figure.
In value terms, non-household fan exports rose rapidly to $322M in 2024. In general, exports posted measured growth. The pace of growth was the most pronounced in 2018 when exports increased by 49% against the previous year. Over the period under review, the exports reached the peak figure in 2024 and are likely to see gradual growth in years to come.
Exports By Country
France (348K units), the Netherlands (243K units) and the United States (147K units) were the main destinations of non-household fan exports from the UK, with a combined 46% share of total exports.
From 2013 to 2024, the most notable rate of growth in terms of shipments, amongst the main countries of destination, was attained by the United States (with a CAGR of +16.4%), while the other leaders experienced more modest paces of growth.
In value terms, the United States ($74M) remains the key foreign market for non-household ventilation fans exports from the UK, comprising 23% of total exports. The second position in the ranking was taken by France ($35M), with an 11% share of total exports. It was followed by Germany, with an 8.7% share.
From 2013 to 2024, the average annual growth rate of value to the United States amounted to +16.1%. Exports to the other major destinations recorded the following average annual rates of exports growth: France (+5.3% per year) and Germany (+6.7% per year).
Export Prices By Country
The average non-household fan export price stood at $202 per unit in 2024, growing by 5.2% against the previous year. Over the period under review, the export price posted a resilient increase. The most prominent rate of growth was recorded in 2023 an increase of 84% against the previous year. The export price peaked in 2024 and is expected to retain growth in the near future.
Prices varied noticeably by country of destination: amid the top suppliers, the country with the highest price was India ($656 per unit), while the average price for exports to Romania ($28 per unit) was amongst the lowest.
From 2013 to 2024, the most notable rate of growth in terms of prices was recorded for supplies to Australia (+23.9%), while the prices for the other major destinations experienced more modest paces of growth.
Source: IndexBox Market Intelligence Platform