Oct 19, 2025
IndexBox has just published a new report: EU – Cobalt – Market Analysis, Forecast, Size, Trends And Insights.
This article provides a comprehensive analysis of the cobalt market in the European Union. It details that in 2024, the market consumed 32K tons, valued at $975M, showing a decline from previous peaks. Production within the EU was stable at 24K tons, led by Finland. The market is forecast to grow over the next decade, with volume reaching 41K tons and value reaching $1.3B by 2035. The report covers consumption patterns by country, with Finland, Belgium, and Germany being the largest consumers. It also analyzes import and export dynamics, noting a significant drop in imports to 18K tons in 2024, and highlights the substantial differences in import and export prices among member states.
Key Findings
- EU cobalt market is forecast to grow to 41K tons in volume and $1.3B in value by 2035
- Finland is the dominant producer and consumer, accounting for 66% of production and the highest per capita consumption
- Market consumption in 2024 was 32K tons, a significant decrease from its peak of 86K tons
- Belgium and the Netherlands are the primary hubs for cobalt trade, leading in both imports and exports
- Significant price disparities exist, with Germany’s import price being over three times that of Spain
Market Forecast
Driven by rising demand for cobalt in the European Union, the market is expected to start an upward consumption trend over the next decade. The performance of the market is forecast to increase slightly, with an anticipated CAGR of +2.3% for the period from 2024 to 2035, which is projected to bring the market volume to 41K tons by the end of 2035.
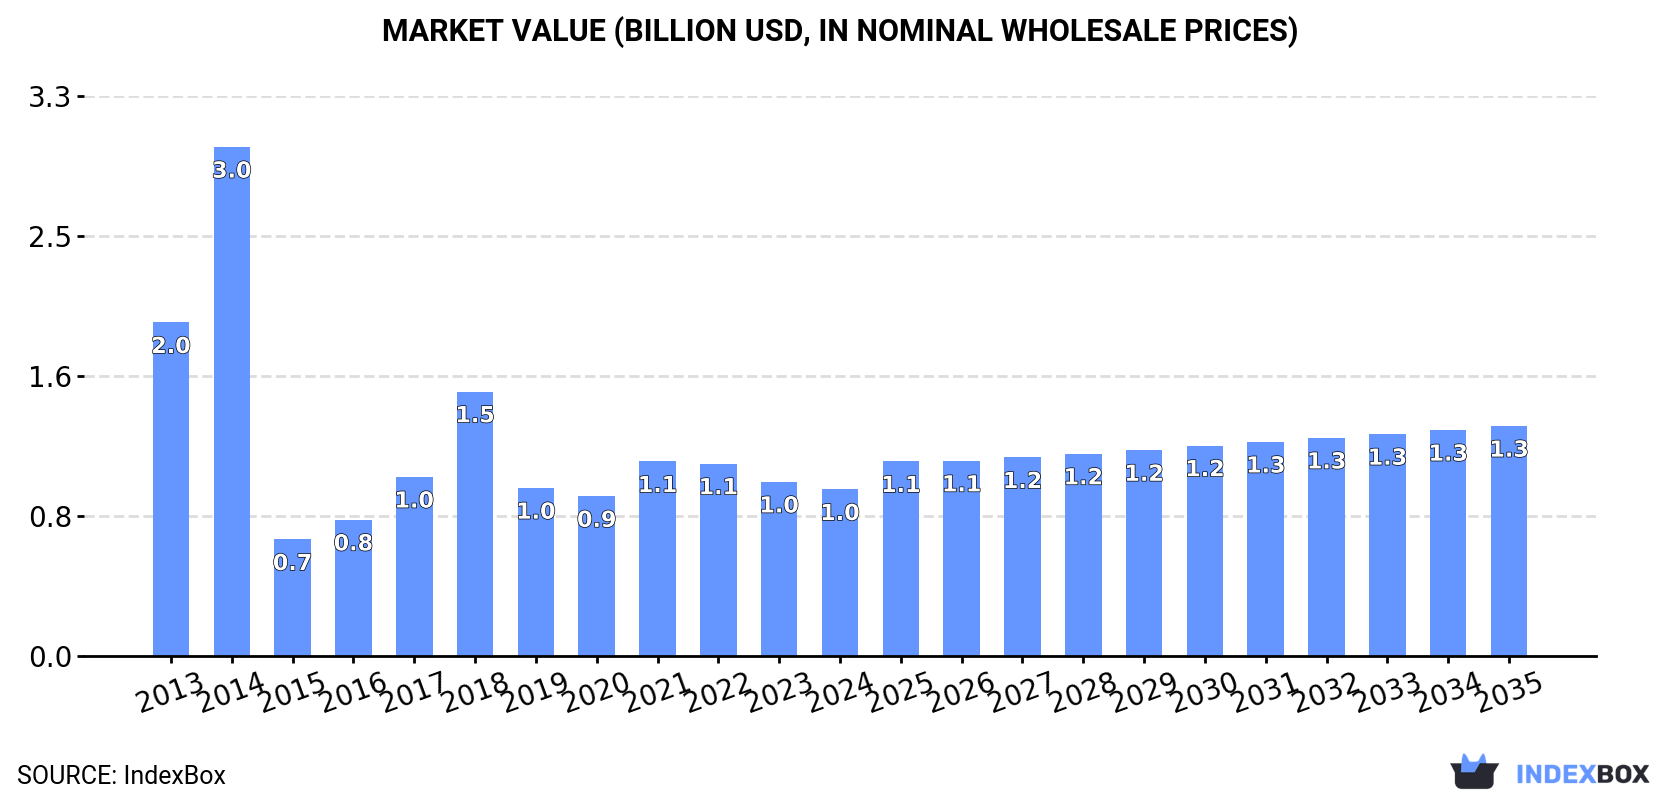
In value terms, the market is forecast to increase with an anticipated CAGR of +3.0% for the period from 2024 to 2035, which is projected to bring the market value to $1.3B (in nominal wholesale prices) by the end of 2035.
 ConsumptionEuropean Union’s Consumption of Cobalt
In 2024, approx. 32K tons of cobalt were consumed in the European Union; waning by -4.9% compared with the year before. In general, consumption saw a perceptible setback. As a result, consumption reached the peak volume of 86K tons. From 2015 to 2024, the growth of the consumption remained at a somewhat lower figure.
The size of the cobalt market in the European Union reduced modestly to $975M in 2024, with a decrease of -4.3% against the previous year. This figure reflects the total revenues of producers and importers (excluding logistics costs, retail marketing costs, and retailers’ margins, which will be included in the final consumer price). Over the period under review, consumption recorded a abrupt decline. As a result, consumption attained the peak level of $3B. From 2015 to 2024, the growth of the market remained at a somewhat lower figure.
Consumption By Country
The countries with the highest volumes of consumption in 2024 were Finland (16K tons), Belgium (10K tons) and Germany (1.6K tons), with a combined 87% share of total consumption. Italy, Spain, Austria and Ireland lagged somewhat behind, together accounting for a further 9.8%.
From 2013 to 2024, the most notable rate of growth in terms of consumption, amongst the main consuming countries, was attained by Spain (with a CAGR of +28.8%), while consumption for the other leaders experienced more modest paces of growth.
In value terms, Finland ($572M) led the market, alone. The second position in the ranking was taken by Belgium ($174M). It was followed by Germany.
From 2013 to 2024, the average annual growth rate of value in Finland amounted to -9.5%. In the other countries, the average annual rates were as follows: Belgium (+20.5% per year) and Germany (-1.3% per year).
In 2024, the highest levels of cobalt per capita consumption was registered in Finland (2,796 kg per 1000 persons), followed by Belgium (890 kg per 1000 persons), Ireland (97 kg per 1000 persons) and Austria (67 kg per 1000 persons), while the world average per capita consumption of cobalt was estimated at 71 kg per 1000 persons.
From 2013 to 2024, the average annual rate of growth in terms of the cobalt per capita consumption in Finland amounted to -9.9%. The remaining consuming countries recorded the following average annual rates of per capita consumption growth: Belgium (+18.9% per year) and Ireland (+9.4% per year).
ProductionEuropean Union’s Production of Cobalt
Cobalt production amounted to 24K tons in 2024, stabilizing at the previous year. The total output volume increased at an average annual rate of +2.5% from 2013 to 2024; however, the trend pattern indicated some noticeable fluctuations being recorded in certain years. The most prominent rate of growth was recorded in 2016 with an increase of 17%. Over the period under review, production attained the peak volume at 24K tons in 2022; however, from 2023 to 2024, production failed to regain momentum.
In value terms, cobalt production expanded markedly to $856M in 2024 estimated in export price. The total production indicated a pronounced increase from 2013 to 2024: its value increased at an average annual rate of +3.1% over the last eleven years. The trend pattern, however, indicated some noticeable fluctuations being recorded throughout the analyzed period. Based on 2024 figures, production decreased by -17.3% against 2022 indices. The pace of growth was the most pronounced in 2017 with an increase of 53% against the previous year. The level of production peaked at $1.1B in 2018; however, from 2019 to 2024, production failed to regain momentum.
Production By Country
Finland (16K tons) constituted the country with the largest volume of cobalt production, accounting for 66% of total volume. Moreover, cobalt production in Finland exceeded the figures recorded by the second-largest producer, Belgium (6.8K tons), twofold.
From 2013 to 2024, the average annual rate of growth in terms of volume in Finland totaled +3.4%. The remaining producing countries recorded the following average annual rates of production growth: Belgium (+2.1% per year) and Germany (-13.4% per year).
ImportsEuropean Union’s Imports of Cobalt
In 2024, the amount of cobalt imported in the European Union contracted notably to 18K tons, which is down by -29.1% against 2023 figures. In general, imports saw a deep setback. The growth pace was the most rapid in 2018 with an increase of 190%. The volume of import peaked at 76K tons in 2014; however, from 2015 to 2024, imports remained at a lower figure.
In value terms, cobalt imports reduced markedly to $422M in 2024. Overall, imports, however, saw a modest increase. The pace of growth appeared the most rapid in 2018 when imports increased by 177%. As a result, imports attained the peak of $1B. From 2019 to 2024, the growth of imports remained at a somewhat lower figure.
Imports By Country
In 2024, Belgium (7.1K tons) represented the largest importer of cobalt, generating 40% of total imports. The Netherlands (4.3K tons) took the second position in the ranking, distantly followed by Germany (1.5K tons), France (1.2K tons), Italy (1.1K tons) and Spain (1.1K tons). All these countries together took near 52% share of total imports. Austria (605 tons) followed a long way behind the leaders.
From 2013 to 2024, the biggest increases were recorded for Spain (with a CAGR of +29.0%), while purchases for the other leaders experienced more modest paces of growth.
In value terms, the largest cobalt importing markets in the European Union were the Netherlands ($119M), Belgium ($115M) and Germany ($63M), with a combined 70% share of total imports.
The Netherlands, with a CAGR of +15.3%, recorded the highest growth rate of the value of imports, in terms of the main importing countries over the period under review, while purchases for the other leaders experienced more modest paces of growth.
Import Prices By Country
The import price in the European Union stood at $23,888 per ton in 2024, rising by 1.9% against the previous year. In general, the import price continues to indicate prominent growth. The most prominent rate of growth was recorded in 2015 an increase of 670% against the previous year. As a result, import price attained the peak level of $53,627 per ton. From 2016 to 2024, the import prices failed to regain momentum.
There were significant differences in the average prices amongst the major importing countries. In 2024, amid the top importers, the country with the highest price was Germany ($41,534 per ton), while Spain ($11,785 per ton) was amongst the lowest.
From 2013 to 2024, the most notable rate of growth in terms of prices was attained by Austria (+4.7%), while the other leaders experienced more modest paces of growth.
ExportsEuropean Union’s Exports of Cobalt
In 2024, approx. 9.8K tons of cobalt were exported in the European Union; declining by -35.5% compared with the previous year. Over the period under review, exports showed a mild descent. The growth pace was the most rapid in 2019 with an increase of 80%. Over the period under review, the exports hit record highs at 17K tons in 2022; however, from 2023 to 2024, the exports failed to regain momentum.
In value terms, cobalt exports shrank significantly to $298M in 2024. In general, exports continue to indicate a mild decrease. The pace of growth appeared the most rapid in 2018 when exports increased by 137% against the previous year. Over the period under review, the exports attained the peak figure at $669M in 2022; however, from 2023 to 2024, the exports remained at a lower figure.
Exports By Country
The Netherlands (4.3K tons) and Belgium (3.5K tons) prevails in exports structure, together committing 80% of total exports. It was distantly followed by France (915 tons) and Germany (824 tons), together constituting an 18% share of total exports.
From 2013 to 2024, the most notable rate of growth in terms of shipments, amongst the leading exporting countries, was attained by the Netherlands (with a CAGR of +7.5%), while the other leaders experienced more modest paces of growth.
In value terms, the largest cobalt supplying countries in the European Union were the Netherlands ($126M), Belgium ($99M) and Germany ($40M), together comprising 89% of total exports.
The Netherlands, with a CAGR of +20.5%, recorded the highest rates of growth with regard to the value of exports, among the main exporting countries over the period under review, while shipments for the other leaders experienced more modest paces of growth.
Export Prices By Country
The export price in the European Union stood at $30,475 per ton in 2024, surging by 17% against the previous year. Overall, the export price continues to indicate a relatively flat trend pattern. The most prominent rate of growth was recorded in 2018 when the export price increased by 44% against the previous year. As a result, the export price reached the peak level of $71,283 per ton. From 2019 to 2024, the export prices remained at a lower figure.
Prices varied noticeably by country of origin: amid the top suppliers, the country with the highest price was Germany ($48,601 per ton), while France ($26,998 per ton) was amongst the lowest.
From 2013 to 2024, the most notable rate of growth in terms of prices was attained by the Netherlands (+12.2%), while the other leaders experienced mixed trends in the export price figures.
Source: IndexBox Market Intelligence Platform
