Figure 1 shows the experimental setup for detecting frequency up-conversion of sub-THz waves. The pump light source was a laboratory-made, passively Q-switched microchip Nd: YAG laser (pulse width: 0.9 ns, pulse energy: 0.5 mJ, wavelength: 1064.4 nm, spectral width: less than 0.01 nm (limited by the optical spectrum analyzer resolution)) operating in a single longitudinal mode. The subnanosecond pulsed laser effectively suppresses induced Brillouin scattering22. The insufficient output power of the microchip laser was amplified using a laboratory-made, Nd: YAG optical amplifier, yielding a final pulse energy of 15 mJ. A beam splitter divided the amplified laser beam into two pump beams, enabling both the generation and detection of sub-THz waves through the backward optical parametric process. In this paper, a pump beam used for generation is denoted as pumpg, and a pump beam used for detection is denoted as pumpD. A continuous-wave (CW) external cavity diode laser (l-master 1040, Spectraquest Lab.) was also used for generation of sub-THz waves as injection seeder, which stabilizes and enhances high-power sub-THz oscillations. Pumpg and the seeding beams were irradiated into a PPLN crystal, which has a cross-section of 1 mm in thickness and 5 mm in width, and a length of 50 mm, for sub-THz wave generation (The PPLN for generation is denoted by PPLNg). The oscillation frequency depends on the angle between the pumpg beam’s wavevector and the periodic poling vector of the crystal grating. In this configuration, a 6-mJ pumpg pulse and a CW seeding power of 500 mW generated sub-THz wave with frequency of 308 GHz and a pulse energy of 10 nJ.
Fig. 1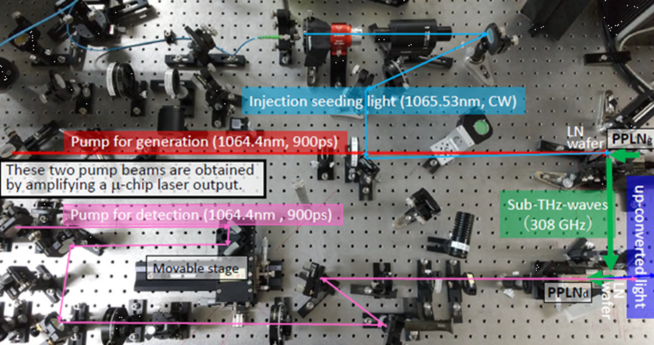
Experimental setup of sub-THz wave detection. The red and blue lines indicate the paths of the generation pump beam and injection seeding, respectively. The pink path directs the other split pump beam toward a second PPLN crystal. The green path redirects the sub-THz wave into the rear side of the PPLNd crystal.
The split pumpd beam at the detection side was directed to another PPLN crystal (The PPLN for detection is denoted by PPLNd) for frequency up-conversion detection of the sub-THz wave as shown in Fig. 1. The sub-THz wave was emitted in the backward direction to the pumpD direction from the PPLNg and redirected (through 90°) by a lithium niobate wafer placed in front of the PPLNg. The dimension of the PPLNd is the same as that of PPLNg. The lithium niobate wafer has a high refractive index of 6.6 at around 300 GHz23 and its reflectivity reaches about 90% at a thickness of 0.5 mm. The wafer is coated with an antireflective (AR) layer optimized for 1064 nm wavelength, allowing both the pumpg and seeding beams pass through. The redirected sub-THz wave was reflected again by a second lithium niobate wafer with same specification, changing its propagation axis by another 90° before final injection into the rear side of the PPLNd crystal (green path in Fig. 1). To ensure efficient coupling into the PPLNd crystal (with a cross section of (1 × 5) mm²), the sub-THz wave was focused through a convex lens. Because both the pumpd beam and the sub-THz wave used for frequency up-conversion detection are less than 0.9 ns in pulse width, their temporal overlap must be precisely synchronized. For this purpose, a movable stage for timing control was inserted in the pumpd beam path as also shown in Fig. 1. Furthermore, to ensure efficient frequency up-conversion detection in the PPLNd crystal, the wavelength of the idler wave generated by backward parametric oscillation in the PPLNg must match that of the idler wave that would be generated by the same process in PPLNd. Because the wavelengths of the up-converted light and the intense pumpd beam are almost equal, the external angle between the two beams is very small. In addition, the up-converted signal beam tends to be spatially overlapped with scattered pumpd light within the crystal. Therefore, the up-converted light was separated from the pumpd light through a diffraction grating and then detected by an avalanche photodiode (APD, C5658, HAMAMATSU Photonics). By overcoming these technical challenges, we achieved the first successful detection of a frequency up-conversion signal from sub-THz waves.
Experimental results
Figure 2a shows the temporal waveforms of the frequency up-converted light and the pumpd light, measured using a 25 GHz high-speed photodetector (Newport model 1434) and a high-speed oscilloscope with a 40-GHz bandwidth (UXR0404A, Keysight). The slightly shorter pulse width of the up-converted light than of the pumpd light is attributable to nonlinear optical effects. Not only the up-converted light was separated from the intense pumpd light using diffraction grating, but also scattered light contamination was also minimized by positioning the detector sufficiently far away as shown in Fig. 2 (b). The up-converted signal given in red waveform in Fig. 2(a) changes into the blue one when the sub-THz wave input to the PPLNd is blocked by a metal plate.
Fig. 2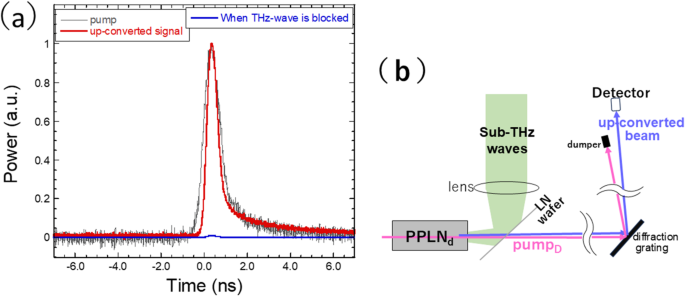
(a) Temporal waveforms of the frequency up-converted light (red) and pump light(gray). (b) Schematic diagram of up-converted light measurement.
This finding confirms that the sub-THz wave is indeed converted into near-infrared light via a backward parametric process.
Figure 3 shows measured wavelength spectra by using optical spectrum analyzer (Q8341, Advantest). The up-converted light wavelength was measured as 1065.53 nm, consistent with the energy conservation law for a pumpd wavelength of 1064.4 nm and an input sub-THz wave frequency of 308 GHz. Figure 3 also shows the measured wavelengths consistency between the idler wave generated in the PPLNg and the up-converted light in PPLNd. The frequency tolerance in the up-conversion detection was also checked by only changing input frequency of sub-THz waves. Up-converted lights became undetectable with a frequency shift of only 1 GHz from 308 GHz, indicating narrow frequency tolerance due to the backward quasi-phase matching condition.
Fig. 3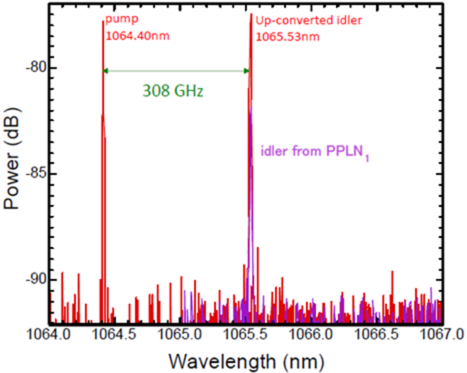
Measured wavelength spectra of the pump, up-converted light, and idler wave.
Figure 4 plots the up-conversion signal intensity as functions of pulse energy of the input sub-THz wave at different pumpd pulse energies (3.7, 5.5, and 6.5 mJ). The sub-THz pulse energy was first calibrated with a THz power meter (THZ20, Sensor- und Lasertechnik, GmbH) and then gradually attenuating by inserting 1-mm thick glass plates, each with a transmittance of 23% at 308 GHz, prior to injection into the PPLNd crystal. The up-converted light was detected using an APD. As expected, the intensity of the up-converted light decreased with decreasing energy of the incident sub-THz wave. In the backward parametric process, the injected THz wave interacts with the PPLN crystal, where the idler is generated. While the idler can enhance the up-conversion signal through gain concentration, it also introduces additional noise. Although reducing the pumpd intensity suppresses the noise components, it simultaneously lowers the up-conversion efficiency. Therefore, finding the optimal pumpd pulse energy that best balances the noise–efficiency tradeoff is important for effective up-conversion detection. In our experiments, the optimal pumpd pulse energy that maximized the signal-to-noise performance was determined as 5.5 mJ. The detection sensitivity was mainly limited by scattered light noise from the high-intensity pumpd beam and idler light generated by the BW-TPO process. Under this condition, the up-conversion signal intensity decreased to the noise level at an incident sub-THz wave pulse energy of approximately 50 × 10−18 J (50 aJ). This detection level corresponds to a photon number of order 105, approximately 103 and 108 times higher than those of a silicon bolometer cooled to 4 K and a pyroelectric detector, respectively24. It is worth noting that detection sensitivity depends not only on pumpd intensity, but also on the pulse width of the pumpd light and the length of the PPLNd crystal. Optimizing these factors may also improve the detection performance and overall system sensitivity.
Fig. 4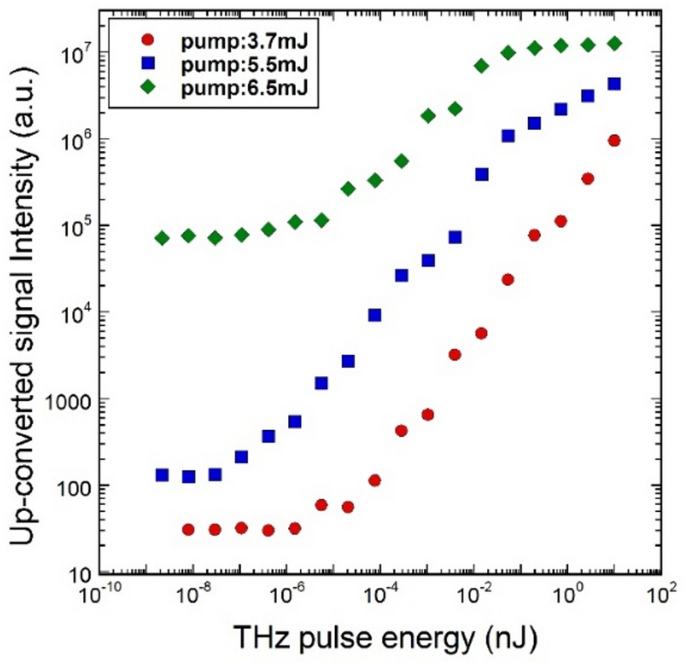
Up-conversion detection results. The vertical axis represents the intensity of the detected up-conversion signal, while the horizontal axis indicates the pulse energy of the input subterahertz wave. The color differences represent variations in the input pulse energy to the PPLNd crystal.
Although this experimental demonstration was conducted at sub-THz frequency, 308 GHz, both the oscillation and detection frequencies in our system can be easily tuned by mechanically rotating the PPLN crystals.
To demonstrate frequency tunability of up-conversion detection, we mounted two PPLN crystals—one for generation, the other for detection—on rotation stages with an angular resolution of 0.0025°. These stages are driven by stepping motors and precisely controlled. First, the rotation angle of the PPLNd at the detection side was adjusted until the wavelength of the idler light generated from the PPLNd matched that of the PPLNg at the generation side. Both crystals were then synchronously rotated under the same number of driving pulses. This method successfully achieved frequency-tunable up-conversion detection (Fig. 5). The frequency tunability is particularly important for spectroscopy application. Although the detectable frequency range was limited to approximately 35 GHz, this limitation is attributed to the rectangular cross-sectional shape of the PPLNd crystal. As the crystal rotates, refraction displaces the forward-propagating pumpd beam from the backward-injected terahertz wave, reducing the conversion efficiency. A disk-shaped PPLN crystal is expected to minimize the beam displacement during rotation, widening the range of continuously tunable up-conversion detection. Such a design will be considered in future work.
Fig. 5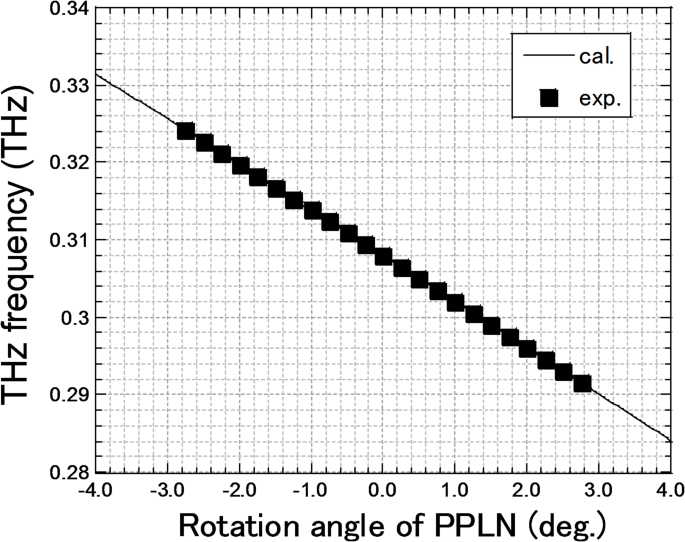
Frequency tunability of detection. The horizontal axis represents the rotation angle of the two PPLN crystals, where 0° is the nominal angle for generating a 308-GHz wave. The vertical axis indicates the frequency at which an up-conversion signal can be detected.