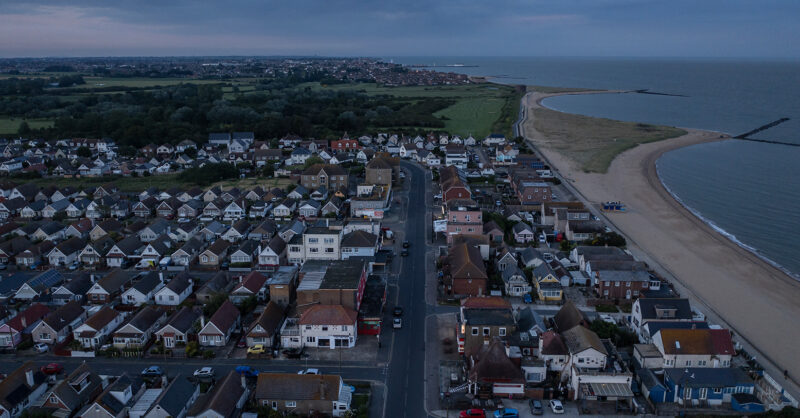
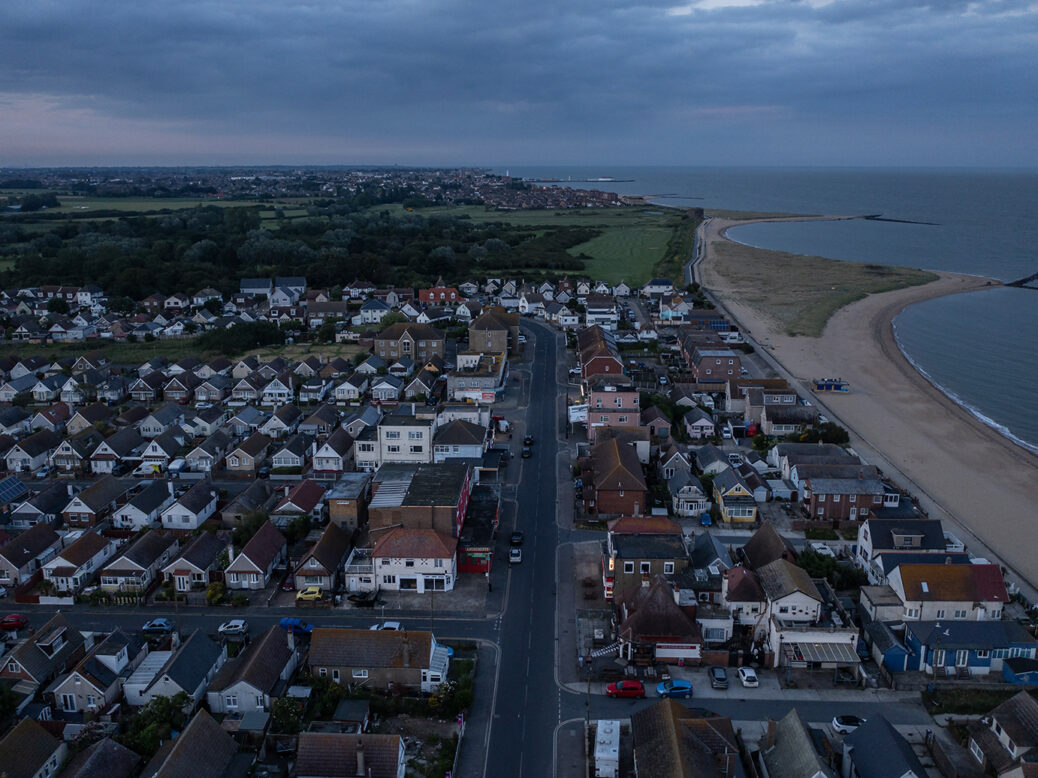
An aerial view over Jaywick, in Clacton-on-Sea. Photo by Dan Kitwood/Getty Images
Jaywick, a coastal village in Clacton, is the most deprived village in England and Wales. It was the most deprived ten years ago. Since then it has got worse.
The deprivation index asks simple but essential questions: where are the most and least deprived parts of Britain today? Where is it getting better? Where is it getting worse? The briefing note accompanying this swathe of new stats tells us the rate of children living in income deprived households is up. In London it’s up by an eye-watering amount. In 2019 across the Tower Hamlets borough it was 27 per cent; now it’s 72 per cent. Among older people it was 44 per cent in 2019; now it’s 62 per cent.
This is but one snapshot of a beastly series of stats. The aggregate deprivation score by neighbourhood is important, though a little confusing. It can mean different things to different areas. Plush homes and their long-driveways can rank high for relative deprivation if there are few jobs or sources of education and income – if, essentially, that neighbourhood is pensioner-heavy. That’s what this data is telling us today.
What, then, is the key takeaway from the index? Places that were deprived six years ago have mostly stayed the same or worsened.
Bloomfield, a neighbourhood hidden from the Blackpool seafront by the town’s football stadium, ranks top as the ward (geographies represented by councillors) with the highest level of deprivation in England and Wales. Weeds encroaching on the roads and pavements as level as Everest may sound like what a lot of England has had to put up with for the best part of two decades. But in Bloomfield this is coupled with an absence of job and education opportunities, all the while its residents rely more on welfare than a stable income.
Notable in the numbers is what’s changed since 2019. The bigger deprivation increases come not in the north but the south, in Golders Green, Barnet (yes, really); Bowbrook in Wychavon (Dorset), Martock in Somerset, St Stephen’s in Canterbury, Brede in Rother (Sussex), and the harbourside of Gosport. Handsworth ward in Birmingham, once 127th for most deprived, now ranks 15th. Springfield in Hackney, 754th in 2019, is now 100th. Witham ward in Boston, now a Reform bastion, once 1,636th for the most deprived ward in England and Wales, is now 538th.
Areas where pro-Gaza Independent candidates won last year have on average seen deprivation rise by more than other parties. Green and Labour wins come on average in areas where deprivation has gone down over the last years, while for wards won by Conservative, Lib Dem, Plaid and Reform candidates, deprivation has gone up.
What does all this tell us? The concentration of the highest deprivation rises these past six years appear to disproportionately affect the south, not the north.
This could be explained in a few ways. An overheated housing market has those looking to work in Brighton, to name but one example, seek homes further afield on the Sussex coast, be it in Hastings or Worthing, Peacehaven or Rye. And some of those smaller parts, unprepared for the influx of those looking for a place to live and commute, simply cannot cope. Once Tory towns, quaint but cheap, having only recently turned Labour, are now at the mercy of a housing market displacing the young in their direction. These districts, with budgets stretched to cover inflated social care costs more than anything else, now have to contend with putting additional people up in hotels at great expense.
These are the places where deprivation over the past six years has risen the most. Toxteth, in Liverpool, meanwhile, has seen the level of deprivation fall. Although it is still in the most 100 deprived wards, it has dropped 10pts for deprivation score and 59 places from 14th to 73rd. The local council and numerous charities have done lots to bring this area back to life, and it’s starting to show.
Although deprivation has on average gone down in Labour constituencies, Britain’s most deprived districts voted Labour at the last election. The top ten per cent most deprived wards on average went for Labour by 45 per cent to Reform on 19 per cent. The Tories were humbled in these parts in 2024, picking up only 16 per cent. By contrast, Britain’s least deprived wards voted 32 per cent Tory, and 26 per cent Labour. The Lib Dems’ own foray into easy and affluent Home Counties England shows up here too, at 21 per cent. But if an election were held today, these scores bear little in common with public feeling on the ground right now.
In the top ten per cent most deprived wards, Labour would fall from 45 per cent to 26 per cent. Reform would surge by more than double its share last year to win (on average) 40 per cent of the vote. The Greens would come third with ten per cent. The least deprived locales in England and Wales, meanwhile, would be split four ways. Reform would eke out a tiny lead with 25 per cent – closely followed by 23 per cent for the Lib Dems, 23 per cent for the Conservatives and 19 per cent for Labour. Notably, the Greens would poll as well in Britain’s least deprived locales as it would the most deprived.
This is the state of the nation in 2025, a Britain where deprivation is not the reserve of the north, but all corners, urban and rural, left-behind seaside resorts and London suburbs well served by a tube network. Policymaking appreciably has focused on the parts of the north most competitive between one party and another. And it seems like it’s going to stay that way to stave off the advancing Faragistas. But to write off Britain’s deprivation debate as a northern and coastal phenomenon is a poor analyst’s fantasy. Britain has got worse over the past six years. Some neighbourhoods, saddled with new-build estates and well-salaried mortgage-payers to boot, are coming to life. But pockets of deprivation are almost everywhere.
[Further reading: Could Labour afford to break its tax pledges]
![]()
Subscribe to The New Statesman today from only £8.99 per month
Content from our partners