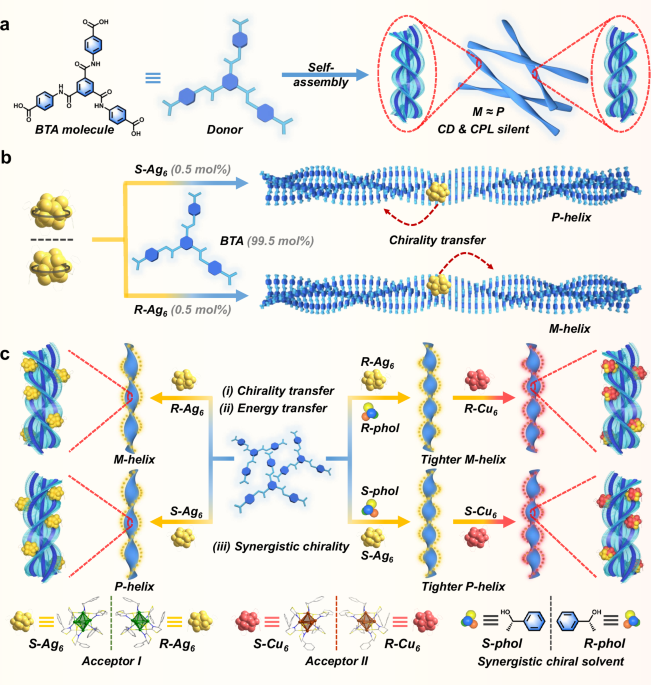
Construction of helical nanoribbons via BTA assemblies with chiral Ag6 and small chiral alcohols in a co-assembly system
Synthesis of BTA molecule: 4,4′,4″-((benzene-1,3,5-tricarbonyl)tris(azanediyl))tribenzoic acid was synthesized by the hydrolysis of triethyl 4,4′,4″-((benzene-1,3,5-tricarbonyl)tris(azanediyl))-tri-benzoate (compound 1, see Supplementary Figs. 1 and 2) and characterized by 1H nuclear magnetic resonance (NMR) spectroscopy (Supplementary Fig. 3). BTA can self-assemble into nanoribbons structure via gel film state in a mixture of DMF and H2O with a volume ratio of 6:4. These nanoribbons are delicate but not perfect because of the presence of almost equal amounts of P- and M-handed helixes (Figs. 1a and 2a), which results in chiroptical-active silent. Upon physical agitation or other stimulations, the BTA motif exhibits supramolecular chirality67,68,69,70,71. However, the helical direction of supramolecular assemblies obtained via the above-mentioned method is random, which leads to considerable confusion for BTA to have a wide range of applications in the chiroptical field. In this work, the BTA self-assembly event proceeded with a pronounced predominant chirality by adding a minor amount of atomically precise S- and R-Ag6 clusters62 as “Sergeant” or chiral seeds to afford P- and M-dominant nanoribbons, respectively (Figs. 1b and 2b, c). Vice versa, R- or S-Ag6 was endowed with supramolecular chirality through embedding and orientation onto the BTA helix templates, as confirmed by transmission electron microscopy (TEM) observations (Fig. 2g, h and Supplementary Fig. 16).
Fig. 2: The formation of helical nanoribbons triggered by chiral seeds of R- or S-Ag6, and the hierarchical evolution of helical nanoribbons with the synergistic effect of R- or S-phol.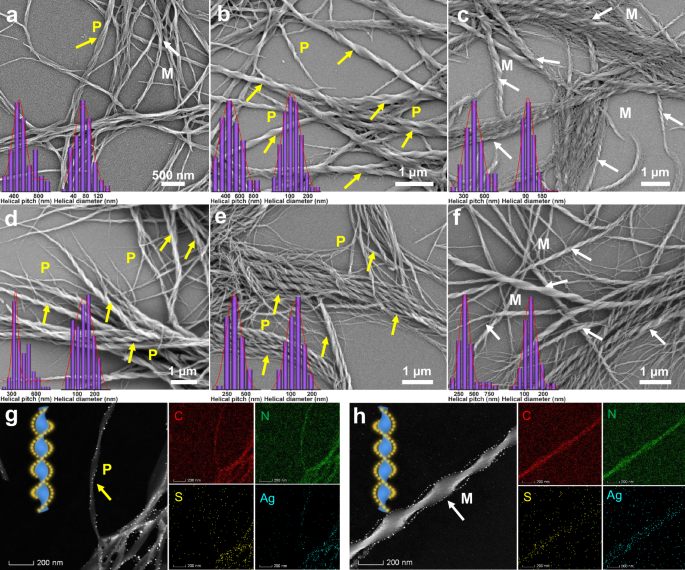
a SEM images of achiral BTA self-assemblies. b SEM images of BTA/S-Ag6 co-assemblies. BTA/S-Ag6 = 100:3. c SEM images of BTA/R-Ag6 co-assemblies. BTA/R-Ag6 = 100:3. d SEM images of BTA/S-phol assemblies. BTA/S-phol = 100:7. e SEM images of BTA/S-phol/S-Ag6 co-assemblies. BTA/S-phol/S-Ag6 = 100:7:3. f SEM images of BTA/R-phol/R-Ag6 co-assemblies. BTA/R-phol/R-Ag6 = 100:7:3. g HAADF images and elemental mappings of BTA/S-phol/S-Ag6 co-assemblies. BTA/S-phol/S-Ag6 = 100:7:10. h HAADF images and elemental mappings of BTA/R-phol/R-Ag6 co-assemblies. BTA/R-phol/R-Ag6 = 100:7:10. Insert of (a–f): Histograms of helical pitch (average values: 482, 464, 436, 348, 341, 346 nm) and helical diameter (average values: 71, 109, 103, 140, 121, 131 nm).
Likewise, small chiral alcohols (R- and S-phol) act as chiral seeds that effectively induce predominant chirality in BTA assemblies. Specifically, BTA can self-assemble into recognizable left-handed helical nanoribbons by R-phol induction and right-handed helical nanoribbons by S-phol induction (Fig. 2d and Supplementary Fig. 4). Therefore, R-Ag6 and R-phol, as well as S-Ag6 and S-phol, exhibit homologous chirality in helical nanoribbon systems, which contribute to the investigation of their synergistic chirality. This perspective was confirmed by scanning electron microscopy (SEM) and TEM observations, which revealed that the BTA/S-phol/S-Ag6 systems assembled into P-handed composite helixes with cluster-directed arrangement, while the BTA/R-phol/R-Ag6 systems assembled into M-handed helixes with cluster-directed arrangement (Figs. 1c and 2g, h). Notably, the BTA/R- or S-phol assemblies possess the smaller helical pitches (348–390 nm) and wider helical diameters (140–178 nm), compared to those of BTA self-assemblies (pitch: 482 nm; diameter: 71 nm) (Fig. 2a, d and Supplementary Fig. 4). More intriguingly, the addition of R- or S-phol to BTA/Ag6 homologous chirality systems, resulted in a reduction in helical pitches (from 436–464 to 341–346 nm) and an increase in helical diameters (from 103–109 to 121–131 nm) relative to the BTA/Ag6 systems (Fig. 2b, c, e, f). These morphological size changes help to improve the chiroptical properties of metal cluster assemblies in excited states. Additionally, the homochiral BTA/phol/Ag6 co-assemblies display higher homogeneity compared to BTA/phol co-assemblies, indicating that the introduction of R/S-Ag6 clusters aids in regulating the dimensions of the co-assemblies.
Emission behaviors of chiral metal cluster-mediated LHSs
Under ambient conditions, BTA assemblies exhibit blue fluorescence with QY of 15.8%, while R/S-Ag6 cluster assemblies from the film of DMF/H2O (6:4, v/v) show bright orange emission with QYs of 11.6% and 10.8%, respectively (Supplementary Table 2). The emission spectra of BTA assemblies correspond well with the excitation spectra of Ag6 clusters (Fig. 3a), facilitating an efficient ET process from the singlet (S) states of BTA assemblies to the S states of Ag6 cluster (Fig. 3e). Therefore, with the increase in the ratios of S-Ag6 clusters in the BTA gel-like assemblies, the emission intensity of S-Ag6 at 573 nm progressively increased, accompanied by the red shift and the decrease in intensity of the BTA emission at 451 nm under the excitation of 330 nm (Supplementary Fig. 5). Concurrently, the emission color changed from blue to yellow-orange (Fig. 3c). These results indicate the successful construction of a mimetic LHSs based on the BTA/Ag6 system. Intriguingly, the light-harvesting process was further validated in the BTA/S-phol/S-Ag6 system through emission titration and decay experiments (Fig. 3b, d). The light-harvesting efficiency (ΦET) value reached 87.8% at 3% S-Ag6 and 96.7% at 20% S-Ag6 for the BTA/S-phol/S-Ag6 system, while the ΦET value of BTA/S-Ag6 system achieved 93.0% at 3% S-Ag6 and 97.9% at 20% S-Ag6, respectively. These results clearly demonstrate that the BTA/S-Ag6 system exhibits consistently higher ΦET than the BTA/S-phol/S-Ag6 system across different amounts of Ag6 clusters (Fig. 3b, Supplementary Fig. 5 and Supplementary Table 1).
Fig. 3: Energy transfer in homochiral BTA/phol/Ag6 LHSs.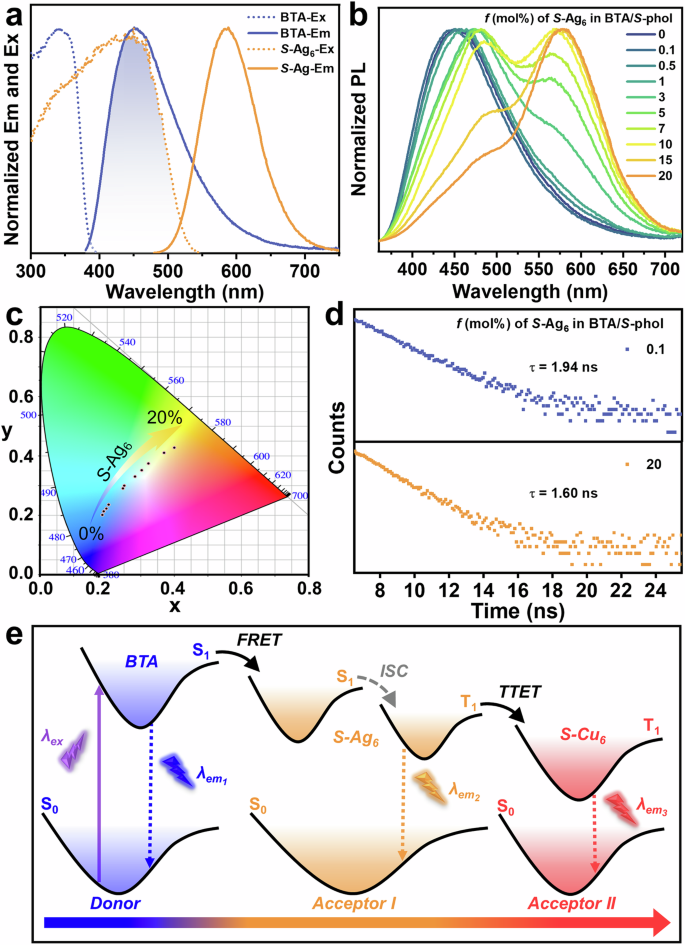
a Normalized excitation and emission spectra of BTA self-assemblies, and normalized excitation and emission spectra of Ag6 clusters. b Normalized PL spectra of BTA/S-phol (100:7) with different molar ratios of S-Ag6 (0%–20%), λex = 330 nm. c CIE chromaticity coordinates changes of (b). d Emission decay profiles of BTA/S-phol (100:7) with 0.1% and 20% molar ratios of S-Ag6 at 451 nm, λex = 330 nm. e Illustration of the FRET and TTET processes in the BTA/S-phol/S-Ag6/S-Cu6 system.
Furthermore, the BTA/S-phol/S-Ag6 system showed a high QY of 31.2% at a 20% molar ratio of S-Ag6, which has a 3-fold increase compared to the Ag6 self-assembly (Supplementary Table 2). This enhancement implies that light loss can be avoided through an efficient ET process to improve the QY of the acceptor. Moreover, upon the addition of S-Ag6 clusters, the emission lifetime of the BTA/S-phol/S-Ag6 system decreased from τ = 2.23 ns67 to τ = 1.94 ns with 0.1% addition, and further to τ = 1.60 ns with 20% addition, measured at 451 nm (Fig. 3d and Supplementary Table 3). These results confirm the occurrence of an efficient light-harvesting process in the BTA/S-phol/S-Ag6 systems.
Chiral hierarchical assembly mechanism of supramolecular co-assembly systems
The fascinating chirality of BTA assemblies triggered by R/S-Ag6 clusters and R/S-phol prompted us to further investigate the hierarchical assembly mechanism of composite helical nanostructures. BTA molecules exhibit strong intermolecular hydrogen bonding, C–H∙∙∙π interactions, and π∙∙∙π hole interactions (Supplementary Fig. 6), enabling their assembly into nanoribbon structure in DMF/H2O system (6:4, v/v) (Fig. 2a). In contrast to the almost no circular dichroism (CD) signals from BTA self-assembled nanoribbons (Supplementary Fig. 7a), the introduction of tiny amounts of chiral seeds R-/S-Ag6 or R-/S-phol displayed a strong mirror-image Cotton effect split peak at 320 nm in the CD spectra of BTA nanoribbons (Supplementary Figs. 8a, 10e and 13e), exhibiting distinct supramolecular helical chirality. Specifically, increasing the amount of chiral Ag6 clusters by only 0.5% in BTA assemblies facilely generated predominant chirality in BTA nanoribbons (Fig. 1b and Supplementary Figs. 10a and 25). The CD spectra of BTA/Ag6 co-assemblies exhibited positive CD signals with R-Ag6 and a negative Cotton effect with S-Ag6 (Supplementary Fig. 10a, c, e). Additionally, left-handed helixes of co-assemblies were obtained with R-Ag6, and right-handed helixes of co-assemblies were formed with S-Ag6, which are consistent with the morphological changes characterized in SEM images (Fig. 2b, c). As the amount of Ag6 cluster increased from 0.5% to 20%, the dissymmetry factors of CD (gabs) of the BTA/Ag6 assemblies reached ~±5.0–7.0 × 10⁻³ (Supplementary Fig. 10 and Supplementary Table 4). In comparison, when R- and S-ligands were used as chiral seeds, the CD spectra of BTA assemblies were investigated. The TEM images reveal that BTA assemblies formed a P and M helix by embedding assembly with S and R-ligand, respectively (Supplementary Fig. 11), but the weaker CD signals were obtained compared with those when S-Ag6 and R-Ag6 were used as chiral seeds in BTA assemblies (Supplementary Fig. 12 and Supplementary Table 5). These results indicate that the exceptional efficacy of the chiral Ag6 clusters as chiral seeds. The possible reasons might be attributed to the formation of helical arrangement of chiral ligands on the Ag6 cluster shell (Supplementary Fig. 38), facilitating the generation of a homochirality field of the helical LHSs. More interestingly, BTA assemblies incorporating R-phol exhibited positive Cotton effect, while those with S-phol exhibited negative Cotton effect (Supplementary Fig. 8), which are consistent with the helical direction of the morphologies observed in SEM images (Fig. 2d and Supplementary Fig. 4). Moreover, the homochiral R-phol and R-Ag6 clusters (S-phol and S-Ag6 clusters) as chiral seeds not only generated elegant helical morphology of BTA assemblies, but also synergistically enhanced the chiroptical signals of BTA/Ag6 systems (Fig. 4g). Expectedly, the introduction of R/S-phol can aid in attaining larger gabs (~±1.4–2.4 × 10⁻²) for BTA/Ag6 co-assemblies, which is mainly attributed to the smaller and tighter pitches of the nanohelixes after the addition of R- or S-phol (Supplementary Fig. 13 and Supplementary Table 6). Interestingly, the 1H NMR spectroscopy was performed to investigate the C–H···π interaction between BTA and Ag6/phol. These observations confirm that chirality transfer from R/S-Ag6 to BTA occurs predominantly through C–H···π interactions, whereas R/S-phol induces a stronger chiral response in BTA via both C–H···π interaction and hydrogen bonding (Supplementary Fig. 14).
Fig. 4: FDCD, PXRD, GIWAXS spectra, and mechanism diagram of the co-assembled system.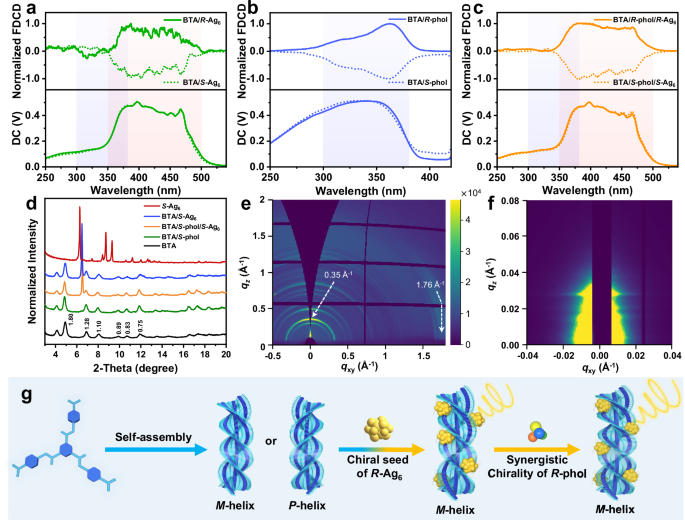
a Normalized FDCD spectra of BTA/R- or S-Ag6 (molar ratio 100:20). b Normalized FDCD spectra of BTA/R- or S-phol (100:7). c Normalized FDCD spectra of BTA/R-phol/R-Ag6 and BTA/S-phol/S-Ag6 (100:7:20). d PXRD patterns of BTA, BTA/S-phol (100:7), BTA/S-phol/S-Ag6 (100:7:0.5), BTA/S-Ag6 (100:0.5), and S-Ag6, d-spacing (unit: nm) corresponding to diffraction peaks. e GIWAXS pattern of BTA self-assemblies. f GISAXS pattern of BTA self-assemblies. g Illustration of the self-assembly process of achiral BTA molecule into homochiral helix mediated by chiral seed of R-Ag6 via chirality transfer, with amplified CPL through the synergistic chirality of R-phol. Note: The blue shadings in (a–c) indicate the signal region for BTA, and the orange shadings indicate the signal region for R/S-Ag6.
In both the BTA/Ag6 and BTA/phol/Ag6 systems, no discernible CD signals originating from Ag6 clusters were observed at longer wavelengths, even when the concentration of Ag6 clusters reached up to 20% (Supplementary Figs. 9 and 10). This is attributed to the macroscopic ordering and pronounced structural anisotropy of BTA-based supramolecular helices, resulting in considerable light scattering during CD measurement, which covers up the CD contribution from the Ag6 clusters. To exclude the effect of self-scattering from the BTA-based assemblies in supramolecular-induced chirality, fluorescence-detected circular dichroism (FDCD) was further employed. As shown in the FDCD spectra in Fig. 4a–c, the BTA/Ag6 and BTA/phol/Ag6 assemblies exhibit clearly characteristic chiral signals of Ag6 clusters in the range of 350–500 nm, while the BTA/phol assemblies display mirror-symmetric characteristic signals of BTA at 300–380 nm. In addition, the BTA self-assemblies have almost no FDCD signals (Supplementary Fig. 7b). These FDCD results indicated that Ag6 clusters acquire supramolecular chirality in the excited state within the BTA/Ag6 and BTA/phol/Ag6 assemblies.
To better comprehend the assembly mechanism of the homochiral BTA/phol/Ag6 systems, the morphological changes in co-assemblies containing different molar ratios of Ag6 clusters were investigated by SEM and TEM. The results indicate that when the molar ratio of Ag6 clusters is below 3%, the homochiral Ag6 clusters bind uniformly to the BTA helical nanoribbons. Additionally, when the molar ratio exceeds 10%, the excess Ag6 clusters get aggregated into nanoparticles that align along the nanohelixes, forming cluster-based composite nanohelixes (Supplementary Figs. 15 and 16). This observation was confirmed by TEM elemental mappings, which clearly reveal the formation of the helically arranged nanoparticles through the aggregation of Ag6 clusters (Fig. 2g, h). Furthermore, SEM images of Ag6 clusters obtained under the same conditions as the control experiment exhibit the presence of large spherical aggregates (Supplementary Fig. 17).
For more detailed elucidation of the assembly mechanism of BTA assemblies with Ag6 cluster, the ultraviolet-visible (UV-Vis) spectroscopy, electrospray ionization-mass spectrometry (ESI-MS), Fourier transform infrared (FT-IR) spectroscopy, and powder X-ray diffraction (PXRD) analyses of these co-assemblies were conducted. The UV-Vis spectra demonstrated that when the molar ratio of Ag6 clusters exceeded 0.5%, both BTA/Ag6 and BTA/phol/Ag6 co-assemblies exhibited distinct absorption bands of Ag6 at 380–500 nm region (Supplementary Fig. 18). In combination with the results of high-resolution mass spectrometry (HRMS) of disassembled Ag6 clusters was consistent with the initial Ag6 clusters, implying that high stability of Ag6 clusters in the co-assembly systems (Supplementary Fig. 19). FT-IR spectra exhibit a vibration band at 1656.3 cm−1, assigned to the carboxyl group, and the peaks at 1596.6 and 1526.5 cm−1, corresponding to the characteristic peaks of amide I and amide II bands, respectively. The shift of the vibration bands to lower wavenumbers suggests the formation of intermolecular hydrogen bonds (Supplementary Fig. 20). Moreover, the S-C vibration bands of Ag6 clusters were clearly observed at 1032.1 cm−1 and 976.5 cm−1 in the cluster-based LHSs (Supplementary Fig. 20i). With the increase in the content of Ag6 clusters, the S-C vibration bands gradually enhanced while those of BTA assemblies remain intact, indicating successful integration of Ag6 clusters into the BTA assemblies. The PXRD pattern of BTA assemblies exhibited a series of regular diffraction peaks at 4.90, 6.91, 8.05, 9.90, 10.67, and 11.84° corresponding to d-spacings of 1.80, 1.28, 1.10, 0.89, 0.83, and 0.75 nm, respectively. These values are in line with a ratio of 1: 1/√2: 1/√3: 1/√4: 1/√5: 1/√6, which indicates the formation of a lamellar structure (Fig. 4d). This result is consistent with the hierarchical assembly of BTA observed in the TEM image (Supplementary Fig. 21). Furthermore, self-assembly mechanism of BTA was investigated by grazing-incidence wide-angle X-ray scattering (GIWAXS), the lamella stacking peak at 0.35 Å–1 appeared out-of-plane, while the π∙∙∙π stacking peak at 1.76 Å–1 was in-plane72 (Fig. 4e and Supplementary Fig. 22a). Correspondingly, the coherence lengths are Dout-of-plane = 19.8 nm and Din-plane = 4.1 nm, calculated using the Scherrer equation73,74 (D = 2πK/Δq, K ~ 0.9, Supplementary Fig. 23a). These results indicate that the vertical expansion of BTA helical nanoribbons occurs primarily along the lamellar stacking direction, whereas their elongation proceeds along the π∙∙∙π stacking direction. This anisotropy aligns with the preferential growth mechanism observed in BTA nanoribbons. Additionally, the grazing-incidence small-angle X-ray scattering (GISAXS) showed a distinct out-of-plane Bragg peak (Fig. 4f). The out-of-plane 1D GISAXS profile of BTA nanoribbons exhibits a peak at qz = 0.029 Å−1 (d-spacing = 21.7 nm), confirming long-range order between nanoribbons along the out-of-plane direction. This well-defined periodicity suggests that strong packing interaction makes for the hierarchical assembly72,75 (Supplementary Fig. 22b). The PXRD pattern of BTA/S-phol co-assemblies was slightly shifted relative to BTA self-assemblies, indicating incorporation of S-phol into the nanoribbons without disrupting the assembled structure of BTA nanoribbons. Similarly, the addition of Ag6 clusters did not disturb the peak pattern of the BTA assemblies but caused a slight shift (Fig. 4d). This implies that some Ag6 clusters were embedded within the BTA assemblies, which promotes efficient ET and chirality transfer from BTA to the Ag6 clusters. Notably, the addition of S-Ag6 clusters led to a new diffraction peak at 6.48° (d = 1.36 nm) in the PXRD pattern of BTA or BTA/S-phol assembly films, suggesting that a portion of Ag6 clusters was deposited on the surface of the BTA helical nanoribbons. This peak arose from the angular shift of the diffraction peak located at 6.29° (d = 1.41 nm), which corresponds to the characteristic (001) crystal plane in S-Ag6. This obvious shift (Δd = −0.05 nm) is primarily attributed to lattice compression induced by the ordered arrangement of Ag6 clusters along the BTA helical nanoribbons (Supplementary Fig. 23b). Moreover, no new diffraction peaks appeared with the increase in the molar ratio of Ag6, indicating that the S-Ag6 clusters adopted a preferred orientation during the co-assembly process (Fig. 4d and Supplementary Fig. 24). Even at the molar ratio of Ag6 up to 20%, the diffraction peaks of BTA assemblies remain intact, implying that BTA/Ag6 and BTA/phol/Ag6 co-assemblies retain stable and well-ordered helical structures (Supplementary Fig. 24e, i). Combined with the TEM analysis, these results reveal that a fraction of the Ag6 clusters were embedded within the BTA helical nanoribbons, while the excess Ag6 clusters were distributed on the surface and even aligned along the helical direction of the nanoribbons.
Synergistic amplification of circularly polarized luminescence
Similar to the CD and FDCD spectra, a small amount of Ag6 (0.5%) was sufficient to trigger the CPL signal of BTA assemblies. The BTA/R-Ag6 co-assemblies showed a left-handed CPL signal at 480 nm (glum = +0.0132), while the BTA/S-Ag6 co-assemblies exhibited a right-handed CPL signal at 480 nm (glum = −0.0139) under 330 nm excitation (Fig. 5a and Supplementary Table 9). The handedness of the CPL signals was consistent with the helical direction of morphologies of BTA/Ag6 co-assemblies (Fig. 2b, c and Supplementary Fig. 25). For comparative analysis, CPL spectra of BTA/R-ligand (or BTA/S-ligand) co-assemblies with R-ligand or S-ligand (0.5%-20%) were studied. The weak and single CPL signal was obtained, and the glum value was only ~±10–3 under the same conditions (Supplementary Fig. 26). This result underscores that the Ag6 cluster with the helical arrangements of chiral peripheral ligands plays an irreplaceable role in inducing helical chirality of BTA assemblies and generates strong CPL. To further verify the stability of R-Ag6 and S-Ag6 clusters as chiral seeds capable of inducing predominant helical chirality in BTA assemblies, the CPL spectra of 10 batches of BTA/Ag6 (100:0.5) assemblies were measured under 330 nm excitation (Supplementary Fig. 27 and Supplementary Table 7). This result manifests that chiral Ag6 clusters as chiral seeds generate predominant helical chirality with high stability in the chiral orientation and large glum value, highlighting their potential as chiral seeds for programmable chirality transfer in supramolecular LHSs.
Fig. 5: CPL spectra of the BTA/Ag6-based co-assembled system.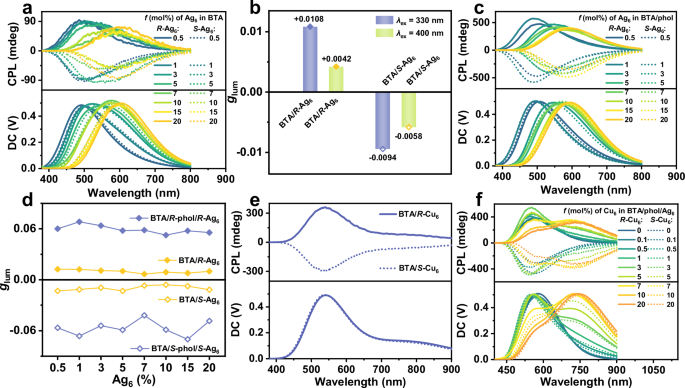
a CPL spectra of BTA with different molar ratios of Ag6 (0.5%–20%), λex = 330 nm. b CPL glum of BTA/Ag6 co-assemblies (molar ratio 100:3) at 600 nm with different excitation wavelengths. c CPL spectra of BTA/phol (100:7, v/v) with different molar ratios of Ag6 (0.5%–20%), λex = 330 nm. d CPL glum values at 600 nm of BTA/Ag6 co-assemblies (molar ratio 100:0.5–100:20) and BTA/phol/Ag6 co-assemblies (molar ratio 100:7:0.5–100:7:20), λex = 330 nm. e CPL spectra of BTA/Cu6 co-assemblies (molar ratio 100:20), λex = 330 nm. f CPL spectra of BTA/phol/Ag6 (molar ratio 100:7:10) with different molar ratios of Cu6 (0.1%–20%), λex = 330 nm.
The solid-state emission spectra of Ag6 clusters at different excitation wavelengths showed that the emission intensity under 330 nm excitation was weaker than that under 400 nm excitation (Supplementary Fig. 28). Furthermore, excitation spectra displayed that BTA could not be effectively excited under 400 nm excitation (Fig. 3a). Therefore, the comparative CPL spectra were conducted under both excitation conditions. When the molar ratio of Ag6 was increased to 1%, the glum value of BTA/R-Ag6 co-assemblies was +0.0081, and that of BTA/S-Ag6 co-assemblies was −0.0079 under 400 nm excitation. However, the glum value of R-Ag6 nanospheres was −0.0014, and that of S-Ag6 nanospheres was +0.0017, which are in the opposite direction of the CPL signals of the BTA/Ag6 co-assemblies (Supplementary Fig. 29).
These results suggest that R-Ag6 or S-Ag6 can not only produce predominant helical chirality in BTA assemblies, but also amplify the glum of Ag6 cluster via imparted supramolecular chirality and ET process. Intriguingly, as the molar ratio of Ag6 increased, the CPL emission peak of the BTA/Ag6 co-assemblies gradually bathochromic-shifted under 330 nm excitation, which implies the occurrence of the CPET process. As expected, when the molar ratio of Ag6 reached 3%, an obvious CPL signal of Ag6 clusters appeared. Under 330 nm excitation, the glum value of the BTA/R-Ag6 co-assemblies was found to be +0.0108 and that of BTA/S-Ag6 was −0.0094 at 600 nm, which were 2.6-fold and 1.6-fold larger than for those excited at 400 nm (for BTA/R-Ag6, the glum was +0.0042; for BTA/S-Ag6, the glum was −0.0058), respectively (Fig. 5b and Supplementary Fig. 30). Subsequently, as Ag6 clusters continue to increase (5%–20%), CPET process was detected by CPL spectroscopy (Fig. 5a, Supplementary Fig. 32, and Supplementary Tables 9 and 10). These data clearly indicate the realization of the CPET handoff and CPL amplification from the BTA assemblies to R-Ag6 (S-Ag6) clusters.
To further enhance the glum of the Ag6 clusters, R/S-phol with strong chirality-inducing ability was introduced to amplify the chiroptical signals of the co-assemblies containing homochiral Ag6 clusters via a synergistic effect. Initially, the chirality induction behavior of BTA assemblies with R-phol or S-phol in the excited state was investigated. Comparative analysis revealed that chiral seeds of Ag6 clusters can induce both blue light CPL of BTA assemblies and yellow light CPL of the Ag6 clusters themselves (Fig. 5a); however, R-phol and S-phol only induce blue light CPL of BTA assemblies. Nevertheless, they can obtain stronger CPL signals at 472 nm under 330 nm excitation (Supplementary Fig. 31a). By increasing the doses of R-phol or S-phol, the glum value of BTA assemblies reached the maximum at a loading of 7%, with values of +0.00622 and −0.0598 at 472 nm, respectively (Supplementary Fig. 31 and Supplementary Table 8). Therefore, 7% doses of R-phol or S-phol were selected to incorporate into the homochiral BTA/Ag6 co-assemblies to enhance the glum value of Ag6 clusters in the following experiment. When the molar ratios of R-Ag6 and S-Ag6 were 3%, the glum values of Ag6 in the BTA/phol/Ag6 co-assemblies reached +0.0637 and −0.0541, respectively, which is 6-fold larger than those of the BTA/Ag6 system and 30-fold larger than those of Ag6 self-assemblies under 330 nm excitation (where glum = +0.0108 for BTA/R-Ag6, −0.0094 for BTA/S-Ag6, −0.0021 for R-Ag6 and +0.0021 for S-Ag6) (Fig. 5a, c, d and Supplementary Fig. 33 and Supplementary Tables 9 and 11). However, the glum values of the BTA/phol/Ag6 co-assemblies under 330 nm excitation were not obviously enhanced compared to those under 400 nm excitation (glum = +0.0648 for BTA/R-phol/R-Ag6, and −0.0535 for BTA/S-phol/S-Ag6). This can be attributed to the strong chiral induction from R/S-phol, which likely masks the CPET process (Fig. 5c, Supplementary Fig. 34 and Supplementary Tables 11 and 12). As a control experiment, CPL spectra of R-phol/R-Ag6 and S-phol/S-Ag6 mixtures were investigated, showing glum values of −0.0021 and +0.0020, respectively (Supplementary Fig. 35), which were not obviously amplified compared to Ag6 self-assemblies. These data demonstrate that using (R-Ag6 and R-phol) or (S-Ag6 and S-phol) as chiral seeds promotes stronger helical chirality in BTA assemblies and synergistically increases the glum value of the co-assembled systems. Combined with the variations in helical diameter and pitch observed across these systems, we propose a potential correlation between helical dimensions and CPL signals: smaller helical pitches and larger helical diameters may enlarge the |glum| value of systems. Furthermore, rotational experiments were performed on the chiral BTA/phol, BTA/Ag6, and BTA/phol/Ag6 systems to rule out contributions from linear polarization; the results demonstrated negligible interference28,76,77 (Supplementary Fig. 36).
To extend the outputs of CPL spectrum, chiral Cu6 clusters were selected because they emit near-infrared phosphorescence with broad absorption in the solid state, and their configuration is similar to that of chiral Ag6 clusters (Supplementary Figs. 37 and 38). R- or S-Cu6 was synthesized according to a similar literature method65. Fortunately, their single crystal suitable for X-ray diffraction analysis was obtained by slow evaporation of a DMF/acetonitrile mixture at room temperature over several days. Their crystal structure (CCDC 2394282 for R-Cu6 and 2394819 for S-Cu6) manifests that the R- or S-ligand is helically arranged around the metal core (Supplementary Fig. 38c, d), which favors them as chiral seeds to generate helical superstructure. Similar to Ag6 clusters, Cu6 clusters as chiral seeds can also trigger helical chirality in BTA assemblies, but cannot be endowed with supramolecular chirality. The FDCD spectra of BTA/Cu6 assemblies exhibited only the characteristic signals of BTA (Supplementary Figs. 39 and 40), and the CPL signal of Cu6 clusters are still weak even at a molar ratio of 20% of Cu6 clusters (Fig. 5e). Fortunately, the emission spectrum of S-Ag6 assemblies overlaps well with the excitation spectrum of S-Cu6 assemblies (Supplementary Fig. 41), facilitating the ET process from triplet (T) states of Ag6 clusters to T states of Cu6 clusters (Fig. 3e). Subsequently, the addition of 10% Ag6 clusters as relay baton to the homochiral BTA/Cu6 co-assemblies resulted in a bright red CPL spectral output (Supplementary Fig. 42). This result indicates the occurrence of a possible TTET process from the homochiral Ag6 to Cu6 clusters, which was confirmed by emission spectra and lifetime decay experiments (Supplementary Figs. 43–45). As the doses of Cu6 clusters increased under 330 nm excitation, the emission intensity at 573 nm gradually weakened and eventually disappeared, while the emission intensity at 750 nm gradually increased. Concurrently, the emission intensity at 451 nm first increased and then decreased once the Cu6 cluster content reached 5% (Supplementary Figs. 43a and 44a). Moreover, the emission intensity at 573 nm gradually disappeared, and that at 750 nm intensified under 400 nm excitation (Supplementary Figs. 43b and 44b). In addition, the QY was measured to be 23.4% and 21.6% at a molar ratio of 20% of R- or S-Cu6 in BTA/phol/Ag6/Cu6 co-assembly systems, corresponding to a 4-fold increase over Cu6 self-assemblies (5.2% for R-Cu6, 5.0% for S-Cu6) (Supplementary Table 2). The emission lifetime of Ag6 clusters at 573 nm in the homochiral BTA/S-phol/S-Ag6/S-Cu6 co-assembly systems gradually decreased (τ = 9.38 μs → 6.32 μs) as the content of S-Cu6 increased from 0.1% to 3%. However, with the further increase in the amount of Cu6 clusters from 5% to 20%, the emission lifetime gradually increased (τ = 9.24 μs → 11.01 μs), approaching the lifetime of Cu6 clusters at 750 nm (Supplementary Fig. 45 and Supplementary Table 13). To further elucidate this phenomenon, ESI-MS was conducted by rapidly mixing Ag6 and Cu6 clusters in their DMF solution. The HRMS results showed that the major frag peaks were [S-Ag2Cu4 + Na]+, m/z = 1658.7025, and [S-Ag3Cu3 + Na]+, m/z = 1703.0250, which suggests that S-Ag6 and S-Cu6 immediately exchange metal ions to form S-AgxCu6−x (x = 1, 2, 3, 4, 5) alloy clusters in DMF solution (Supplementary Figs. 46 and 47). Given the complexity of MS characterization conditions, UV-Vis spectra and 1H NMR spectroscopy were conducted to further confirm the occurrence of rapid kinetic processes in the mixed cluster system (Supplementary Fig. 48). The results confirmed that the addition of Cu6 clusters to the Ag6 cluster-based system led to the formation of AgxCu6−x alloy clusters. With the increase in the amount of Cu6 clusters, the emission color of AgxCu6−x alloy clusters gradually red-shifted from yellow to near-infrared light (Supplementary Fig. 49). These results demonstrate that the ET process of BTA/phol/Ag6/Cu6 co-assembly systems from Ag6 to AgxCu6−x alloy clusters occurred when a tiny amount of Cu6 clusters was added. As the amount of Cu6 clusters further increased, the ET process became subtle. More intriguingly, similar to BTA/Ag6 and BTA/phol/Ag6 systems, the CPL signals of BTA/phol/Ag6/Cu6 quaternary systems were distinctly larger than those of BTA/Ag6/Cu6 ternary systems. With the addition of Cu6 clusters, the CPL peak at 580 nm underwent hypochromatic-shifted and gradually weakened under 330 nm excitation, while the CPL peak at 750 nm gradually enhanced for the BTA/phol/Ag6/Cu6 system. When the molar ratio of Cu6 clusters reached 20%, the |glum| value at 750 nm reached ~0.05, which is 2.5-fold larger than that of BTA/Ag6/Cu6 systems (|glum| = ~0.02) (Fig. 5f and Supplementary Figs. 42 and 50 and Supplementary Tables 14–17). Overall, the utilization of metal cluster (Ag6 and Cu6 clusters) as chiral seeds and Ag6 clusters as relay baton garnered the relayed chirality-controlled LHSs, improving the glum and QY of clusters via efficient ET and CPET processes. Furthermore, the glum of clusters was obviously amplified by the synergistic effect of chiral alcohols, generating a broad CPL emission range from blue to near-infrared light with a high |glum| value of 0.05.
Multilevel CPL information encryption
Recently, information encryption utilizing multi-color CPL materials has shown great potential in the field of chiraloptics25. Metal cluster-based LHSs, which integrate multi-color emission and CPL characteristics, exhibit fantastic encryption features and enable the fabrication of multi-color 3D CPL barcodes. Each barcode consists of four groups of eight bars, corresponding to four sets of standard ASCII characters in binary codes. Upon photoluminescence (PL) and CPL detection, per luminous bar outputs the number “1,” while per non-luminous bar outputs the number “0.” Under 365 nm UV irradiation, the blue-luminous BTA/S-phol bars, cyan-luminous BTA/S-phol/S-Ag6-5% bars, orange-luminous BTA/S-phol/S-Ag6-20% bars, and red-luminous BTA/S-phol/S-Ag6/S-Cu6-20% bars generate CPL signals, wherein the real information is stored in the barcode. Conversely, the luminescent BTA, BTA/rac-Ag6-5%, and BTA/rac-Ag6-20% bars do not exhibit CPL signals, and they are camouflaged within the barcode. When observed under 365 nm UV light, per group of eight bars can be directly converted into an ASCII binary code. By referring to the standard ASCII character table, the fake information “Kium” can be obtained due to the presence of the camouflage luminescent codes. When the luminescent barcode is analyzed via CPL detection and converted into ASCII binary code, the real information “Chem” is accurately retrieved (Fig. 6 and Supplementary Figs. 51 and 52). Under 400 nm UV light, irrespective of reading the luminescent barcode directly or via the CPL barcode, the information obtained is incomplete owing to the non-luminescent BTA and BTA/phol. Such metal cluster-controlled chiral LHSs, with multi-color PL and CPL characteristics along with excitation wavelength responses, hold considerable promise for practical applications in advanced information encryption.
Fig. 6: Potential application of CPL information encryption through a 3D barcode with tunable PL and CPL in BTA/phol/Ag6/AgxCu6−x LHSs.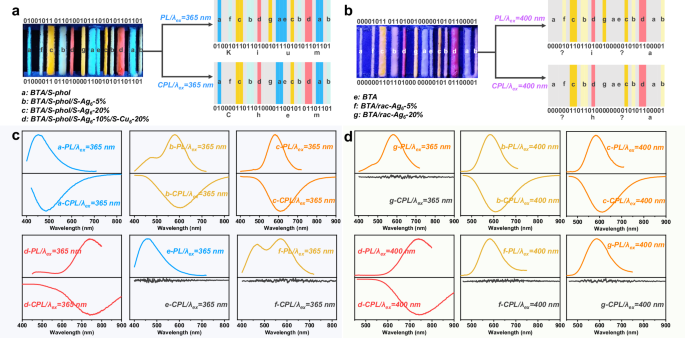
a, b Schematic showing a barcode with standard ASCII characters and encrypted PL and CPL with different wavelengths of UV light (λex = 365 nm/400 nm) for information encryption. c, d Normalized PL and CPL spectra of the bars (a–g) with different wavelengths of UV light (λex = 365 nm/400 nm).