Pseudospin in strained TMDs
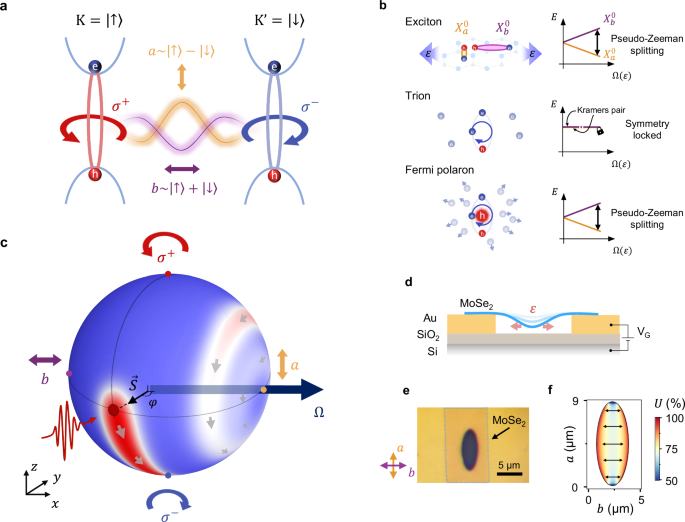
The spatial symmetry of TMDs dictates that a linearly polarized photon in a state \(\alpha \left\vert {\sigma }^{+}\right\rangle+\beta \left\vert {\sigma }^{-}\right\rangle\), with ∣α∣2 = ∣β∣2 = 1/2, creates a coherent superposition of bright excitons with wavefunctions residing in K and K’ valleys, \(\Psi=\alpha \left\vert {X}_{{{{\rm{K}}}}}\right\rangle+\beta \left\vert {X}_{{{{{\rm{K}}}}}^{{\prime} }}\right\rangle\). The spinor χ = (α, β) then determines the pseudospin S in a similar way as the electron spin is defined in quantum mechanics: \({{{\boldsymbol{S}}}}=\left(\,{\mbox{Re}}\,(\alpha {\beta }^{*}),\,\,{\mbox{Im}}\,({\alpha }^{*}\beta ),\,| \alpha {| }^{2}-| \beta {| }^{2}\right)\). The application of mechanical strain breaks the underlying symmetries of TMDs, thereby affecting the pseudospin degree of freedom, see Supplementary Note S11,2. The effect of strain on the exciton’s pseudospin in the limit of zero exciton momentum is described by the following Hamiltonian:
$$H=\left[\begin{array}{cc}\frac{A}{2}\left({\varepsilon }_{xx}+{\varepsilon }_{yy}\right)&\frac{B}{2}\left({\varepsilon }_{xx}-{\varepsilon }_{yy}-2{{{\rm{i}}}}{\varepsilon }_{xy}\right)\\ \frac{B}{2}\left({\varepsilon }_{xx}-{\varepsilon }_{yy}+2{{{\rm{i}}}}{\varepsilon }_{xy}\right)&\frac{A}{2}\left({\varepsilon }_{xx}+{\varepsilon }_{yy}\right)\end{array}\right],$$
(1)
where εxx, εyy, εxy = εyx are the components of the strain tensor, and A, B are material-specific parameters. The diagonal terms describe the well-known energy shift of the excitons under biaxial strain at a rate A ≈ − 100 meV/%30,31,32. It is evident that K and K’ excitons, related by time-reversal symmetry, always remain energetically degenerate. However, the off-diagonal terms suggest that an application of uniaxial (εxx ≠ εyy) or shear (εxy ≠ 0) strain mixes excitons in K and K’ valleys. This effect becomes apparent if we rearrange the Hamiltonian in the form \(H={H}_{0}+\frac{\hslash }{2}\left({{{{\mathbf{\Omega }}}}}\cdot {{{\boldsymbol{\sigma }}}}\right),\) where \({H}_{0}=A\left({\varepsilon }_{xx}+{\varepsilon }_{yy}\right){\sigma }_{0}/2\) is the diagonal part of Eq. (1), Ω = (B/ℏ)(εxx − εyy, 2εxy, 0), σ0 is the identity matrix, and σ = (σx, σy, σz) is the vector of Pauli matrices acting in the pseudospin basis. This Hamiltonian is formally equivalent to that of a spin in a magnetic field, with the vector Ω playing the role of the pseudomagnetic field. We therefore expect the presence of analogs of magnetic phenomena in strained devices.
Generation of pseudomagnetic field and detection of a pseudospin
We induce a strong pseudomagnetic field at cryogenic temperatures using a technique based on tensioning of a suspended monolayer with electrostatic force (Fig. 1d) that we recently developed30. Our approach overcomes the limitations of previous methods that function only at elevated temperatures, leaving pseudomagnetic phenomena largely unexplored33,34. Moreover, our clean samples ensure a long lifetime and low decoherence rate of excitons. We focus on two materials representative of the TMDs family: monolayer MoSe2, chosen for its well-understood and rather simple excitonic spectrum35, and WSe2, selected for its long coherence time of excitons comparable to their lifetime36,37,38,39.
Our device consists of a TMD monolayer suspended over a trench in an Au/SiO2/Si stack (Fig. 1d, e). A gate voltage, VG, applied between the Si substrate and the sample induces an electrostatic pressure and strains the TMD, with the strain distribution defined by the trench geometry (see Note S2 for the calibration of applied strain). For an elliptical trench with major axis a and minor axis b (a ≫ b), a predominantly uniaxial strain is induced along b, which we quantify via the degree of uniaxiality, U = (εbb − εaa)/(εbb + εaa). Specifically, we use an ellipse with a = 8 μm and b = 3 μm, which ensures high uniaxiality U ≈ 80% (Fig. 1f), while maintaining strain uniformity \(\frac{\Delta \varepsilon }{\varepsilon } within the laser spot of ~1 μm (Fig. S1a–c). Conversely, a device with a circular trench experiences uniform biaxial strain (U ≈ 0) in the center of the membrane (Supplementary Fig. S1e–g).
In a prototypical experiment, the uniaxial strain generates a pseudomagnetic field, Ω, along the x-axis in pseudospin space (Fig. 1c). In analogy to the Zeeman effect, we expect the exciton energy to depend on the orientation of its pseudospin S with respect to Ω, being minimal when the two vectors are aligned. To study this effect, we use the fact that the pseudospin orientation on the Bloch sphere determines the polarization of a photon coupled to this pseudospin. Specifically, we access the energy of the states with pseudospin along the equator of the Bloch sphere by recording the linear polarization-resolved photoluminescence (PL) spectra.
In analogy to the Larmor effect, the pseudospin along the y-axis in pseudospin space — that is, excited by light polarized along a direction at 45° with respect to the strain axis — undergoes damped precession around Ω (red cloud in Fig. 1c). Such precession is signaled by the appearance of the pseudospin component Sz, while the damped nature of the precession leads to the development of a pseudospin component aligned with the field, S∥. We experimentally determine the components of pseudospin from polarization-resolved PL spectra as \({S}_{z}=\frac{I({\sigma }^{+})-I({\sigma }^{-})}{I({\sigma }^{+})+I({\sigma }^{-})}\) and \({S}_{\parallel }=\frac{I(a)-I(b)}{I(a)+I(b)}\), where I(σ+) and I(σ−) are the intensities of σ+ or σ− polarized light; I(a) and I(b) are intensities polarized along and perpendicular to the strain axis, respectively40.
We begin by studying an analog of the Zeeman effect to characterize the achievable field strength. Subsequently, we investigate the Larmor effect in this field. The characteristic time scales extracted from these measurements provide insights into the mechanisms of pseudospin polarization loss and strategies to suppress it. We finally develop a counterpart of g-factor measurements to uncover the nature of many-body states.
Zeeman splitting in pseudomagnetic field
Figure 2 a shows the polarization-resolved PL spectra of X0 emission energy in an unstrained MoSe2 (“Methods”). The orange and purple spectra, corresponding to the polarization along the major (a) and minor (b) axes, respectively, show the expected nearly identical emission energy, Ea = Eb. However, a relative energy shift emerges when uniaxial strain is applied (ε = εbb − εaa = 0.4%; Fig. 2b). Indeed, a false-color map of the polarization-resolved PL spectra of the strained sample (left panel in Fig. 2c) reveals a clear sinusoidal dependence of the X0 emission energy on the detection polarization direction. The minimum and maximum of the X0 emission energy correspond to S oriented along and opposite to Ω, respectively (see schematic in Fig. 2c). This strain-induced energy splitting between the two orthogonal polarization directions is, in fact, analogous to the Zeeman effect for pseudospins; hence, we term it pseudo-Zeeman splitting.
Fig. 2: Pseudo-Zeeman effect.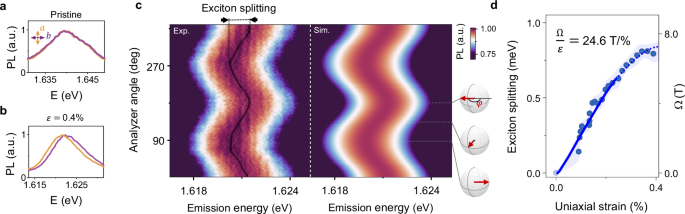
a, b Polarization-resolved PL spectra at near-zero strain (top panel) and under 0.4% uniaxial strain (bottom panel) in the region of neutral exciton X0 in MoSe2. The emission energy of X0 becomes polarization-dependent under strain, with higher energy along the direction of uniaxial strain b (purple) than orthogonal to it (orange). Polarizations of both excitation and detection are linear and co-polarized. c Normalized PL spectra for the same device as a function of the analyzer angle at 0.4% strain, along with the simulations (circles mark the extracted peak position). Note, that the angle φ between the probed pseudospin S and Ω is twice the angle between the polarizer (analyzer) axis and the strain direction b (side panel). d The energy splitting between the excitons with pseudospin aligned along or opposite to the pseudomagnetic field, interpreted as pseudo-Zeeman splitting, extracted from (c). The shaded area represents the uncertainty.
To quantify the established pseudo-Zeeman effect, we fit the data in Fig. 2c using \(E(\varphi )={E}_{0}+(\hslash \Omega /2)\cos \varphi\), where the term E0 = A(εxx + εyy)/2 describes the strain-induced redshift in X0 energy compared to the unstrained state (see Eq. 1) and φ is the angle between the exciton pseudospin and pseudomagnetic field. The extracted pseudomagnetic field grows linearly at small strain level (B = 24.6 ± 2.5 T/% in MoSe2 (solid line in Fig. 2d) and 16.1 ± 1.8 T/% in WSe2 (Supplementary Fig. S2) corresponding to 2.9 ± 0.3 meV and 1.9 ± 0.2 meV, respectively. Following an established convention7,41,42, we used the free-electron gyromagnetic g-factor g = 2 (corresponding to 2μB = 0.116 meV/T, with μB being the Bohr magneton) to convert the measured splitting into an equivalent pseudomagnetic field in Tesla solely for easier comparison with conventional magnetic effects. To emphasize the difference between pseudomagnetic and real magnetic fields, we also provide the exciton splitting corresponding to the field in units of energy, whenever appropriate. At higher strain level, the apparent dependence of exciton splitting becomes sublinear (Supplementary Fig. S3), which we attribute to a reduced intensity of the higher energy pseudo-Zeeman-split state when the energy separation exceeds the thermal energy (kBT ≈ 1 meV). The model based on this mechanism closely aligns with the observed behavior of X0 (simulation in Fig. 2c, Supplementary Note S7) and the extracted splitting (dotted line in Fig. 2d). In addition, the splitting is close to the expected value in the optical reflectivity measurements (Supplementary Fig. S4). Therefore, in the following, we assume a linear dependence of Ω on strain, with Ω reaching 43 ± 6 T (5.0 ± 0.7 meV) in MoSe2 at our highest applied strain of 1.6% (Fig. S3). Finally, we note that the pseudo-Zeeman effect is absent in biaxially strained devices (Ω = 0), an experimental situation realized in circular trenches (Supplementary Fig. S5). This finding further confirms that the observed behavior in Fig. 2 results from the pseudospin Zeeman effect and rules out artifacts related to, e.g., spurious plasmonic effects, biaxial strain, etc.
Strain control of pseudospin dynamics
Our next objective is to gain control over pseudospin dynamics; to this end, we explore the pseudospin analog of Larmor precession and quantify the characteristic pseudospin relaxation times. A hallmark of Larmor precession is the emergence of circularly polarized PL emission under linearly polarized excitation (Fig. 3a). Figure 3b shows circular polarization-resolved PL spectra of WSe2 at Ω = 8 T (0.9 meV) corresponding to ε = 0.5%. Under the strain-induced pseudomagnetic field, a prominent asymmetry between the I(σ+) and I(σ−) intensities at the X0 emission energy (red and blue, respectively) emerges, whose sign depends on the excitation polarization direction (Supplementary Figs. S6 and S7). This observation is striking, as a circularly polarized emission under linear excitation can only be caused by the breaking of either time-reversal or spatial symmetries. Since the magnetic field is absent in our experiments and the asymmetry is detected only when a pseudomagnetic field is induced (Supplementary Fig. S8), we conclude that the pseudomagnetic field alone is responsible for the observed Larmor-like effect.
Fig. 3: Pseudo-Larmor effect.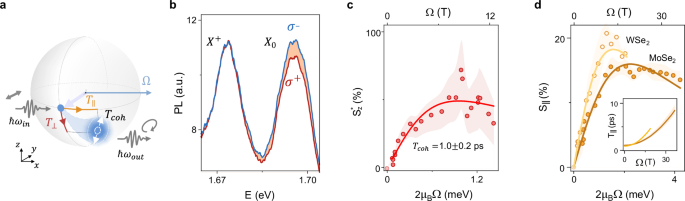
a Schematics of the expected Larmor-like dynamics of pseudospin in a pseudomagnetic field. b Circular-polarization-resolved PL spectra of WSe2 under 8 T (0.9 meV) pseudomagnetic field, excited by linearly polarized light. The rotation of the exciton’s pseudospin is manifested as an asymmetry between σ− and σ+ emission of the neutral exciton (X0). c The \({S}_{z}^{*}\) component of the pseudospin vs. the pseudomagnetic field strength in WSe2 (red points) and fit to the model Eq. (2) (red line), top and bottom x-axes are the pseudomagnetic field strength and the corresponding excitonic splitting, respectively. The shadow represents uncertainty. d The component of the pseudospin along the field, S∥, vs. field strength in MoSe2 and WSe2 and fit to our theoretical model Eq. (2). Inset: the dependence of T∥ on the pseudomagnetic field strength in MoSe2 and WSe2 (dark and bright orange lines, respectively).
To gain insight into the mechanism of pseudospin dynamics and relaxation, we develop a theory of pseudo-Larmor precession. The full model is provided in Supplementary Note S1, we illustrate the concept here with an example based on the Bloch equation for population-averaged pseudospin dynamics
$$\frac{\partial {{{\boldsymbol{S}}}}}{\partial t}+\frac{{{{\boldsymbol{S}}}}}{\tau }+{{{{\boldsymbol{S}}}}}_{\perp }\times {{{\mathbf{\Omega }}}}+\frac{{{{{\boldsymbol{S}}}}}_{\perp }}{{T}_{coh}}+\frac{{{{{\boldsymbol{S}}}}}_{\parallel }-{{{{\boldsymbol{S}}}}}_{0}}{{T}_{\parallel }}={{{\boldsymbol{G}}}},$$
(2)
where G is the pseudospin generation rate defined by the excitation intensity and polarization, S0 describes the quasi-equilibrium (thermal) pseudospin induced by the pseudomagnetic field (Fig. 3a). The characteristic times are: exciton lifetime (τ ≈ 2 ps)37,38,43,44,45,46,47,48, period of Larmor precession (T⊥ = 2π/Ω), Tcoh is the coherence time that determines relaxation of the pseudospin components transverse to the field, and T∥ characterizes the time over which thermal equilibrium between the split sublevels is established (for the relation of Eq. (2) to the microscopic model, see Supplementary Notes S1, S3, and S4). The microscopic model accounts for the exciton longitudinal-transverse splitting caused by the electron-hole exchange interaction. This splitting induces an effective wavevector-dependent pseudomagnetic field ΩLT, which is present even in an unstrained monolayer and leads to the loss of pseudospin coherence by the Dyakonov-Perel mechanism18,49. A strain-induced pseudomagnetic field suppresses ΩLT-induced depolarization, which significantly increases both Tcoh and T∥ (Supplementary Note S3). Our goal is to experimentally determine these two timescales that define pseudospin dynamics yet remain unknown.
In a simple case of unitary excitation along the y pseudospin axis, Gτ⊥ = (0, 1, 0), the steady-state solution of Eq. (2) is \({S}_{z}={\tau }_{\perp }\Omega /\left[1+{\left({\tau }_{\perp }\Omega \right)}^{2}\right]\), where 1/τ⊥ = 1/Tcoh + 1/τ, note that Ω in this equation has units of rad/s (Supplementary Note S1). Intuitively, ensemble averaged Sz probed by PL grows linearly with Ω when the average rotation angle for pseudospins during their lifetime is small, τ⊥Ω ≪ 1. At higher field strengths, the pseudospin undergoes multiple rotations around the Bloch sphere during the exciton lifetime, reducing the average pseudospin polarization similar to the Hanle effect in real magnetic fields. To experimentally realize the scenario of unitary excitation, we consider the reduced pseudospin \({S}_{z}^{*}(\Omega )\), normalized to the measured generation rate at the corresponding field G(Ω) (Supplementary Note S3).
Figure 3c shows the experimentally obtained dependence of \({S}_{z}^*\) on the pseudomagnetic field in WSe2, along with a fit using the solution of Eq. (2). This fit yields Tcoh = τ⊥τ/(τ − τ⊥) = 1.0 ± 0.2 ps in the regime of high field strength, which is longer than the coherence time measured in the unstrained samples (Tcoh ~ 0.5 ps37,38) due to the influence of the pseudomagnetic field (Supplementary Note S3). Finally, the large pseudospin polarization, \({S}_{z}^{*}=50\%\), demonstrates the strong potential of the pseudomagnetic field for manipulating the exciton pseudospin.
To determine T∥, we examine Eq. (2) under unpolarized excitation conditions, which are experimentally realized at high detuning of the excitation energy from the X0 resonance so that all induced polarization is lost. In this case, G → 0 and only field-induced S appears in the form \({S}_{\parallel }=\tau /(\tau+{T}_{\parallel })\times \tanh \left[\hslash \Omega /(2{k}_{B}T)\right]\) (Supplementary Note S1).
This expression suggests that the initially unpolarized pseudospins tend to align along Ω, acquiring a pseudospin polarization within a thermal distribution. The induced polarization saturates when the pseudo-Zeeman splitting exceeds the thermal energy (kBT ≈ 1 meV), with its maximum value determined by the ratio of the relaxation time T∥ to the lifetime τ.
The experimentally observed S∥vs.Ω (Fig. 3d) matches these expectations. At low field strengths (Ω S∥. At higher fields, the polarization reaches the expected plateau, \({S}_{\parallel }\left(\hslash \Omega \gg {k}_{B}T\right)=\tau /(\tau+{T}_{\parallel })\). From the value of S∥ ≈ 20% at the plateau in both MoSe2 and WSe2, we find the pseudospin relaxation time T∥ ~ 10 ps (Supplementary Note S3), significantly longer than the exciton coherence Tcoh ~ 0.5 ps and lifetime τ ≈ 2 ps in these samples50,51. This slowdown of the relaxation time arises because the pseudomagnetic field suppresses pseudospin decay dominated by ΩLT (see Supplementary Note S3). Using a model that accounts for this effect (Supplementary Note S1), we fit S∥ and find that the relaxation time increases from 1 to 8 ps over the studied range of field strengths (inset in Fig. 3d). Furthermore, this analysis allows us to extract the field responsible for loss of pseudospin coherence, yielding the root-mean-square values \({\Omega }_{{{\mbox{WSe}}}_{2}}^{{\mbox{LT}}\,}=10.4\pm 1.3\) T (1.2 meV) in WSe2 and \({\Omega }_{{{\mbox{MoSe}}}_{2}}^{{\mbox{LT}}\,}=12.0\pm 1.1\) T (1.4 meV) in MoSe2 in reasonable agreement with the model predictions (Supplementary Note S4). To the best of our knowledge, this constitutes the first measurement of this fundamental parameter.
Many-body states under pseudomagnetic field
Our ultimate goal is to investigate complex many-body states beyond neutral excitons under the pseudomagnetic field and to showcase the unique capacity of our technique to reveal their intrinsic structure. Two critical aspects remain experimentally unexplored. First, recent theoretical studies have suggested that trions and FPs show contrasting behaviors under a pseudomagnetic field due to the distinct response to time-reversal symmetry21,22. That suggests a possibility of a g-factor-like measurement to distinguish the two descriptions of charged excitons. We define the pseudomagnetic g-factor (gp) as \(\Delta E=\frac{{g}_{p}}{2}\hslash \Omega\), where ΔE is pseudo-Zeeman splitting, with gp = 0 signifying a trion and gp ≠ 0 indicating a Fermi polaron nature of the charged exciton. Second, since the nature of trions and FPs are strongly affected by the density of charge carriers (Fig. 1b), the magnitude of gp is expected to depend on the Fermi energy (EF). Specifically, gp can be expressed as gp(EF) = 2ΔEFP(EF)/ΔEX, where ΔEX = ℏΩ, and \(\Delta {E}_{{{{\rm{FP}}}}}=\frac{{g}_{p}({E}_{F})}{2}\hslash \Omega\). In our devices, an applied gate voltage varies the Fermi energy together with strain, enabling measurement of the pseudomagnetic g-factor.
To test these predictions, we probed the response of charged excitons in MoSe2 and WSe2 under an applied pseudomagnetic field (Fig. 4a–c). We used the same experimental configuration and analysis as in the study of the pseudo-Zeeman effect of neutral excitons. Figure 4a shows the pseudomagnetic-field-induced energy splitting of the negatively charged excitons (X−) in doped MoSe2 (ne > 1 × 1012 cm−2) with pseudospins aligned along and opposite to the pseudomagnetic field. The observed finite energy splitting for X− is similar to what was seen previously for neutral excitons (Fig. 2d), although with a much lower magnitude (Fig. 4b). The observation of pseudo-Zeeman splitting of the X− state provides conclusive evidence of their Fermi polaron nature and establishes their bosonic statistics.
Fig. 4: Charged excitons under pseudomagnetic field.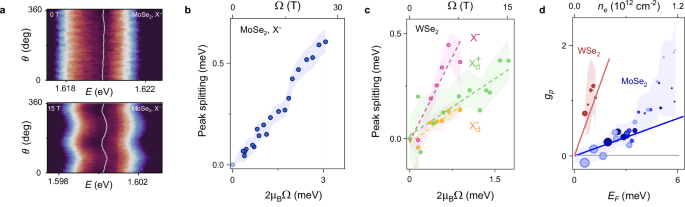
a False-color map of polarization-resolved PL of the charged exciton (X−) in monolayer MoSe2. Under a strain-induced pseudomagnetic field, a prominent pseudo Zeeman splitting appears. b Splitting of the negatively charged exciton as a function of pseudomagnetic field strength in doped MoSe2. The observed splitting is consistent with the polaronic character of the charged exciton. c Peak splitting of bright (X−) and dark (\({{{{\rm{X}}}}}_{d}^{+}\), \({{{{\rm{X}}}}}_{d}^{-}\)) charged excitons in WSe2 as a function of pseudomagnetic field strength. d The dependence of pseudospin g-factor gp of bright FP on Fermi energy in WSe2 (red points) and MoSe2 (blue points), alongside theoretical predictions21 (red and blue solid lines, respectively). The size of each point is proportional to strain, and color shades mark different experimental runs with different initial carrier densities.
In contrast to MoSe2, WSe2 hosts a plethora of additional many-body states (Supplementary Fig. S2), including positively and negatively charged bright excitons (X+ and X−), neutral and charged dark excitons (Xd, \({\,{\mbox{X}}\,}_{d}^{+}\), and \({\,{\mbox{X}}\,}_{d}^{-}\)), biexcitons (XX), and phonon replicas (Xp)52,53. We observe a considerable strain-dependent energy splitting of X−, \({\,{\mbox{X}}\,}_{d}^{+}\), and \({\,{\mbox{X}}\,}_{d}^{-}\) in that material (Fig. 4c), which confirms their Fermi polaronic nature. The dark species demonstrate lower splitting and an overall lower pseudomagnetic g-factor, \({g}_{p}({\,{\mbox{X}}\,}_{d}^{+/-})\approx 0.8\), compared to the bright ones, gp(X−) ≈ 2.0 for the same doping level. We note that the low intensity of biexcitons and phonon replicas prevents us from extracting their splitting, while X+ is only visible at low pseudomagnetic fields (Supplementary Fig. S2).
Finally, we use the pseudomagnetic g-factor to explore the effect of Fermi energy (charge density) on the character of charged excitons. The pseudomagnetic g-factor of FPs vs. Fermi energy is plotted in Fig. 4d; the size of each point is proportional to the uniaxial strain (see Supplementary Note S5 for Fermi energy estimation). We find that for low Fermi energy, gp is nearly zero despite a large pseudomagnetic field, which is consistent with the convergence of Fermi polaronic and trionic pictures in this regime. Meanwhile, at a larger EF, the splitting of the charged exciton approaches that of a neutral exciton. This behavior is expected, as the attractive Fermi polaron splitting inherits the neutral exciton splitting and saturates at this value. Indeed, theory predicts21 that the attractive polaron g-factor depends linearly on Fermi energy EF (Supplementary Note S6). Moreover, the predicted value of gp for charged excitons in WSe2 (red line in Fig. 4d) is higher than that in MoSe2 (blue line in Fig. 4d) for the same doping level, due to the mixing of the intervalley and intravalley states21. A close match between the experimental results and theoretical predictions further supports the tuning of FP character by induced charge density. Overall, our results establish the pseudo-Zeeman splitting as a tool to assess the symmetry and statistics of excitonic states.