
Elevated wage growth has proven stickier in the UK than in other advanced economies, despite the rise in the unemployment rate in absolute terms and relative to the euro area. One interpretation is that the UK’s equilibrium level of unemployment (NAIRU) has increased, which would have persistent inflationary effects – a view emphasised by several members of the Bank of England’s Monetary Policy Committee, including Huw Pill, and as discussed in Box F of the November 2025 Monetary Policy Report.
A complementary reason is that Brexit has reduced the flexibility of the UK labour supply. Distinguishing between these channels matters: over-relying on a NAIRU-based narrative could lead to unduly restrictive monetary policy in a high-unemployment environment. This issue is particularly timely given the recent upward trend in the UK unemployment rate and weak labour market surveys.
Differentiating between labour market structural changes
It is plausible that the UK’s NAIRU has increased relative to the pre-pandemic period. Potential factors include reduced matching efficiency and a sharp increase in the minimum wage combined with higher payroll taxes, which most likely strengthened real-wage resistance, as pointed out by the Bank of England and Pill. A higher NAIRU implies an outward shift in the wage Phillips curve and, all else equal, a higher policy rate for any given unemployment rate (Figure 1A).
At the same time, it is plausible that Brexit has steepened the UK’s Phillips curve by severing the country’s frictionless link to the European Union’s 200m labour market. A steeper Phillips curve implies more volatile wage growth – higher when the labour market is tight, but lower once unemployment rises above NAIRU (Figure 1B).
Ignoring the possibility of a steeper Phillips curve does not necessarily result in material policy miscalibration when unemployment is low. But once the unemployment rate rises above equilibrium, relying solely on a higher NAIRU can lead to costly policy missteps, in particular, a tighter monetary stance than the underlying wage-setting process would warrant.
Figure 1A. A rise in NAIRU in isolation causes higher wage growth for any given unemployment rate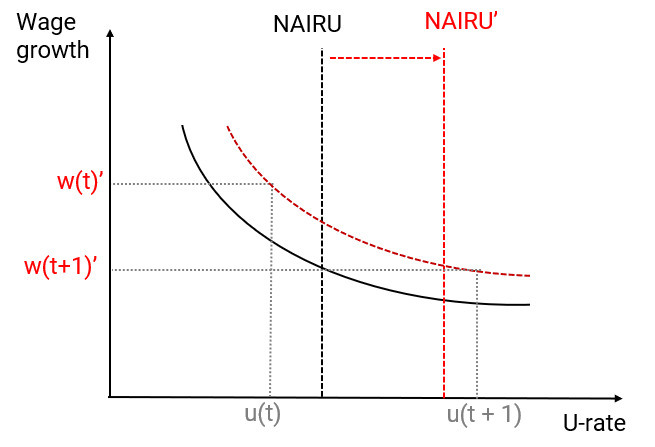
Note: A parallel shift due to a higher NAIRU (red vertical line) results in higher wage growth at every unemployment rate.
Figure 1B. While a steeper Phillips curve leads to more volatile wage growth
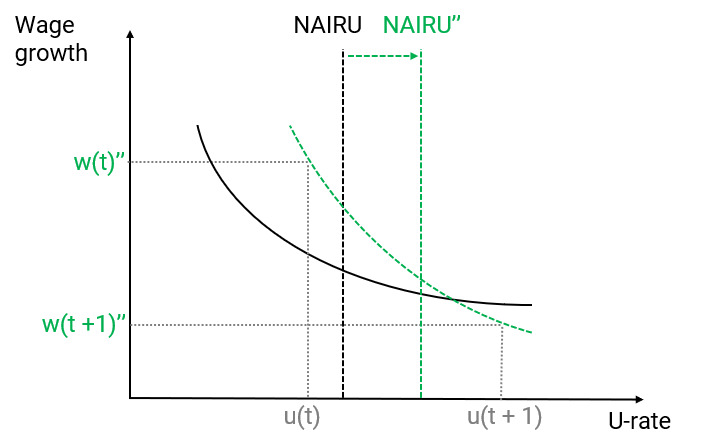
Note: The post-pandemic Phillips curve becomes steeper (green dashed curve) while the NAIRU still increases (green vertical line). A steeper curve implies higher wage growth when unemployment is low, but lower wage growth when unemployment rises above NAIRU, leading to more volatile wage dynamics.
Source: Element Capital
Brexit has most likely reduced the flexibility of the UK’s labour-market supply
There is widespread evidence that frictionless access to a large labour market increases supply flexibility. Moreover, EU immigrants have historically increased the flexibility of the UK labour supply given their responsiveness to economic conditions and their concentration in highly cyclical sectors.
At the EU level, demographic studies by the European Commission and Klaus Müller of the European Parliament Research Service emphasise that intra-EU labour mobility operates under minimal regulatory barriers and is therefore better able to adjust to shocks. One study by Julia Jauer, Thomas Liebig, John Martin and Patrick Puhani found that the 2004–07 EU enlargements enhanced labour-market adjustment capacity. Likewise, a study by David McCollum and Allan Findlay concluded that the ready availability of migrants following EU enlargement supported flexible labour-market structures.
A 2017 study by Heather Rolfe found that EU migrants have met employers’ needs for a flexible labour force in hospitality, catering and construction. Similarly, a study by Katrin Forster-van-Aerssen and Tajda Spital published in the European Central Bank’s Economic Bulletin showed that the end of free movement has structurally reduced two-way labour mobility between the UK and the EU.
In contrast, extra-EU migration is constrained by quotas, skill thresholds, administrative frictions and non-economic motives, limiting its responsiveness to macro shocks. Indeed, EU immigration responded more flexibly during the 2008 financial crisis than non-EU migration (Figure 2A). More generally, before the Brexit referendum, EU immigration was significantly more responsive to UK economic conditions (Figure 2B).
Figure 2A. EU migrants responded more strongly to the 2008 financial crisis than non-EU migrants
Migrants inflow rolling annual sum, thousands of persons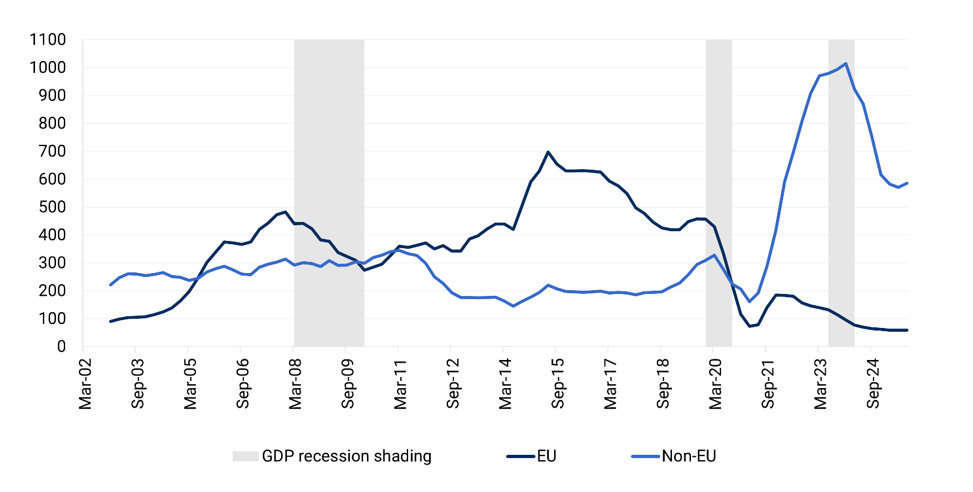
Note: Rolling annual national insurance number registrations for EU and non-EU nationals, NSA. NINo registrations cover adult overseas nationals entering work in the UK and may not reflect the stock of non-UK workers. Shaded areas denote UK recessions.
Figure 2B. EU migrants’ inflows significantly correlated with economic conditions pre-Brexit
Correlation coefficient, Q1 2003-Q2 2016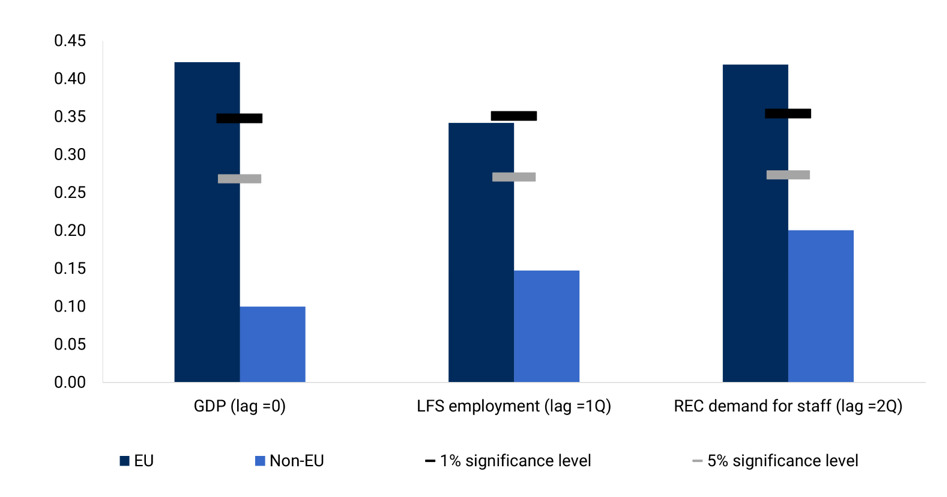
Note: Bars show Pearson correlation coefficients between growth in EU and non-EU NINo registrations and: (i) GDP growth; (ii) LFS total employment growth; and (iii) REC survey demand for staff. Horizontal lines indicate the correlation thresholds required to reject the null hypothesis of zero correlation at the 1% (black) and 5% (grey) significance levels.
Source: Element Capital
A less flexible supply leads to a steeper Phillips curve
The previous section shows that Brexit has most likely reduced the flexibility of UK labour supply. It is well established in the literature that lower labour-supply elasticity steepens the Phillips curve. This mechanism appears in Olivier Blanchard and Lawrence Katz’s work and Jordi Galí’s, among others. Empirically, Sanuel Bentolila, Juan Dolado and Juan Jimeno show that immigration flattened the Phillips curve in Spain, implying that reduced mobility has the opposite effect.
Taken together, the theoretical and empirical evidence suggests that Brexit has plausibly contributed to a steeper UK wage Phillips curve.
The policy cost of an unbalanced approach
UK wage growth has exceeded what standard augmented Phillips-curve relationships estimated on pre-pandemic data would predict. There are both cyclical and structural reasons for this.
Cyclical factors include wider sectoral mismatches, a rise in inactivity and a sharp reduction in EU immigration, which constrained labour supply in several service sectors. As vacancies surged, firms prioritised staff retention. In addition, the real-wage catch-up following the inflation shock was supported by expansionary fiscal policy. Finally, a nearly 30% cumulative increase in the minimum wage between 2023 and 2025 boosted wages in the lower part of the distribution.
Our objective is not to provide an exhaustive modelling of the above factors. Rather, we conduct a simple calibration focusing on the structural changes most relevant for monetary policy: a higher NAIRU and a steeper Phillips curve. These are the mechanisms most likely to exert persistent effects. That said, we also account for the rise in inflation expectations and adjust for the minimum-wage spike.
First, we invert a Phillips curve estimated over the pre-pandemic period and let the short-term NAIRU absorb the gap between predicted and actual wage growth. Our specification includes unemployment, productivity and inflation expectations.
The results are shown by the blue line in Figure 3A. Because this step abstracts from many cyclical factors listed above, it can be interpreted as an upper bound on the ‘true’ post-pandemic NAIRU.
Second, we show that even a mild steepening of the unemployment gap coefficient materially affects the implied NAIRU. We adjust the unemployment-gap coefficient from -0.72 to -0.89 by taking the steeper end of its 95% confidence interval. This is a deliberately modest adjustment, as confirmed by recent empirical evidence. In a 2023 Vox column, Jennifer Castle and David Hendry estimate a slope of -0.84, with a 0.11 standard error. Other work suggests stronger effects: the European Commission (forthcoming) reports a wide -0.2 to -1.6 range of wage-curve slopes across European countries, with the UK at -1.18.
Even this modest steepening has meaningful consequences. The NAIRU required to reconcile the 2023 and 2024 wage dynamics falls by about 0.8 and 0.7 percentage points, respectively (Figure 3B).
Figure 3A. Implied short-term NAIRU explaining out-of-sample wage dynamics
Short-term NAIRU four-quarter rolling average, %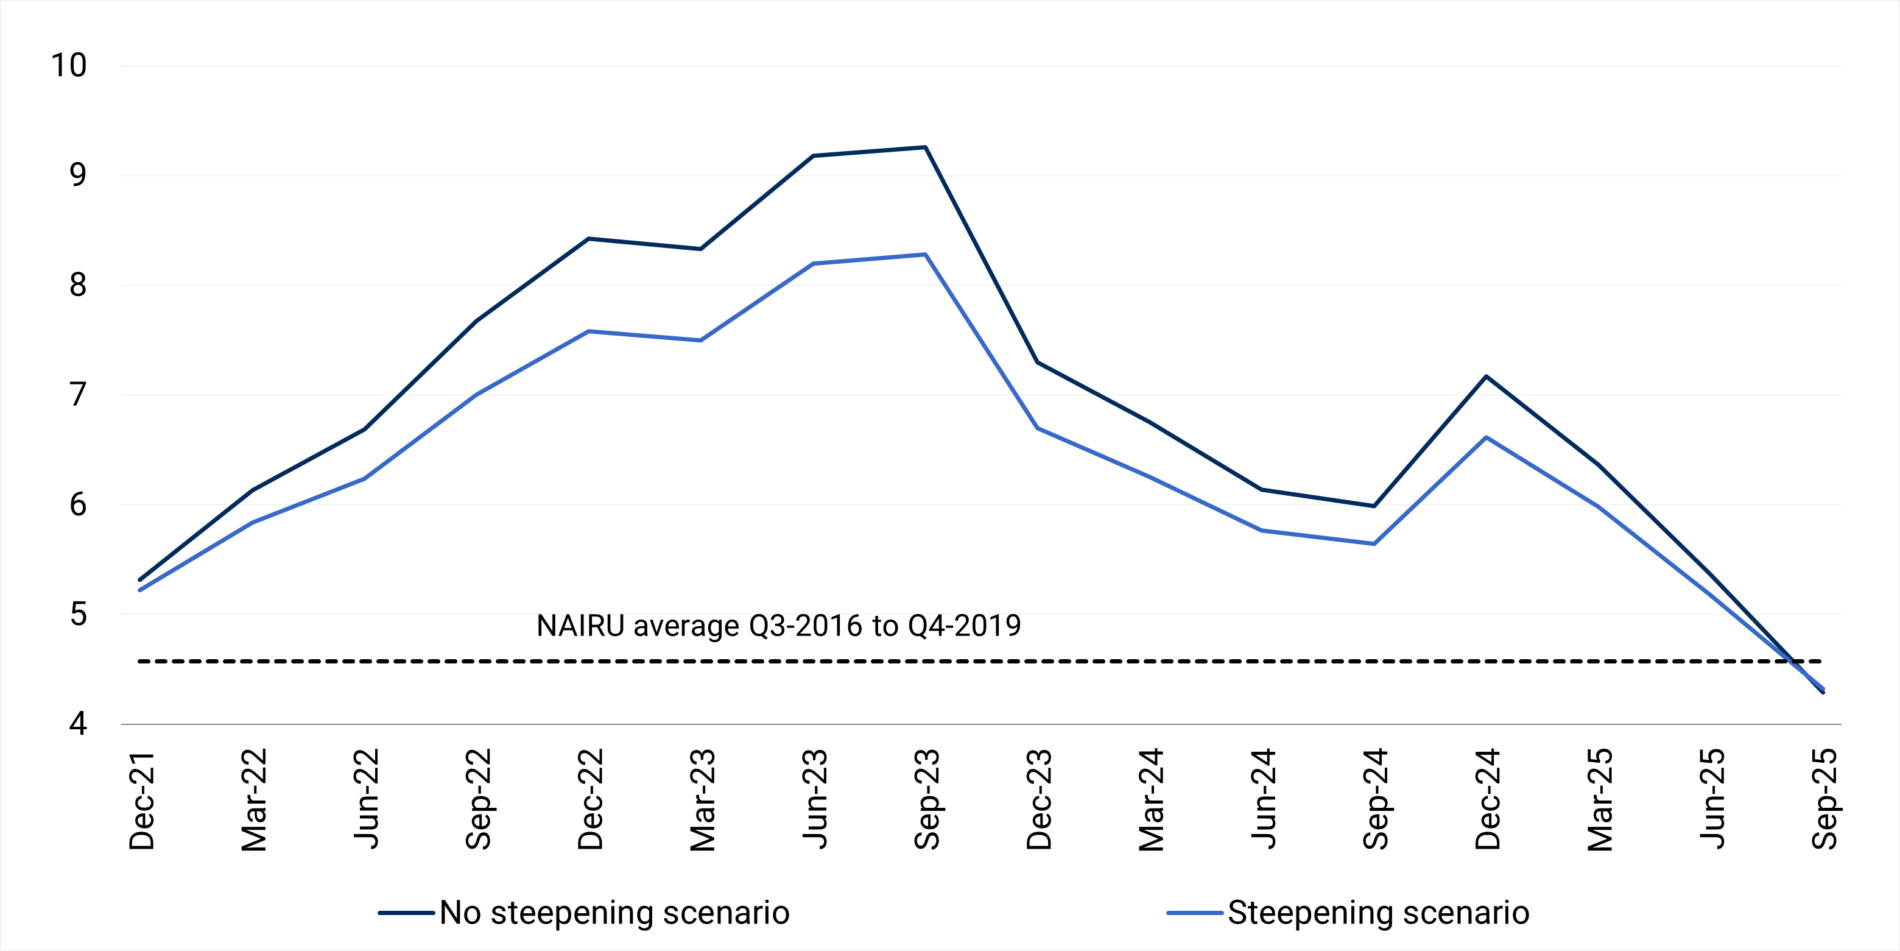
Note: The short-term NAIRU required to explain out-of-sample wage dynamics is obtained by inverting a Phillips curve estimated on pre-pandemic data (Q1-1998 to Q4-2019). The independent variables are the first lag of the unemployment gap, productivity growth and survey-based inflation expectations. The dashed line shows the NAIRU level needed to explain in-sample wage dynamics.
Figure 3B. Reduction in NAIRU after allowing for a steeper Phillips curve
Short-term NAIRU – delta, percentage points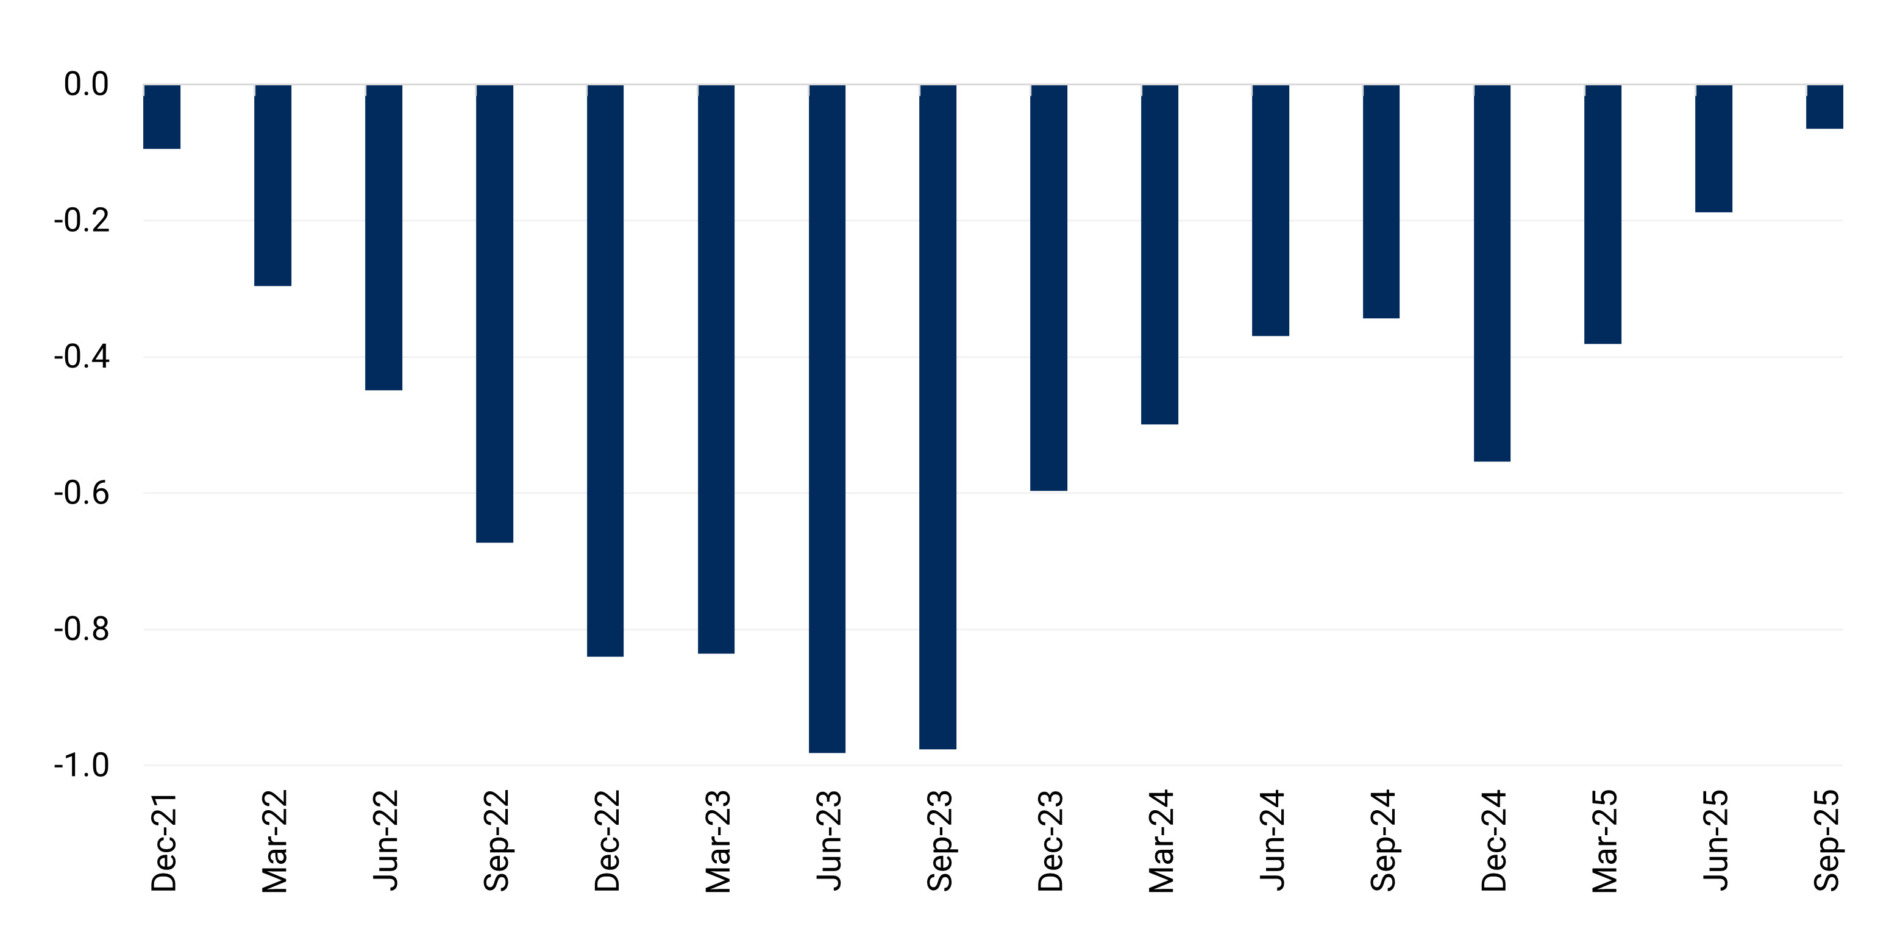
Note: This scenario illustrates how a steeper Phillips curve meaningfully lowers the NAIRU needed to fit observed wage dynamics. It is also plausible that the post-pandemic inflation spike caused an increase in the sensitivity of wage growth to inflation expectations. That would further reduce the rise in the NAIRU required to rationalise post-pandemic wage behaviour.
Source: Element Capital
In the latter part of our sample, the NAIRU gap in Figure 3 narrows as quarterly wage growth – our dependent variable – has slowed markedly. While year-on-year private-sector pay growth stood at 4.2% in September 2025, still above a target-consistent pace, the annualised 3m/3m rate has decelerated to 2.7% (Figure 4). The latter is a volatile series, which should be interpreted with caution; still the deceleration is noticeable and consistent with the rise in labour market slack.
Figure 4. Tentative but material deceleration in wage growth
3m/3m %, annualised, seasonally adjusted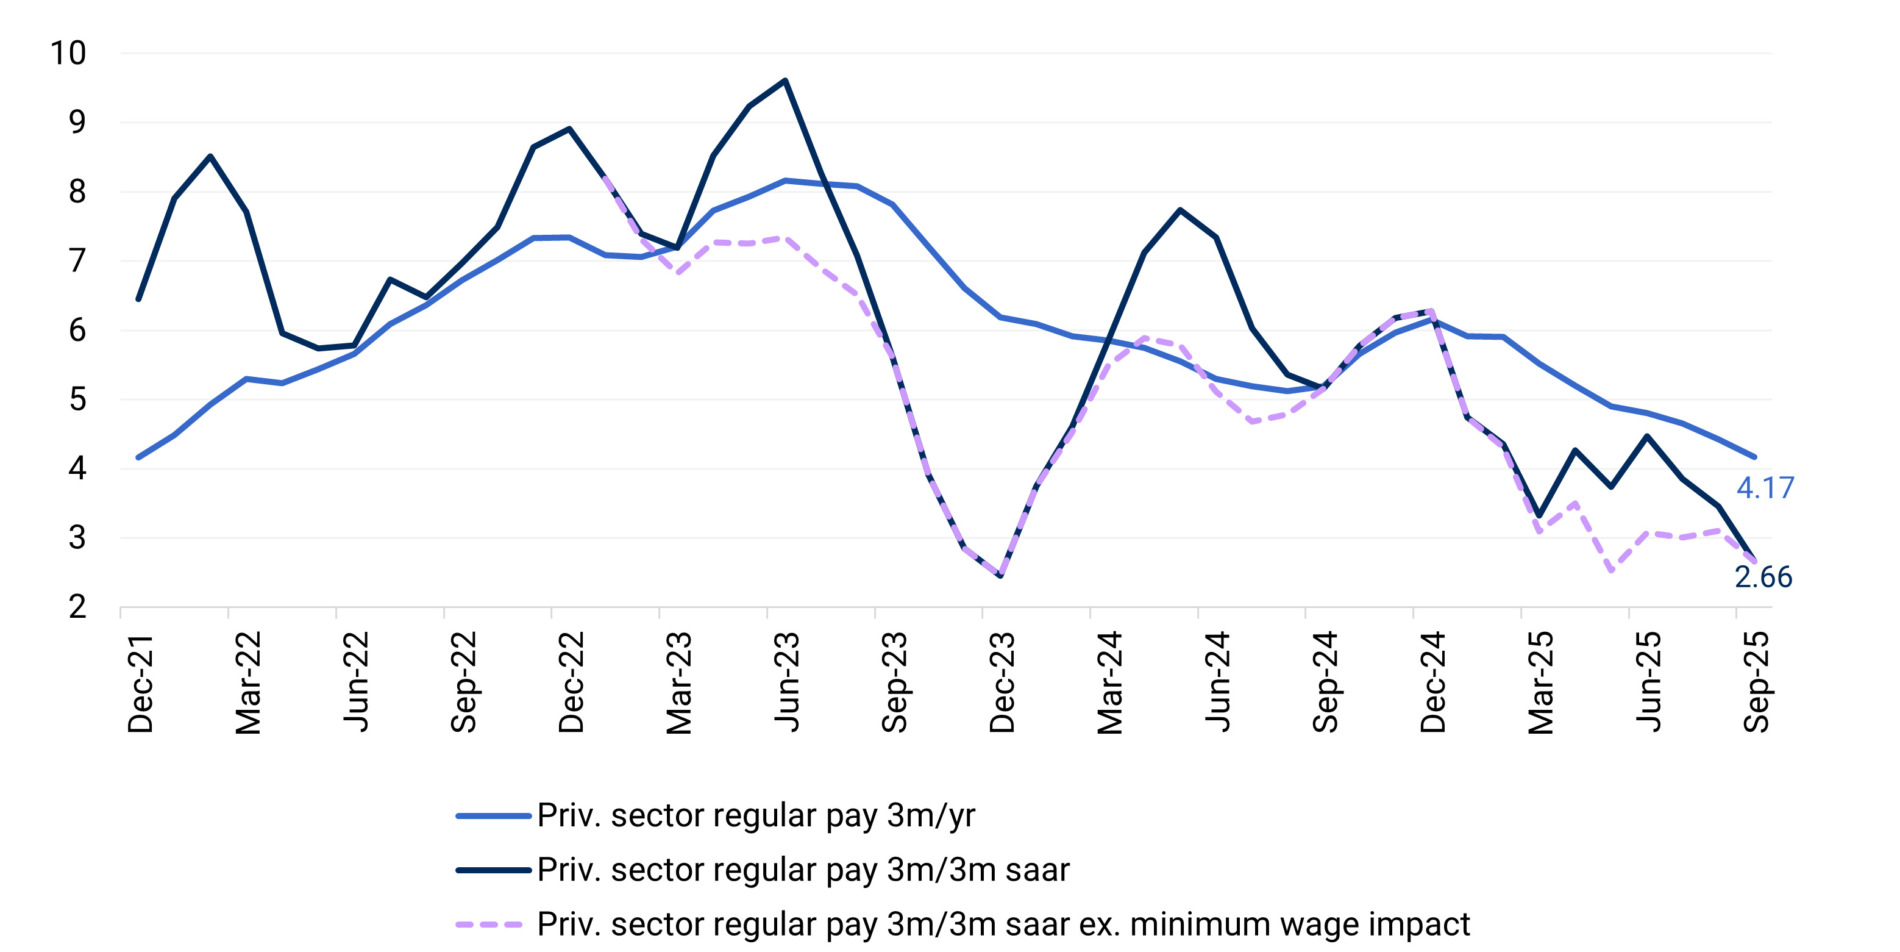
Note: Private-sector regular pay is based on Office for National Statistics’ average weekly earnings. The minimum-wage adjustment reduces modestly the volatility in the implied NAIRU in Figure 4A, but has no bearing on the conclusions.
Source: Element Capital
Our simulation shows that recent UK wage dynamics can be rationalised without assuming a short-term NAIRU above the current 4.97% unemployment rate. A steeper Phillips curve – consistent with reduced supply flexibility after Brexit – offers a credible complementary explanation.
Conclusion
The aim of this article is not to prescribe a particular policy stance. Central banks have a responsibility to anchor inflation expectations. The recent rebound in UK expectations, together with the stalling deceleration in wage surveys, calls for a conservative approach. Re-anchoring expectations could, in time, allow for a lower policy-rate trough, thereby supporting investment.
Rather, our suggestion is to employ a balanced approach when assessing possible structural changes in the UK labour market. Ignoring the possibility that Brexit has steepened the UK Phillips curve could lead to compounding errors. First, it may result in a NAIRU overestimation. Second, it would, all else equal, lead to an overestimation of wage growth when unemployment is above NAIRU.
The implications of such a misspecification would be less visible when unemployment is low. But in a high-unemployment environment, the misstep could be costly: policy-makers would risk fighting yesterday’s battle, seeking excessively tight policy and thereby exacerbating labour-market weakness.
Marco Stringa is Chief European Economist at Element Capital. Shayan Saber served as a consultant to Element Capital during the preparation of this article.
The views expressed here are the authors’ own and do not necessarily reflect those of Element Capital Partners.
Access the references used in this article here.

Interested in this topic? Subscribe to OMFIF’s newsletter for more.