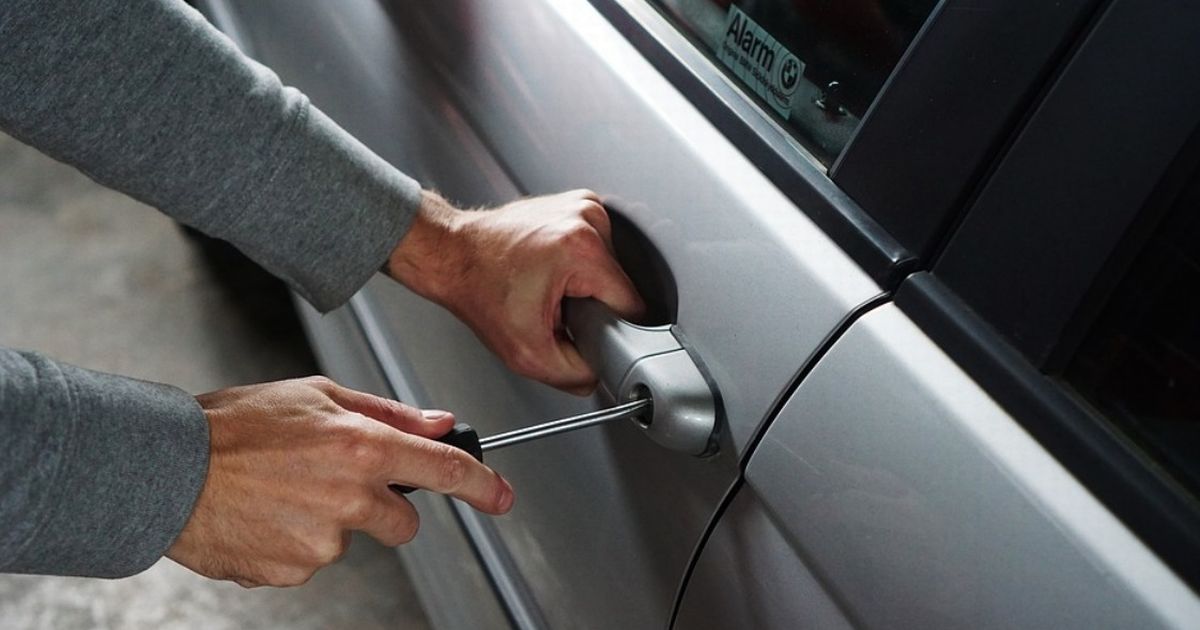
New data has revealed the UK’s worst car theft hotspots and the West Midlands is the second highest in the country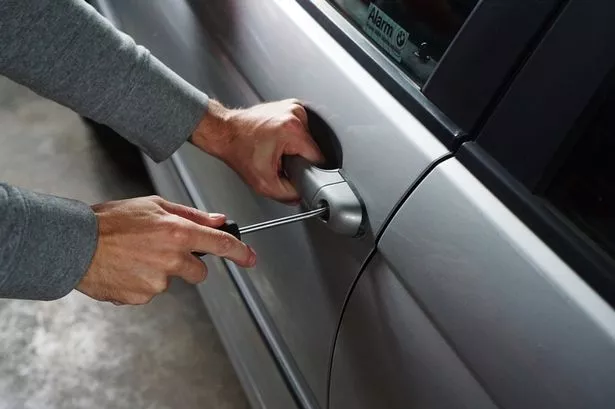 Car thefts are on the rise in the UK(Image: Copyright Unknown)
Car thefts are on the rise but some areas are more at risk than others, as the West Midlands is one of the worst locations for the crime in the UK.
West Midlands Police, covering Birmingham, Coventry, Wolverhampton, Walsall and other areas, ranked second in the data commissioned by the insurance company, Zego.
The data found that the West Midlands sees 91 car thefts a day, equating to 33,193 thefts per year.
Read more: Martin Lewis’ MSE shares ‘cheapest energy deal’ with £285 of savings
With a rate of 114 thefts per 10,000 people, this means that in the region one in every 88 people experiences a vehicle theft each year.
However, the Metropolitan Police Area topped the list, covering all London boroughs, outside the City of London, with a total of 105,100 car thefts per year.
This equates to an average of 288 thefts per day, or a stolen vehicle every five minutes in London alone.
Despite London’s high population density, the Met has the highest theft rate, at 118 thefts per 10,000 people, almost 4% more than the second-ranked force (114).
The full list of highest car theft areas:
- Metropolitan Police – Averages 288 car thefts per day, 118 per 10,000 people yearly, totalling around 105,100 thefts annually
- West Midlands – Sees 91 car thefts daily, 114 per 10,000 people, and about 33,193 per year
- Greater Manchester – Averages 51 thefts a day, 65 per 10,000, with 18,667 yearly
- West Yorkshire – Has 49 daily thefts, 77 per 10,000 people, and 18,046 annually
- Thames Valley – Reports 37 thefts per day, 57 per 10,000, and 13,564 total per year
- Essex – Also has 37 thefts daily, but 71 per 10,000, with a yearly total of 13,494
- South Yorkshire – Sees 33 car thefts each day, 86 per 10,000 people, and 12,093 a year
- Avon and Somerset – Averages 28 per day, 59 per 10,000, and 10,101 per year
- Kent – Has 27 daily thefts, 61 per 10,000, totaling 9,870 a year
- Hampshire – Reports 26 car thefts a day, 66 per 10,000, with a yearly count of 9,495
As for the rest of the UK, the data found the following:
- Wales – Averages 32 car thefts per day, 37 per 10,000 people yearly, with around 11,796 thefts annually
- Scotland – Sees 14 car thefts daily, 9 per 10,000 people, totaling about 5,090 per year
- Northern Ireland – Has 7 thefts a day, 12 per 10,000 people, and roughly 2,393 annually