Antibioclic data description
From November 2017 to September 2024 (Fig. 1), over 29 million Antibioclic requests were made, where 75.88% of requests concerned adults (n = 22,326,473) and 24.11% concerned children (n = 7,094,976). The skin and soft tissue infections domain was the 4th most requested domain with a total of 3,923,412 requests (13.3%), where 755,598 requests (3.38%) were related to Lyme borreliosis (LB). Requests for LB indicators were categorised as follows: 59.43% of requests concerned erythema migrans (EM), 31.85% tick bites (TB), and 8.72% disseminated disease (DD) (Supplementary Table 1). From those Lyme requests, 79% (n = 597,236) requests concerned adults and 21% (n = 158,362) concerned children. For Antibioclic LB indicators incidence estimation, we included requests made for EM and DD indicators to make it comparable with the Sentinelles network estimates.
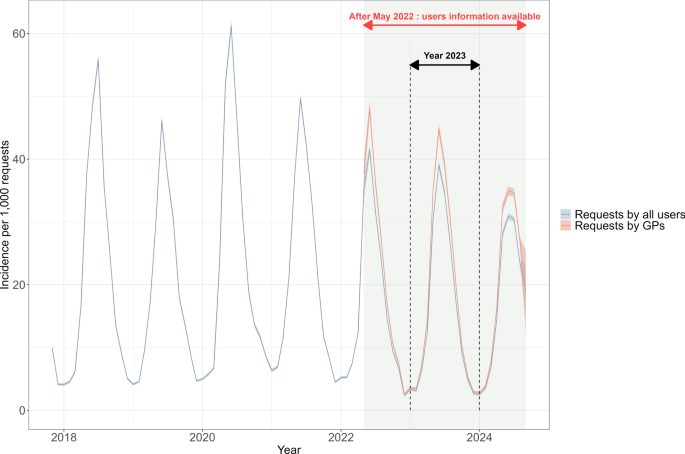
Monthly incidence estimation of Antibioclic requests (CDSS usage) for Lyme indicators (EM and DD combined). The grey line corresponds to the incidence of Lyme requests from all users and the red line corresponds to the incidence of Lyme requests made by GPs. From May 2022 onwards, the user information was available as represented by the shaded area with red double arrow. The black dashed lines and double arrow represent the full year of 2023.
It is important to note that a request corresponded to an online form filled by users when they consult Antibioclic for any health indicators for any reasons (e.g., during patient consultation, and to gain knowledge about antibiotic prescription guidelines for LB). This implies that some Antibioclic requests might not involve a case seen in consultation. Furthermore, from November 2017 to April 2022, an Antibioclic request was defined as a single CDSS usage, by a health practitioner, on specific day and time. From May 2022, an Antibioclic request was defined by an identified health practitioner, on a specific day and time, and at a specific location (at postcode level).
Prior to May 2022 (Fig. 1), metadata on Antibioclic users and requests (date, time, and IP address) were scarce, precluding targeted data analysis. From May 2022 onwards, date and time of the requests, as well as age, sex, medical specialty, IP addresses, and the postcode of medical practice of the users became available. Between 1 May 2022 and 1 September 2024, a total of 10,930,507 Antibioclic requests were made. Among them, 223,116 (2.04%) were considered duplicates, considering that they were created by the same user for the same indicator within 5 min. Furthermore, during this period, 58.44% (n = 6,257,918) requests were made by 36,089 French GPs over 35 years old. Among these requests, 98.5% were made by GPs in non-hospital-based practice, and 1.5% by GPs in hospital-based practice. For our study, we consider only non-hospital-based (primary care) GPs, who overall created 104,613 Lyme requests (EM and DD), corresponding to 1.7% of total requests made by registered non-hospital-based French GPs (Supplementary Fig. 1). We excluded GPs under 35 years old to exclude young GPs not yet established (see Methods for details).
Antibioclic lyme indicators requests, temporal assessment, 2017–2024
We estimated Antibioclic usage through requests made for LB indicators between November 2017 and September 2024. To mirror Lyme (EM and DD) incidence estimation by the Sentinelles network, we considered the requests for Lyme with EM and DD indicators by primary care general practitioners (GPs) (see Methods for details).
In 2017–2024, the monthly incidence of Antibioclic usage for LB indicators (expressed per 1,000 requests, as in Delory et al. 202413) exhibited a seasonal pattern (Fig. 1, grey line) with higher incidences reported from late March—early April to October, with peaks around mid-June. During the whole study period, the highest peak was estimated at 61 per 1,000 requests (CI95%, 60–62) in June 2020. From May 2022 onwards (Fig. 1, red double arrow), the availability of user information allowed to estimate incidence of Antibioclic usage by GPs (Fig. 1, red line). For both requests made by all users and by GPs, the yearly incidence peak showed a declining trend from 2020 onwards.
The year 2023 is the sole full year for which complete user information is available (Fig. 1, black double arrow), allowing to estimate the incidence per 100,000 inhabitants from GPs reports, and spatially. Therefore, the year 2023 was used for the spatial assessment, for the comparison with the Sentinelles network, and as a benchmark year to estimate incidence per 100,000 inhabitants before 2023 (i.e., for the period 2018–2022).
Antibioclic lyme indicators requests, spatial assessment, 2023
In 2023, the number of GPs participating in Antibioclic was 29,448, corresponding to 46.5% of the registered GPs in mainland France and Corsica. The 2023 annual incidence of Antibioclic usage for LB indicators was estimated at 290 requests per 100,000 inhabitants (CI95%, 277–303). This estimate varied across regions with higher incidences found in central and northeastern France (Fig. 2a). In these regions, the annual incidence estimation of this indicator peaked at 495 per 100,000 inh. in Limousin, 487 per 100,000 inh. in Auvergne, and 480 per 100,000 inh. in Alsace (Fig. 2b).
Incidence of Antibioclic requests (CDSS usage) for Lyme indicators, in France in 2023 per 100,000 inhabitants. (a) Map of annual incidence per region. The map was generated using R version 4.4.1 (https://cran.r-project.org/) and R packages: ggplot2 (https://ggplot2.tidyverse.org/) and sf (https://r-spatial.github.io/sf/), in Rstudio version 2024.09.1 (https://posit.co/download/rstudio-desktop/). (b) Barplot of regional incidence with CI (per 100,000 inhabitants), ordered from lowest to highest incidence. Dark red bars correspond to the whole period of 2023 and light red bars correspond to the month of June 2023 (peak month). ALS = Alsace; AQU = Aquitaine; AUV = Auvergne; BNOR = Basse-Normandie; BOU = Bourgogne; BRE = Bretagne; CEN = Centre; CA = Champagne-Ardenne; COR = Corse; FC = Franche-Comté; HNOR = Haute-Normandie; IDF = Ile-de-France; LR = Languedoc-Roussillon; LIM = Limousin; LOR = Lorraine; MPY = Midi-Pyrénées; NPC = Nord-Pas-de-Calais; PDL = Pays de la Loire; PIC = Picardie; PC = Poitou–Charentes; PACA = Provence-Alpes-Côte d’Azur; RA = Rhône-Alpes.
In June 2023, a peak month for LB, the national incidence of Antibioclic usage for LB indicators was estimated at 55 per 100,000 inhabitants (CI95%, 49–61), ranging from 35 (CI95%, 30–39) in Provence-Alpes-Côte d’Azur to 98 (CI95%, 80–117) per 100,000 inhabitants in Limousin. The incidence in June 2023 accounted for 18.9% of the annual incidence in 2023. At the regional level, this proportion varied from 16.2% in Provence-Alpes-Côte d’Azur to 25.2% in Corsica (Fig. 2b).
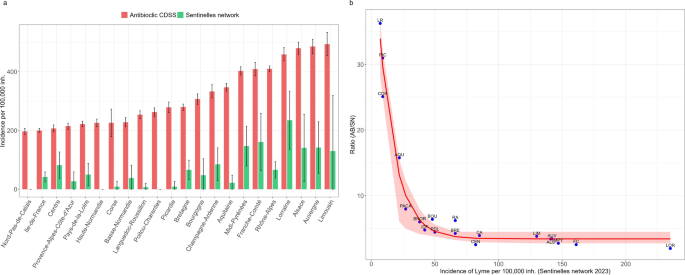
The incidence comparison between LB-related Antibioclic (AB) usage and LB cases reported to the Sentinelles network (SN) by region in 2023 is presented in Fig. 3. The LB incidence by SN was estimated from reported cases seen in general practice and validated cases by a multidisciplinary independent committee7. On the other hand, the incidence of LB-related Antibioclic usage is based on LB-related requests made by primary care GPs to the CDSS. The difference in these two incidence estimates, presented as an AB/SN ratio, varied from 2 to 36 across regions. We applied an exponential decay model and found an exponential relationship between the AB/SN ratio and incidence from the Sentinelles network. That is, higher ratio values were found in lower-risk regions, marked with low LB incidence by the Sentinelles network, and the AB/SN ratio decreased as the incidence from the Sentinelles network increased (Fig. 3b).
Comparison of Antibioclic LB requests (AB) and the Sentinelles network Lyme incidence (SN) estimates by region in 2023. (a) Barplot showing LB incidence estimated by region from both systems, from lower to higher AB incidence. Red bars correspond to incidence of LB requests from Antibioclic indicator and green bars correspond to incidence of LB cases from the Sentinelles network. (b) Relation between AB/SN ratio and Lyme incidence from Sentinelles network in different regions. ALS = Alsace; AQU = Aquitaine; AUV = Auvergne; BNOR = Basse-Normandie; BOU = Bourgogne; BRE = Bretagne; CEN = Centre; CA = Champagne-Ardenne; COR = Corse; FC = Franche-Comté; HNOR = Haute-Normandie; IDF = Ile-de-France; LR = Languedoc-Roussillon; LIM = Limousin; LOR = Lorraine; MPY = Midi-Pyrénées; NPC = Nord-Pas-de-Calais; PDL = Pays de la Loire; PIC = Picardie; PC = Poitou–Charentes; PACA = Provence-Alpes-Côte d’Azur; RA = Rhône-Alpes.
Retrospective estimation of incidence of antibioclic lyme indicator, 2018–2022
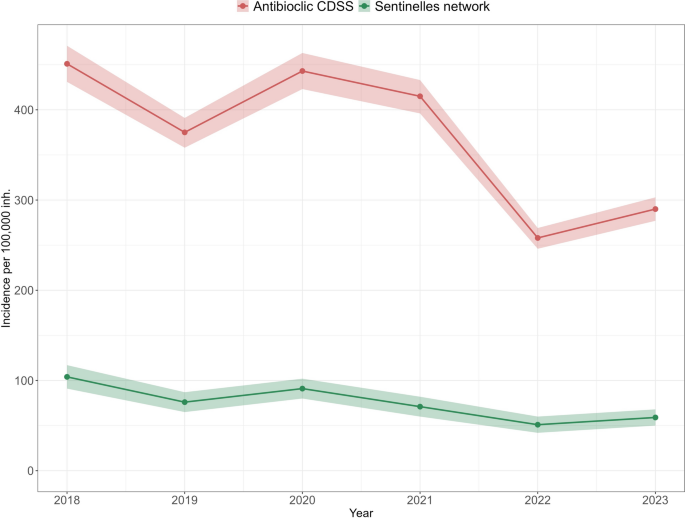
In 2023, the incidence of LB cases reported to the Sentinelles network was estimated at 59 per 100,000 inhabitants (CI95%, 50–68), with the incidence of Antibioclic usage for LB indicators (290 per 100,000 inhabitants; CI95%, 277–303) being 4.9 times higher. To compare the incidence of LB-related Antibioclic usage and LB cases reported to the Sentinelles network, both expressed per 100,000 inhabitants, for the period 2018–2022, we used the 2023 year as a benchmark. This approach allowed us to estimate the number of Antibioclic requests made by GP in previous years and estimate the incidence of Antibioclic usage for LB indicators per 100,000 inhabitants (see Methods for details). This resulted in the annual incidence of LB-related Antibioclic usage in 2018–2022 estimated between 256 (CI95%, 244–267) and 435 (CI95%, 416–454) per 100,000 inhabitants. These estimates were between 4 to 6 times higher than the incidence of LB cases reported to the Sentinelles network (Fig. 4).
Comparison of annual incidences between Antibioclic LB requests (red line) and the Sentinelles network LB incidence (green line) from 2018 to 2023, per 100,000 inhabitants.
Antibioclic cross-sectional study
We set up a cross-sectional study that surveyed Antibioclic users online, to estimate the incidence of reported Antibioclic usage for LB suspect cases seen in consultations during the month of June 2024 (see Methods for study protocol). Overall, 38,206 Antibioclic users were invited for the online survey and 3,243 users participated, including GPs and other health professionals, and resulting in 8.49% participation rate for all users. The survey participants’ profession-based characteristics were similar to Antibioclic participants recorded in June 2024, but with higher median of age (42 [IQR, 35–55]) for survey participants (Supplementary Table 2). Among the respondents, 62.6% of them were females (n = 1,759) and 37.4% were males (n = 1,052). The majority (76.1%) of the respondents were GPs, while the rest were specialists (8%), pharmacists (7.9%), and other health professionals (2.6%). Since the number of GPs invited to the survey among the overall invited participants (n = 38,206) was untracked, we could not estimate survey participation rate among GPs. Nevertheless, the percentage of GPs who responded to the survey among all Antibioclic GP users varied from 3.6% to 11.5% across regions (Supplementary Table 3), and the regional distribution of GPs respondents was similar to the regional distribution of Antibioclic GP users (Supplementary Table 4).
From the survey, a total of 1,306 suspicions of Lyme borreliosis, either erythema migrans or disseminated disease, were reported from 1,451 GPs over 35 years old (Supplementary Fig. 2). Among them, 32.2% GPs (n = 468) reported that they used Antibioclic for at least one suspected LB case over the surveyed month. These GPs used Antibioclic for 57.6% of these suspected LB consultations (n = 752). The incidence of Antibioclic usage for LB suspicions reported in the survey was estimated at 45 per 100,000 inhabitants (CI95%, 30–61). This level was similar to the incidence of LB-related Antibioclic usage recorded in the CDSS for the same month (51 per 100,000 inhabitants; CI95%, 46–56) but lower than the incidence of consultations for LB suspicions (76 per 100,000 inhabitants; CI95%, 57–96) in June 2024.
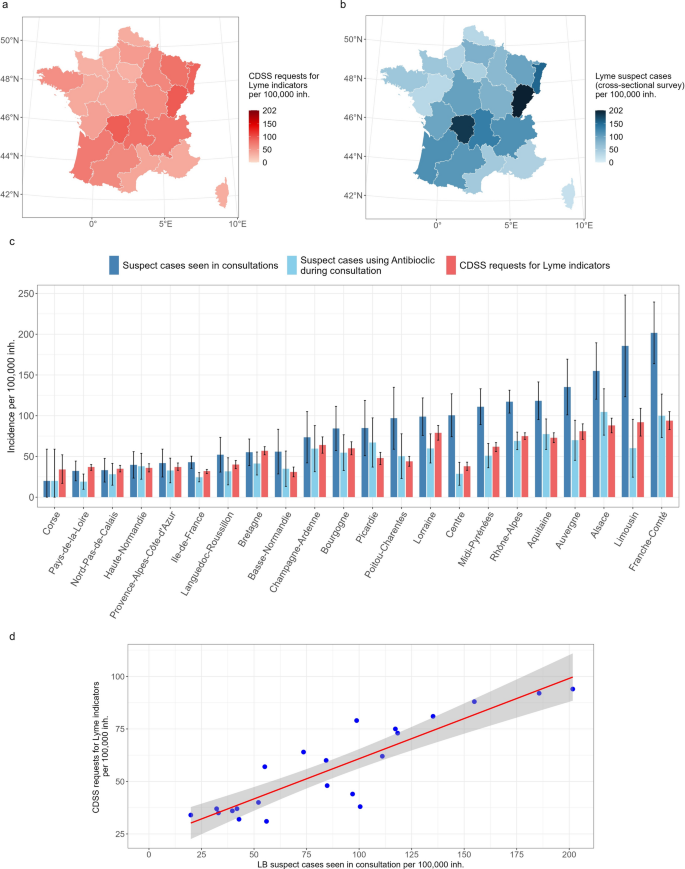
Despite the difference between the Antibioclic LB indicators in CDSS (51 per 100,000 inhabitants) and the consultations reported for LB suspect cases in the survey (76 per 100,000 inhabitants), the regional incidences showed similar pattern, with the highest incidence found in Franche Comté, Limousin, and Alsace regions (Fig. 5a-c). In addition, the incidence of Antibioclic LB requests in June 2024 was similar to the period of June 2023 (55 per 100,000) (Fig. 2b, light red bars) and ranged from 31 (CI95%, 25–37) in Basse-Normandie to 94 (CI95%, 83–105) per 100,000 inhabitants in Franche-Comté (Fig. 5c, red bars).
Comparison of incidence between Antibioclic LB requests and survey results, June 2024. (a) Map of regional incidence of Lyme Antibioclic requests submitted to CDSS (per 100,000 inhabitants) in France. The map was generated using R version 4.4.1 (https://cran.r-project.org/) and R packages: ggplot2 (https://ggplot2.tidyverse.org/) and sf (https://r-spatial.github.io/sf/), in Rstudio version 2024.09.1 (https://posit.co/download/rstudio-desktop/). (b) Map of the regional incidence of Lyme suspect cases seen in consultations (per 100,000 inhabitants) in France, from the survey. The map was generated using R version 4.4.1 (https://cran.r-project.org/) and R packages: ggplot2 (https://ggplot2.tidyverse.org/) and sf (https://r-spatial.github.io/sf/), in Rstudio version 2024.09.1 (https://posit.co/download/rstudio-desktop/). (c) Barplot of regional incidence with CI95% (per 100,000 inhabitants): dark blue bars correspond to incidence of Lyme suspect cases seen in consultations, light blue bars correspond to incidence of Lyme suspect cases where GPs consulted Antibioclic during consultation, and red bars correspond to the incidence of Lyme Antibioclic requests. (d) Scatter plot of the relation between the incidence of Lyme suspect cases and Lyme Antibioclic requests.
The Pearson correlation analysis showed a positive correlation between regional incidence of Antibioclic usage in CDSS for LB indicators and consultations for LB suspect cases reported in the survey, with a coefficient of 0.89 (CI95%, 0.75–0.95). The linear regression analysis provided an R2 value of 0.79 (Fig. 5d). Furthermore, the relation between the incidence of LB suspect cases seen in consultations and the proportion of survey participants per region was presented in Supplementary Fig. 3, showing a linear relationship where the incidence of suspect cases tended to increase with the increased proportion of participants (R2 = 0.40).


