Unsupervised: population structure
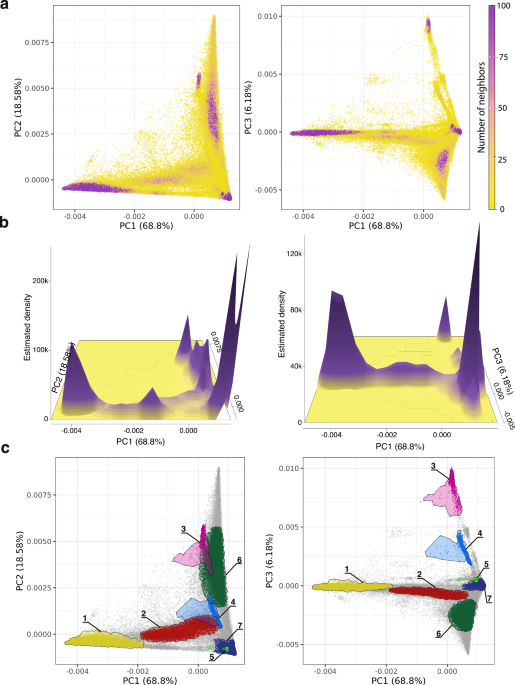
A cohort of 297,549 All of Us participants, for whom genomic data are available, was created using the All of Us Researcher Workbench (Supplementary Fig. 1). All of Us participant genetic diversity was analyzed using PCA of genomic variant data followed by unsupervised clustering to assess the extent of population structure in the cohort. The clustering tendency of participant genomic PCA data was evaluated using the Hopkins statistic, nearest neighbors, and kernel density estimation. The PCA data yield a Hopkins statistic value of ~1, indicating highly clustered, non-uniformly, and non-randomly distributed genomic PCA data. The number of close neighbors per participant is highly variable across PC space, and kernel density estimation shows a multimodal distribution with distinct peaks separated in PC space (Fig. 1a, b). All three of these metrics reveal highly clustered participant genomic data, with dense groups of genetically similar individuals interspersed among less dense regions, indicative of substantial population structure in the All of Us cohort.
Fig. 1: Population structure.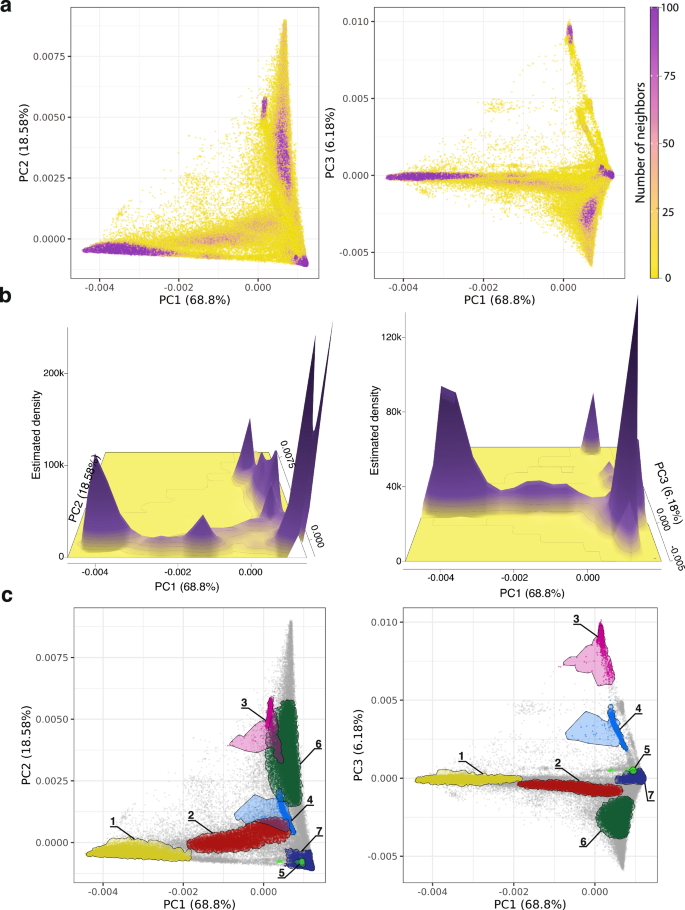
Genomic PCA for All of Us participants. Left panels show PC1 versus PC2 comparisons, and right panels show PC1 versus PC3 comparisons, with the percent of variance explained by each PC shown. a Participants color-coded by the number of close neighbors as defined by Euclidean distance b Kernel density estimation with peaks showing high-density clusters of participants in PC space. c High-density clusters of genetically similar participants are shown as groups 1–7.
Density-based clustering of the genomic PCA data yields an optimal number of K = 7 genetic diversity clusters (Fig. 1c). Similar clustering was performed using a Uniform Manifold Approximation and Projection (UMAP) analysis of the genomic PCA data (Supplementary Methods). Density-based clustering of UMAP data reveals almost twice as many clusters (K = 13) as seen for the PCA data, but there is broad concordance between the two methods with high percentages of participant overlap for each PCA cluster within one or two corresponding UMAP clusters (Supplementary Fig. 2). The number of All of Us genetic diversity clusters could change with future participant data releases.
Supervised: genetic ancestry
All of Us participants genetic ancestry was inferred using genomic PCA data analyzed with the Rye (Rapid Ancestry Estimation) program20. Participant PCA data were compared with PCA data from global reference populations, taken from the 1KGP and the HGDP, to infer individual ancestry proportions from seven continental-level ancestry groups: African, American, East Asian, South Asian, West Asian, European, and Oceanian (Supplementary Table 1 and Supplementary Fig. 3). All of Us participants are broadly distributed in PC space, whereas global reference samples from different ancestry groups are tightly clustered in PC space (Fig. 2a, b). Rye infers All of Us participant genetic ancestry proportions as linear combinations of reference population ancestries. Overall, the All of Us participant cohort shows 19.51% African, 6.33% American, 2.57% East Asian, 3.05% South Asian, 1.95% West Asian, 66.37% European, and 0.21% Oceanian ancestry. The All of Us participant genetic similarity groups inferred with density-based clustering show group-specific patterns of ancestry proportions, with a continuum of ancestry proportions within and between groups (Fig. 2c). Groups 1, 3, 4, and 7 show the most uniform patterns of ancestry within groups, whereas groups 2, 5, 6, and the remaining participants that did not fall into any density-based cluster show more diverse patterns of ancestry and admixture. All groups show evidence of admixture with multiple ancestry components present in different proportions.
Fig. 2: Continental genetic ancestry.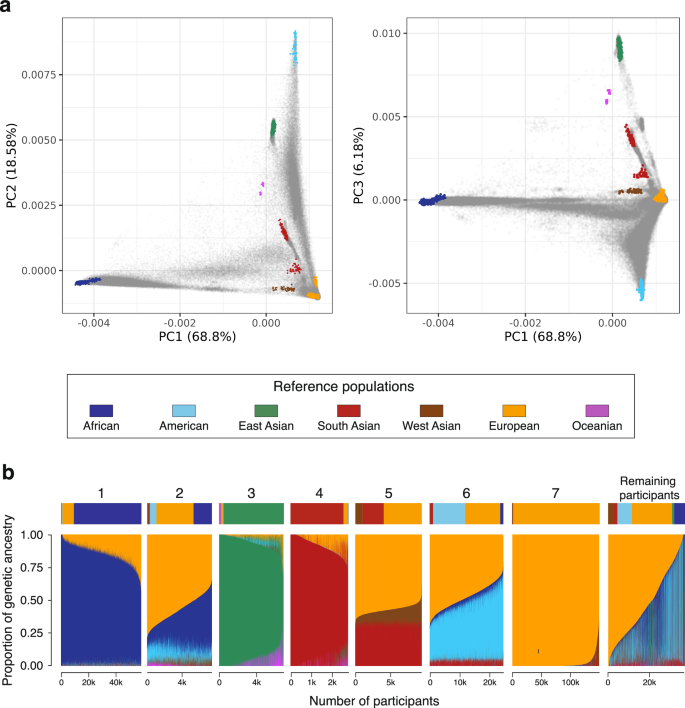
a Genomic PCA with All of Us participants shown in gray and global reference population samples color-coded as shown in the key. Left panels show PC1 versus PC2 comparisons, and right panels show PC1 versus PC3 comparisons, with the percent of variance explained by each PC shown. b Genetic ancestry proportions for All of Us participants stratified by the genetic similarity groups shown in Fig. 1c. Average ancestry proportions are shown above each group, and numbers of participants are shown below each group. The remaining participants are individuals who did not fall into a dense PCA cluster.
The All of Us Researcher Workbench predicts participant membership among six continental ancestry groups, using a PCA-based machine learning method that is distinct from the continuous ancestry inference approach used here21. We compared the participant continental ancestry percentages inferred here to the Researcher Workbench assigned categorical ancestry groups (Supplementary Fig. 4). Five of the six categorical ancestry groups correspond exactly with the reference population groups we use: African, East Asian, South Asian, Middle Eastern (West Asian here), and European. For these five groups, there is high correspondence between participants’ PCA-based machine learning predicted group membership and averages for the ancestry percentages that we inferred (83.02–97.71% matching ancestry). The Admixed American ancestry category from the Researcher Workbench includes modern, admixed reference samples from Latin America, whereas our American reference population group includes Indigenous American samples only (Supplementary Table 1). The Admixed American group shows 51.01% European ancestry and 35.84% American ancestry, consistent with what is expected for modern Latin American populations22,23.
We also used Rye to infer subcontinental ancestry for All of Us participants with high levels of African (n = 9291), East Asian (n = 2457), South Asian (n = 2484), and European ancestry (n = 24,730; Fig. 3 and Supplementary Table 3). The relationships among the reference populations used for subcontinental ancestry inference with Rye and All of Us participants are shown in Supplementary Figs. 5–7. African subcontinental ancestry is characterized by a predominant West Central African component, followed by West African and Bantu components. East Asian subcontinental ancestry is highly diverse, with predominant Han (Chinese), Japanese, and Southeast Asian components. South Asian subcontinental ancestry is mainly South Indian, followed by North Indian and a small Central Asian component. European subcontinental ancestry is made up primarily of British ancestry, followed by Italian and Iberian components.
Fig. 3: Subcontinental genetic ancestry.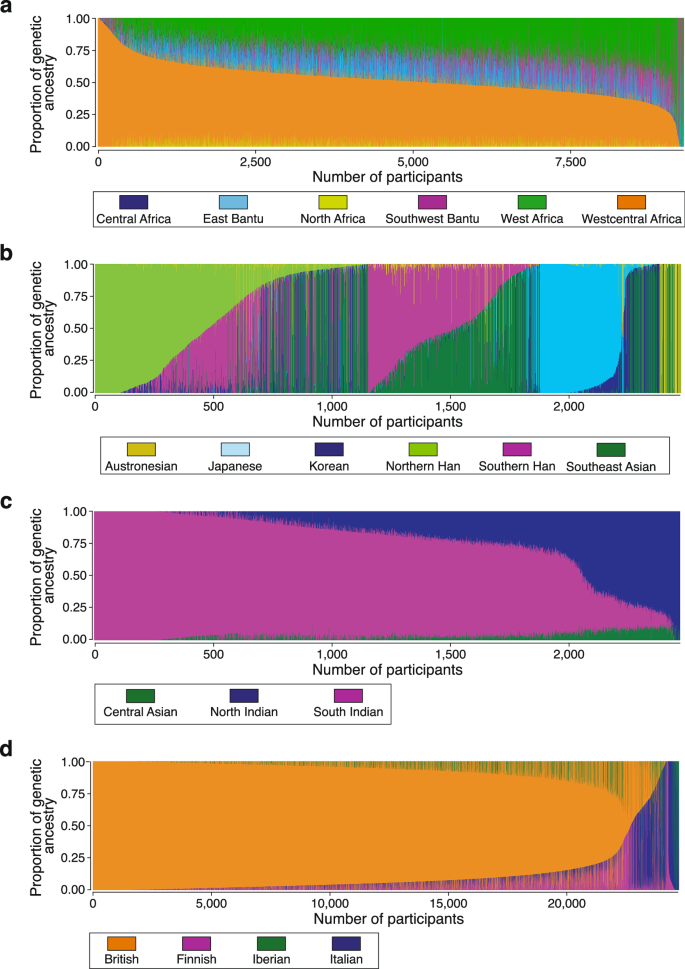
Subcontinental genetic ancestry proportions for All of Us participants from (a) African, (b) East Asian, (c) South Asian, and (d) European continental ancestry groups. Subcontinental groups (regions) for each continental ancestry group are color-coded as shown.
The continental and subcontinental ancestry estimates presented here are dependent on the reference samples used for the analysis, since Rye assigns ancestry percentages for All of Us participants based on relative genetic similarity to a set of reference populations. Accordingly, incomplete sampling of reference populations, coupled with spatial population structure as seen for the All of Us participants, could introduce biases to the ancestry estimates. We performed sensitivity analyzes to test for such biases by sequentially adding and removing reference populations and observing how continental or subcontinental ancestry estimates change.
For the continental ancestry sensitivity analysis, we focused on cluster 5, which shows combination of European, South Asian, and West Asian ancestry components that may not correspond to known historical events (Fig. 2). Adding a Central Asian reference population to the analysis does not noticeably change the ancestry estimates for this group, whereas removing either South or West Asian components does change the results appreciably (Supplementary Fig. 8). This could point to ancestral origins for these participants in the Arabian Peninsula, Iraq, or Iran, geographically in between the reference populations used here. Nevertheless, the challenge of incomplete reference populations only applies to a small percentage of All of Us participants (~3%), the majority of which show ancestral origins from continental regions that are well-covered by the reference populations used here.
For the subcontinental ancestry sensitivity analysis, we focused on the African subcontinental ancestry given the 7.7% average East Bantu ancestry component estimated for these participants (Fig. 3a and Supplementary Table 3). This ancestry component was not observed for African Americans in the US in a recent comprehensive analysis of genetic ancestry in the Americas24. Given that many of the participants selected for this analysis are admixed with European ancestry, the East Bantu component could be accounted for by missing European or related reference populations. However, adding European and North African reference populations does not change the results appreciably (Supplementary Fig. 9). The relatively small East Bantu component (7.7%) most likely corresponds to Bantu populations that are not well represented in the reference populations used here, rather than non-Bantu East African ancestry.
Genetic ancestry by geography and age
All of Us participant continental ancestry percentages were visualized across fifty states and Puerto Rico to evaluate the geographic distribution of ancestry across the US (Fig. 4). African ancestry is concentrated primarily in the southeast part of the country, whereas American ancestry is found primarily in the southwest and California. European ancestry is more uniformly distributed across the country, with the highest concentrations found in north, along the Canadian border. Relatively high levels of admixture are seen in the northeast, Florida, and Hawaii.
Fig. 4: Genetic ancestry by geography.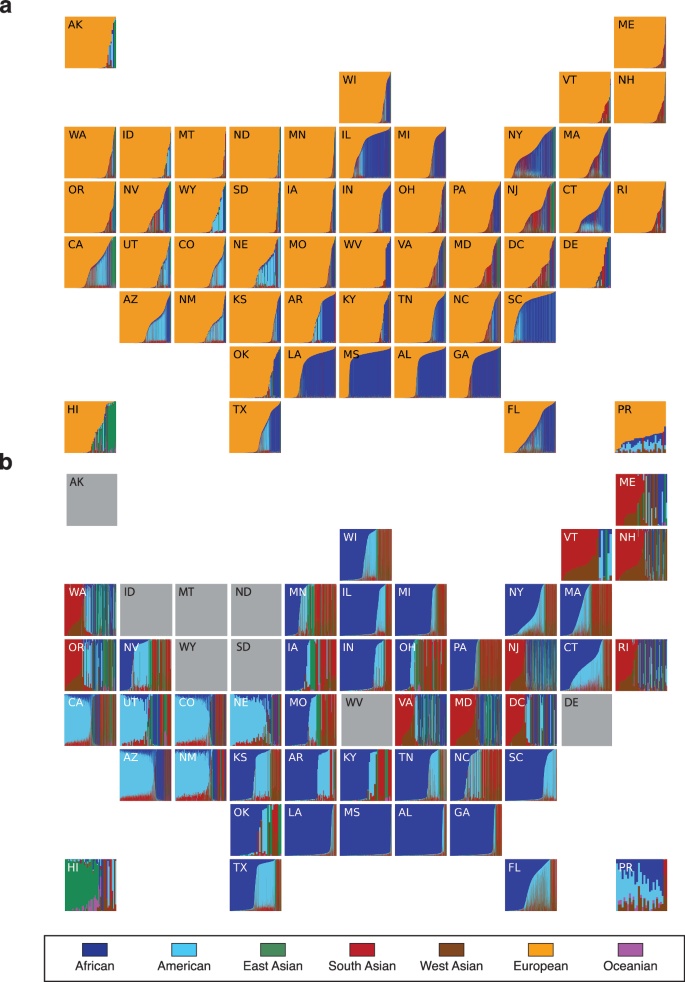
Genetic ancestry proportions are shown for All of Us participants sampled from the fifty US states and Puerto Rico. a All participants and ancestry components. b Non-European genetic ancestry proportions for all individuals with
The relationship between All of Us participants’ age and genetic ancestry was assessed using genetic admixture entropy, where higher values indicate a more diverse combination of ancestry components within individual genomes and lower values indicate more homogenous ancestry (Fig. 5). Genetic admixture entropy is negatively correlated with participant age, indicating that younger participants have more diverse ancestry combinations than older participants.
Fig. 5: Genetic admixture by age.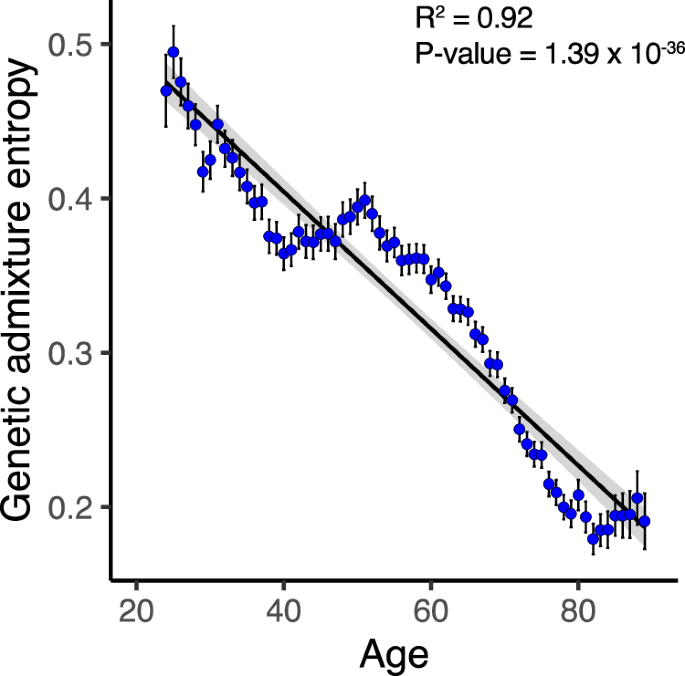
Genetic admixture entropy (y-axis) against participant age (x-axis). Ages shown in single year bins, where each bin had at least 1000 participants (24–89 years), with average and 95% CI values shown. Linear regression trend line (black) shown with 95% CI shaded (gray). The linear regression adjusted R2 and its P value are shown for n = 66 bins.