Feb 3, 2026
IndexBox has just published a new report: United Kingdom – Wood Pulp – Market Analysis, Forecast, Size, Trends and Insights.
The UK wood pulp market, valued at $669M in 2024, is forecast for modest growth to 1.2M tons (volume) and $888M (value) by 2035. Domestic production has declined significantly, leading to heavy reliance on imports, primarily chemical wood pulp from Brazil and Sweden. Consumption is dominated by chemical wood pulp (65%), though overall demand has retreated from its 2014 peak. Exports are minimal and declining, while import prices have remained relatively stable.
Key Findings
- UK wood pulp market is forecast to grow slightly to 1.2M tons in volume and $888M in value by 2035
- Market is heavily import-dependent, with Brazil and Sweden supplying over 70% of imports by volume
- Chemical wood pulp constitutes 65% of domestic consumption and 92% of imports
- Domestic production fell sharply to 317K tons in 2024, a decrease of over 30% from the 2014 peak
- Exports are negligible and fell dramatically to just 1.4K tons in 2024
Market Forecast
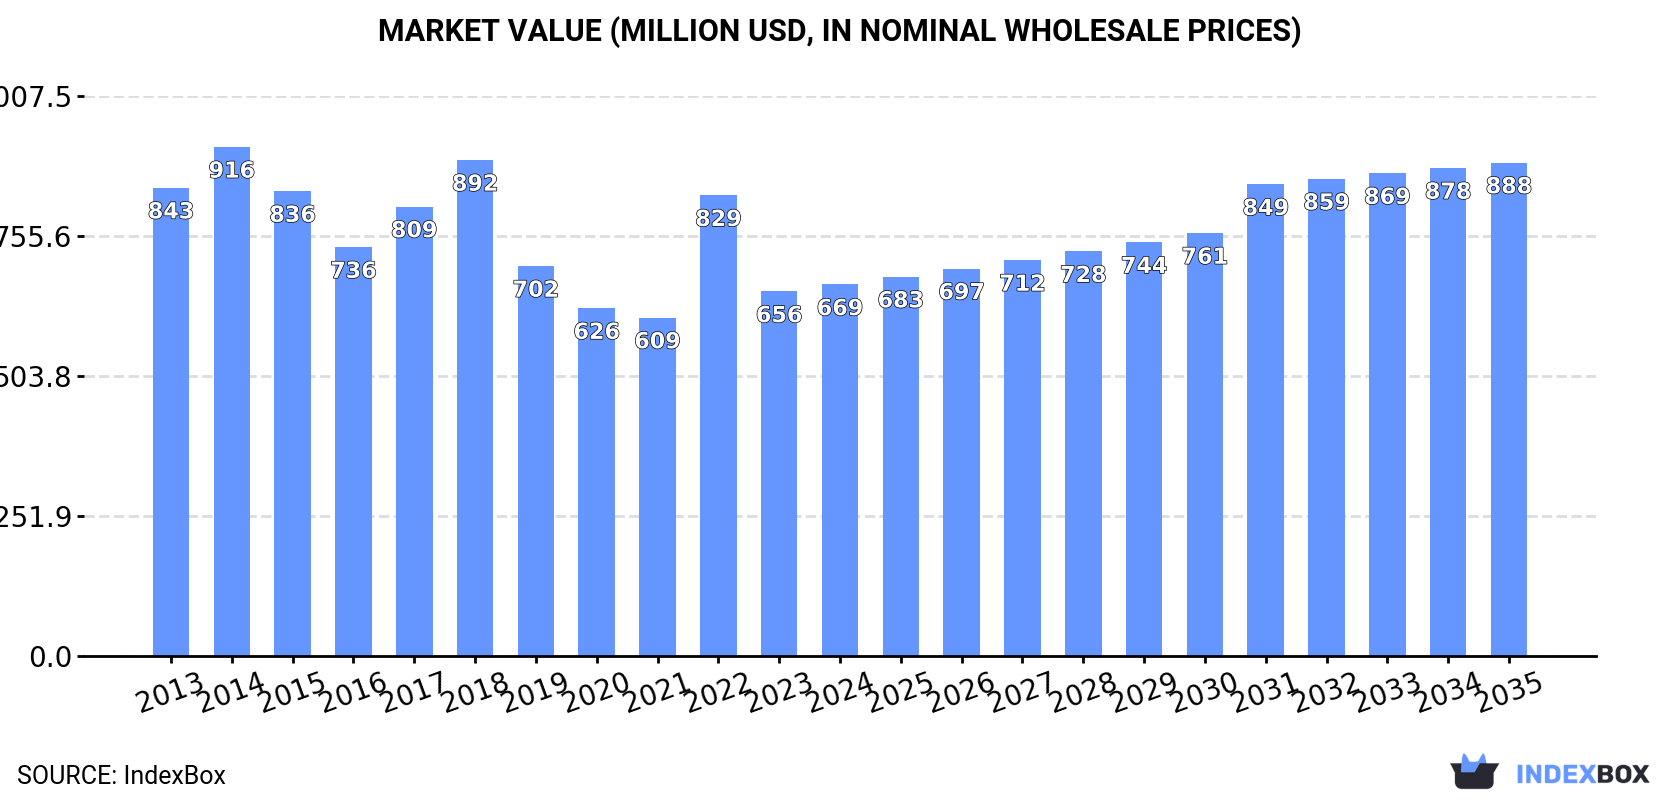
Driven by rising demand for wood pulp in the UK, the market is expected to start an upward consumption trend over the next decade. The performance of the market is forecast to increase slightly, with an anticipated CAGR of +1.2% for the period from 2024 to 2035, which is projected to bring the market volume to 1.2M tons by the end of 2035.
In value terms, the market is forecast to increase with an anticipated CAGR of +2.6% for the period from 2024 to 2035, which is projected to bring the market value to $888M (in nominal wholesale prices) by the end of 2035.
 ConsumptionUnited Kingdom’s Consumption of Wood Pulp
Wood pulp consumption in the UK shrank slightly to 1.1M tons in 2024, declining by -2.3% on 2023 figures. Overall, consumption continues to indicate a perceptible setback. Over the period under review, consumption attained the maximum volume at 1.6M tons in 2014; however, from 2015 to 2024, consumption failed to regain momentum.
The revenue of the wood pulp market in the UK amounted to $669M in 2024, picking up by 1.9% against the previous year. This figure reflects the total revenues of producers and importers (excluding logistics costs, retail marketing costs, and retailers’ margins, which will be included in the final consumer price). Over the period under review, consumption continues to indicate a pronounced reduction. Over the period under review, the market reached the peak level at $916M in 2014; however, from 2015 to 2024, consumption stood at a somewhat lower figure.
Consumption By Type
Chemical wood pulp (696K tons) constituted the product with the largest volume of consumption, accounting for 65% of total volume. Moreover, chemical wood pulp exceeded the figures recorded for the second-largest type, mechanical and semi-chemical wood pulp (331K tons), twofold.
From 2013 to 2024, the average annual growth rate of the volume of chemical wood pulp consumption was relatively modest. With regard to the other consumed products, the following average annual rates of growth were recorded: mechanical and semi-chemical wood pulp (-5.6% per year) and dissolving grade wood pulp (+1.4% per year).
In value terms, chemical wood pulp ($450M) led the market, alone. The second position in the ranking was held by mechanical and semi-chemical wood pulp ($171M).
From 2013 to 2024, the average annual growth rate of the value of chemical wood pulp market was relatively modest. With regard to the other consumed products, the following average annual rates of growth were recorded: mechanical and semi-chemical wood pulp (-5.8% per year) and dissolving grade wood pulp (+1.2% per year).
ProductionUnited Kingdom’s Production of Wood Pulp
In 2024, approx. 317K tons of wood pulp were produced in the UK; which is down by -13.1% on 2023 figures. Overall, production recorded a noticeable shrinkage. The most prominent rate of growth was recorded in 2014 when the production volume increased by 5.9% against the previous year. As a result, production attained the peak volume of 471K tons. From 2015 to 2024, production growth remained at a somewhat lower figure.
In value terms, wood pulp production dropped significantly to $180M in 2024 estimated in export price. Over the period under review, production saw a abrupt decrease. The most prominent rate of growth was recorded in 2022 when the production volume increased by 99% against the previous year. Over the period under review, production reached the maximum level at $688M in 2014; however, from 2015 to 2024, production failed to regain momentum.
Production By Type
Mechanical and semi-chemical wood pulp (423K tons) constituted the product with the largest volume of production, accounting for 99% of total volume. It was followed by chemical wood pulp (4.3K tons), with a 1% share of total production.
From 2013 to 2020, the average annual rate of growth in terms of the volume of mechanical and semi-chemical wood pulp production was relatively modest.
In value terms, mechanical and semi-chemical wood pulp ($154M) led the market, alone. The second position in the ranking was taken by chemical wood pulp ($2.5M).
From 2013 to 2020, the average annual growth rate of the value of mechanical and semi-chemical wood pulp production amounted to -18.9%.
ImportsUnited Kingdom’s Imports of Wood Pulp
Wood pulp imports into the UK rose modestly to 761K tons in 2024, picking up by 2.8% against the previous year. In general, imports, however, saw a noticeable contraction. The pace of growth appeared the most rapid in 2022 with an increase of 30%. Over the period under review, imports reached the maximum at 1.2M tons in 2014; however, from 2015 to 2024, imports stood at a somewhat lower figure.
In value terms, wood pulp imports reached $567M in 2024. Over the period under review, imports, however, showed a noticeable slump. The pace of growth appeared the most rapid in 2022 when imports increased by 38% against the previous year. Imports peaked at $806M in 2018; however, from 2019 to 2024, imports failed to regain momentum.
Imports By Country
Brazil (341K tons), Sweden (213K tons) and Spain (54K tons) were the main suppliers of wood pulp imports to the UK, with a combined 80% share of total imports.
From 2013 to 2024, the biggest increases were recorded for Spain (with a CAGR of +5.6%), while purchases for the other leaders experienced more modest paces of growth.
In value terms, the largest wood pulp suppliers to the UK were Brazil ($215M), Sweden ($186M) and Finland ($39M), with a combined 77% share of total imports. South Africa, Spain, Uruguay, the United States, Portugal, Chile, Austria and the Netherlands lagged somewhat behind, together accounting for a further 21%.
South Africa, with a CAGR of +3.0%, saw the highest rates of growth with regard to the value of imports, among the main suppliers over the period under review, while purchases for the other leaders experienced more modest paces of growth.
Imports By Type
In 2024, chemical wood pulp (698K tons) was the main type of wood pulp supplied to the UK, with a 92% share of total imports. Moreover, chemical wood pulp exceeded the figures recorded for the second-largest type, dissolving grade wood pulp (49K tons), more than tenfold.
From 2013 to 2024, the average annual growth rate of the volume of chemical wood pulp imports totaled -1.8%. With regard to the other supplied products, the following average annual rates of growth were recorded: dissolving grade wood pulp (+1.4% per year) and mechanical and semi-chemical wood pulp (-20.7% per year).
In value terms, chemical wood pulp ($511M) constituted the largest type of wood pulp supplied to the UK, comprising 90% of total imports. The second position in the ranking was taken by dissolving grade wood pulp ($46M), with an 8.2% share of total imports.
From 2013 to 2024, the average annual rate of growth in terms of the value of chemical wood pulp imports stood at -1.1%. With regard to the other supplied products, the following average annual rates of growth were recorded: dissolving grade wood pulp (+1.1% per year) and mechanical and semi-chemical wood pulp (-20.2% per year).
Import Prices By Type
The average wood pulp import price stood at $744 per ton in 2024, growing by 5% against the previous year. Over the period under review, the import price recorded a relatively flat trend pattern. The pace of growth was the most pronounced in 2021 when the average import price increased by 33%. Over the period under review, average import prices reached the maximum at $784 per ton in 2022; however, from 2023 to 2024, import prices stood at a somewhat lower figure.
Average prices varied somewhat amongst the major supplied products. In 2024, the product with the highest price was dissolving grade wood pulp ($945 per ton), while the price for mechanical and semi-chemical wood pulp ($652 per ton) was amongst the lowest.
From 2013 to 2024, the most notable rate of growth in terms of prices was attained by chemical wood pulp (+0.7%), while the prices for the other products experienced mixed trend patterns.
Import Prices By Country
The average wood pulp import price stood at $744 per ton in 2024, rising by 5% against the previous year. Over the period under review, the import price saw a relatively flat trend pattern. The most prominent rate of growth was recorded in 2021 when the average import price increased by 33% against the previous year. Over the period under review, average import prices attained the maximum at $784 per ton in 2022; however, from 2023 to 2024, import prices remained at a lower figure.
Prices varied noticeably by country of origin: amid the top importers, the country with the highest price was the Netherlands ($2,177 per ton), while the price for Spain ($536 per ton) was amongst the lowest.
From 2013 to 2024, the most notable rate of growth in terms of prices was attained by the Netherlands (+16.4%), while the prices for the other major suppliers experienced more modest paces of growth.
ExportsUnited Kingdom’s Exports of Wood Pulp
Wood pulp exports from the UK shrank rapidly to 1.4K tons in 2024, reducing by -48.4% on 2023 figures. In general, exports continue to indicate a significant decline. The pace of growth was the most pronounced in 2018 when exports increased by 126%. The exports peaked at 121K tons in 2014; however, from 2015 to 2024, the exports stood at a somewhat lower figure.
In value terms, wood pulp exports surged to $3M in 2024. Over the period under review, exports saw a precipitous setback. The pace of growth appeared the most rapid in 2018 with an increase of 167%. As a result, the exports attained the peak of $93M. From 2019 to 2024, the growth of the exports remained at a lower figure.
Exports By Country
Germany (471 tons), Ireland (347 tons) and Nigeria (137 tons) were the main destinations of wood pulp exports from the UK, with a combined 69% share of total exports.
From 2013 to 2024, the biggest increases were recorded for Nigeria (with a CAGR of +115.7%), while shipments for the other leaders experienced more modest paces of growth.
In value terms, the largest markets for wood pulp exported from the UK were Vietnam ($575K), the United States ($491K) and Ireland ($354K), together comprising 48% of total exports.
In terms of the main countries of destination, Vietnam, with a CAGR of +103.9%, saw the highest growth rate of the value of exports, over the period under review, while shipments for the other leaders experienced more modest paces of growth.
Exports By Type
Chemical wood pulp (1.2K tons) was the largest type of wood pulp exported from the UK, with a 85% share of total exports. Moreover, chemical wood pulp exceeded the volume of the second product type, mechanical and semi-chemical wood pulp (180 tons), sevenfold.
From 2013 to 2024, the average annual rate of growth in terms of the volume of chemical wood pulp exports amounted to -32.7%. With regard to the other exported products, the following average annual rates of growth were recorded: mechanical and semi-chemical wood pulp (-12.0% per year) and dissolving grade wood pulp (+34.1% per year).
In value terms, wood pulp with the largest exports in the UK were chemical wood pulp ($1.5M), mechanical and semi-chemical wood pulp ($1.3M) and dissolving grade wood pulp ($175K), with a combined 99.9% share of total exports.
Among the main product categories, dissolving grade wood pulp, with a CAGR of +17.8%, saw the highest growth rate of the value of exports, over the period under review, while shipments for the other products experienced mixed trend patterns.
Export Prices By Type
In 2024, the average wood pulp export price amounted to $2,152 per ton, increasing by 133% against the previous year. In general, the export price recorded a remarkable increase. As a result, the export price reached the peak level and is likely to continue growth in the immediate term.
There were significant differences in the average prices for the major types of exported product. In 2024, the product with the highest price was dissolving grade wood pulp ($7,442 per ton), while the average price for exports of chemical wood pulp ($1,268 per ton) was amongst the lowest.
From 2013 to 2024, the most notable rate of growth in terms of prices was recorded for the following types: mechanical and semi-chemical wood pulp (+15.4%), while the prices for the other products experienced mixed trend patterns.
Export Prices By Country
The average wood pulp export price stood at $2,152 per ton in 2024, increasing by 133% against the previous year. Overall, the export price recorded a remarkable increase. As a result, the export price attained the peak level and is likely to continue growth in the immediate term.
Prices varied noticeably by country of destination: amid the top suppliers, the country with the highest price was France ($24,089 per ton), while the average price for exports to Austria ($171 per ton) was amongst the lowest.
From 2013 to 2024, the most notable rate of growth in terms of prices was recorded for supplies to Thailand (+46.8%), while the prices for the other major destinations experienced more modest paces of growth.
Source: IndexBox Market Intelligence Platform
This report provides a comprehensive view of the wood pulp industry in the United Kingdom, tracking demand, supply, and trade flows across the national value chain. It explains how demand across key channels and end-use segments shapes consumption patterns, while also mapping the role of input availability, production efficiency, and regulatory standards on supply.
Beyond headline metrics, the study benchmarks prices, margins, and trade routes so you can see where value is created and how it moves between domestic suppliers and international partners. The analysis is designed to support strategic planning, market entry, portfolio prioritization, and risk management in the wood pulp landscape in the United Kingdom.
Quick navigation
Key findings
- Domestic demand is shaped by both household and industrial usage, with trade flows linking local supply to imports and exports.
- Pricing dynamics reflect unit values, freight costs, exchange rates, and regulatory shifts that affect sourcing decisions.
- Supply depends on input availability and production efficiency, creating a distinct national cost curve.
- Market concentration varies by segment, creating different competitive landscapes and entry barriers.
- The 2035 outlook highlights where capacity investment and demand growth are most aligned within the country.
Report scope
The report combines market sizing with trade intelligence and price analytics for the United Kingdom. It covers both historical performance and the forward outlook to 2035, allowing you to compare cycles, structural shifts, and policy impacts.
- Market size and growth in value and volume terms
- Consumption structure by end-use segments
- Production capacity, output, and cost dynamics
- Trade flows, exporters, importers, and balances
- Price benchmarks, unit values, and margin signals
- Competitive context and market entry conditions
Product coverage
- FCL 1654 – Mechanical wood pulp
- FCL 1655 – Semi-chemical wood pulp
- FCL 1663 – Chemical wood pulp, sulphate, bleached
- FCL 1661 – Chemical wood pulp, sulphite, bleached
- FCL 1667 – Dissolving wood pulp
- FCL 1662 – Chemical wood pulp, sulphate, unbleached
- FCL 1660 – Chemical wood pulp, sulphite, unbleached
Country coverageCountry profile and benchmarks
This report provides a consistent view of market size, trade balance, prices, and per-capita indicators for the United Kingdom. The profile highlights demand structure and trade position, enabling benchmarking against regional and global peers.
Methodology
The analysis is built on a multi-source framework that combines official statistics, trade records, company disclosures, and expert validation. Data are standardized, reconciled, and cross-checked to ensure consistency across time series.
- International trade data (exports, imports, and mirror statistics)
- National production and consumption statistics
- Company-level information from financial filings and public releases
- Price series and unit value benchmarks
- Analyst review, outlier checks, and time-series validation
All data are normalized to a common product definition and mapped to a consistent set of codes. This ensures that comparisons across time are aligned and actionable.
Forecasts to 2035
The forecast horizon extends to 2035 and is based on a structured model that links wood pulp demand and supply to macroeconomic indicators, trade patterns, and sector-specific drivers. The model captures both cyclical and structural factors and reflects known policy and technology shifts in the United Kingdom.
- Historical baseline: 2012-2025
- Forecast horizon: 2026-2035
- Scenario-based sensitivity to income growth, substitution, and regulation
- Capacity and investment outlook for major producing companies
Each projection is built from national historical patterns and the broader regional context, allowing the report to show where growth is concentrated and where risks are elevated.
Price analysis and trade dynamics
Prices are analyzed in detail, including export and import unit values, regional spreads, and changes in trade costs. The report highlights how seasonality, freight rates, exchange rates, and supply disruptions influence pricing and margins.
- Price benchmarks by country and sub-region
- Export and import unit value trends
- Seasonality and calendar effects in trade flows
- Price outlook to 2035 under baseline assumptions
Profiles of market participants
Key producers, exporters, and distributors are profiled with a focus on their operational scale, geographic footprint, product mix, and market positioning. This helps identify competitive pressure points, partnership opportunities, and routes to differentiation.
- Business focus and production capabilities
- Geographic reach and distribution networks
- Cost structure and pricing strategy indicators
- Compliance, certification, and sustainability context
How to use this report
- Quantify domestic demand and identify the most attractive segments
- Evaluate export opportunities and prioritize target destinations
- Track price dynamics and protect margins
- Benchmark performance against leading competitors
- Build evidence-based forecasts for investment decisions
This report is designed for manufacturers, distributors, importers, wholesalers, investors, and advisors who need a clear, data-driven picture of wood pulp dynamics in the United Kingdom.
FAQ
What is included in the wood pulp market in the United Kingdom?
The market size aggregates consumption and trade data, presented in both value and volume terms.
How are the forecasts to 2035 built?
The projections combine historical trends with macroeconomic indicators, trade dynamics, and sector-specific drivers.
Does the report cover prices and margins?
Yes, it includes export and import unit values, regional spreads, and a pricing outlook to 2035.
Which benchmarks are included?
The report benchmarks market size, trade balance, prices, and per-capita indicators for the United Kingdom.
Can this report support market entry decisions?
Yes, it highlights demand hotspots, trade routes, pricing trends, and competitive context.