Base data from the 2022 schizophrenia genome-wide association study
The summary statistics base dataset was derived from the latest peer-reviewed genome-wide association study for schizophrenia13. We used a file generated with the exclusion of samples from the UK Biobank to assure that the base and discovery files are independent. Following quality control; recommendations14, we ensured that the same genome was built with the discovery data (GRCh37/hg19), retained single-nucleotide polymorphisms (SNPs) with minor allele frequency >1% and INFO score >0.8, checked for duplicate SNPs and removed ambiguous SNPs. The final base file included 5,899,135 SNPs.
Discovery data from the UK Biobank genetic dataset
This study used data from the UK Biobank (application no. 102266). A full description of genotyping and imputation procedures of the UK Biobank data (https://www.ukbiobank.ac.uk/) is provided in the release documentation elsewhere38. Briefly, 487,409 blood samples were assayed using two customized tagSNP arrays (the Applied Biosystems UK BiLEVE Axiom Array and the Applied Biosystems UK Biobank Axiom Array; Affymetrix) with 95% shared markers, imputed to the UK10K and 1000 Genome Project phase 3 reference panels, with SHAPEIT339 used for phasing and IMPUTE240 used for imputation. Further data handling and quality control; steps were carried out according to a published processing pipeline41. To address population stratification, we retrieved ten genetic principal components from the UK Biobank. Specifically, after SNP extraction and alignment, conversion from bgen to PLINK format and removal of ambiguous SNPs (A/T, C/G: effects with allele frequencies between 0.4 and 0.6), data underwent an SNP-level quality control (minor allele frequency (MAF) 42, but we also excluded extreme myopic (spherical equivalent (SE) ≥−6 diopters) and hyperopic (SE ≤3 diopters) eyes43, as measured by a median SE value for each eye. Finally, individuals with an ICD-10 diagnosis (F20–F29), those who were medicated with antipsychotics and those who had missing data for the variables of interest or covariates were excluded from any further analysis. Table 1 presents details of the sample’s demographic and clinical characteristics. A Little’s missing completely at random test indicated that data were not missing completely at random (P 2 for details of participant inclusion and exclusion).
Polygenic risk scores calculations
In the main analysis, polygenic risk scores for schizophrenia were computed for each individual as a sum of risk alleles weighted by their estimated effect sizes44 using the ‘–score’ function in PLINK 2.0 (ref. 45). In addition, we generated five polygenic risk scores for schizophrenia for each individual, employing SNPs selected on the basis of their significance in association with the phenotype in the discovery genome-wide association study at nominal P value thresholds of 0.01 or less, 0.05, 0.1, 0.5 and 1.00.
Pathway-based polygenic risk scores and analysis
We prioritized pathways known to be associated with the disease or phenotype of interest based on previous studies18,19,20,21. Pathway polygenic risk scores were calculated by including only those SNPs that were relevant to the specific pathway under investigation and are also associated with schizophrenia. Pathway polygenic risk scores for schizophrenia were computed using PRSet14 in PRSice-244 for nine candidate gene sets selected from the Molecular Signatures Database version v2023.2 (https://www.gsea-msigdb.org/): acute inflammatory response (M6557), TGFβ signaling (M18933), chronic inflammatory response (M15140), positive regulation of dopamine receptor signaling pathway (M24111), WNT signaling pathway involved in midbrain dopaminergic neuron differentiation (M25305), WNT/β-catenin pathways (M17761), neuroinflammatory response (M24927), abnormal retinal vascular morphology (M43559) and premature coronary artery atherosclerosis (M36658). For more details, see ‘Gene pathways from the Molecular Signatures Database (MSigDB) version 7.4 utilized in pathway-based analysis’ in the Supplementary Information. A PRSet P value threshold was set at 1 owing to the limited number of SNPs in gene-set polygenic risk scores, potentially not accurately reflecting the entirety of gene sets. Both the self-contained P value and the competitive P value were obtained. Self-contained methods tested each gene set independently to determine if the genes within the set were associated with the phenotype of interest. This approach does not compare the gene set with the rest of the genome. The level of association reflected by self-contained methods is the degree to which the genes within the pathway are collectively associated with the phenotype, without considering genes outside of the pathway14. Competitive methods, on the other hand, compared the level of association between genes within a pathway and the rest of the genes in the genome. This approach tested whether the genes in the pathway are more associated with the phenotype than would be expected by chance, given the level of association observed in genes outside the pathway. Thus, this competitive method reflected signal enrichment by determining if the pathway stood out against the genomic background14. Both self-contained and competitive P values were calculated within PRSet through 10,000 permutations to generate null distribution curves for P values. The regression models consisted of thickness measures for the retinal nerve fiber layer, ganglion cell inner plexiform layer, inner nuclear layer, outer retinal thickness and all covariates. Human GRCh37 genome version was used as the background file.
Optical coherence tomography protocol and analysis
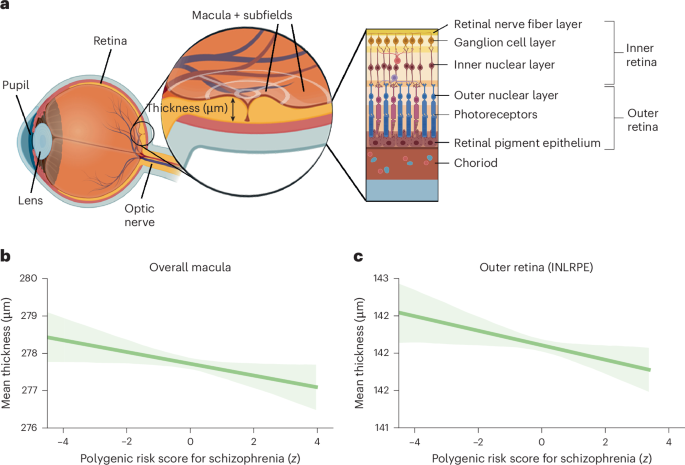
Optical coherence tomography images were acquired between the years 2009 and 2010 using a spectral domain optical coherence tomography device, with a raster scan protocol with a 6 × 6 mm area centered on the fovea, consisting of 128 B-scans each with 512 A-scans, completed in 3.7 s. Automated analysis of retinal thickness was performed using custom software developed by Topcon Advanced Biomedical Imaging Laboratory, which used dual scale gradient information for rapid segmentation of nine intraretinal boundaries, processing the images in approximately 120 s each. A comprehensive account of the standardized protocol employed for optical coherence tomography acquisition and the subsequent automated analysis of retinal thickness has previously been described46. In the current study, we focused on the macula as it contains multiple layers that, based on prior investigations, show thinning in individuals diagnosed with schizophrenia8,47,48.
Assessments of optical coherence tomography data
The normality of the distribution for each retinal phenotype was assessed by visual inspection. However, the tailedness of the distributions for each retinal phenotype data appeared to be skewed by outliers (see the diagonal in Supplementary Fig. 2). We also computed the Pearson correlation coefficients between retinal phenotypes (Supplementary Fig. 2).
Robust linear regression analysis
To account for potential outliers and heteroscedasticity observed in the retinal phenotype data, robust regression analysis was employed to examine the association between the polygenic risk scores for schizophrenia and macular phenotypes.
Robust linear regression uses M-estimation for robust linear modeling. M-estimators are a broad class of estimators in statistics that generalize maximum likelihood estimators, which are sensitive to outliers and violations of normality assumptions. The estimator used a Huber weight-function to down weight the influence of outliers and heavy-tailed distributions on the estimation of the model parameters49. We used the MASS::rlm package in R to conduct this robust analysis in which overall macular thickness was the dependent variable and polygenic risk scores for schizophrenia were the independent variable.
In this study, when reporting b, we always refer to the standardized regression coefficient, which represents the estimated change in the dependent variable for a one-unit change in the independent variable.
Confounding factors
We included a comprehensive set of covariates in a multiple linear regression analysis for studying the association between polygenic risk scores for schizophrenia and macular thickness in isolation. These were age and quadratic age terms, genetic sex, hypertension diagnosed as ICD-10 codes I10–15, diabetes mellitus diagnosed as ICD-10 codes E10–14, alcohol drinker status, BMI, smoking status, Townsend deprivation index, optical coherence tomography image quality, the type of genotyping array used and the first ten genetic principal components. The following rationales were applied for the inclusion of covariates: age is a fundamental factor in the development of diseases, including macular changes and schizophrenia50. Various retinal structures are also known to degenerate with age51,52. The inclusion of both linear and quadratic terms for age allow the model to capture not just a linear increase or decrease in risk or severity with age, but also any acceleration or deceleration in this trend. Furthermore, biological sex can influence the risk of developing various diseases, their progression and response to treatment53, and there is some evidence for sex differences in retinal structural parameters54. Hypertension can lead to hypertensive retinopathy, which results in blurred vision, reduced vision or even complete loss of sight if left untreated55. Likewise, diabetic retinopathy is a common microvascular complication of diabetes mellitus that can cause vision loss and blindness56. Furthermore, alcohol consumption is associated with open-angle glaucoma57.
Obesity, as indicated by BMI, is a well-known risk factor for a wide range of health conditions and is associated with retinal layer thickness50,58. Similarly, smoking has been linked to an increased risk of various diseases, including those affecting the eyes53.
The Townsend deprivation index in the UK Biobank reflects the socioeconomic status, which can influence health outcomes, including those related to ophthalmic health53.
The quality of optical coherence tomography images can influence the ability to detect macular changes. Different genotyping arrays can have varying levels of accuracy or might target different sets of genetic variations and thus affect the computation of polygenic risk scores59. Likewise, the first ten genetic principal components account for population stratification, which can confound genetic associations. Including them in our models helps to ensure that any associations found are not due to underlying population genetic differences50.
Statistical thresholding
Statistical significance for individual analyses was defined as P
Inflammatory biomarkers
The UK Biobank has meticulously recorded an array of inflammatory biomarkers between the years 2006 and 2010. Comprehensive details about their storage and analysis are available at the Biobank showcase. Peripheral blood cell counts, including lymphocyte, monocyte, neutrophil and platelet counts, were obtained using an automated Coulter LH 750 analyzer. The instrument’s differential blood cell count analysis provided calculated values for neutrophil, lymphocyte and monocyte counts, with an operating range of 0.00–900.00 × 10⁹ cells l−1. Platelet counts were obtained directly from instrument measurements, with an operating range of 0.00–5000 × 109 cells l−1. Using these peripheral blood cell counts, we derived four systemic inflammation markers: systemic immune-inflammation index (SII), neutrophil–lymphocyte ratio (NLR), platelet–lymphocyte ratio (PLR) and lymphocyte–monocyte ratio (LMR). The calculations for these markers were as follows: SII = (neutrophils × platelets)/lymphocytes, NLR = neutrophils/lymphocytes, PLR = platelets/lymphocytes and LMR = lymphocytes/monocytes (ref. 60). The measurement of serum CRP levels was carried out using a high- sensitivity immunoturbidimetric method on a Beckman Coulter AU5800 analyzer. In our analysis, we applied a logarithmic transformation to the CRP levels to address their notably skewed distribution, as illustrated in Supplementary Fig. 3.
Partial effect analyses
To visualize individual phenotypes, we computed the correlation coefficients between the polygenic risk scores for schizophrenia and overall macular thickness, while regressing out all confounding factors. Additionally, we extended this analysis to the combined thickness of the outer retinal layers of the macula.
Mediation analysis
We further sought to elucidate the mechanisms underlying the association between a pathway-enriched polygenic risk score for schizophrenia, specifically the neuroinflammatory pathway and inner and outer retinal thickness. Moreover, we investigated the potential mediating role of various inflammatory biomarkers in this relationship. The rationale for examining these markers as a mediator is grounded in the evidence linking neuroinflammatory processes to the pathophysiology of schizophrenia61,62. Increased levels of inflammatory biomarkers have been associated with increased risk and severity of schizophrenia, suggesting that inflammation may be a biological pathway through which genetic risk factors exert their effects on retinal phenotypes. To assess the mediation effect, we conducted a robust mediation analysis using two models. The mediator model was a robust linear regression that predicted inflammatory levels from neuroinflammatory-enriched polygenic risk for schizophrenia while controlling for the above-mentioned covariates. This model allowed us to estimate the effect of neuroinflammatory polygenic risk for schizophrenia on inflammatory biomarkers (path A). The outcome model was another robust linear regression that predicted ganglion cell inner plexiform layer thickness from both neuroinflammatory-specific polygenic risk for schizophrenia and markers, controlling for the same covariates. This model provided estimates for the direct effect of the neuroinflammatory-specific polygenic risk for schizophrenia on retinal thickness (path C) and the effect of inflammatory biomarkers on retinal thickness, while accounting for the neuroinflammatory-specific polygenic risk for schizophrenia (path B).
The indirect effect (path C′ = path A × path B), representing the mediation effect of inflammatory biomarkers, was calculated as the product of the coefficients from paths A and B. To evaluate the significance of the effect, we employed a bootstrap method with 1,000 resamples, generating empirical 95% CIs for the mediation effect. This nonparametric approach allowed us to infer the robustness of the mediation effect without relying on the assumptions of normality. The P value associated with this effect was computed through 95% CI inversion.
Since fasting significantly reduces the number of circulating monocytes63, we included fasting time as an additional covariate in this mediation analysis.
Inclusion and ethics
This study utilized data from the UK Biobank, a large-scale biomedical database and research resource containing in-depth genetic and health information from half a million UK participants. Ethical approval for the use of UK Biobank data was obtained from the North West Multi-center Research Ethics Committee. All participants provided informed consent, and data were anonymized to protect participant privacy. The research team adhered to the UK Biobank’s policies on data access and usage, ensuring compliance with ethical standards and legal requirements. The study design and analysis were conducted with a commitment to inclusivity to ensure broad applicability of the findings.
Reporting summary
Further information on the research design is available in the Nature Portfolio Reporting Summary linked to this article.