Principle of self-organized spatiotemporal QPM in microresonators
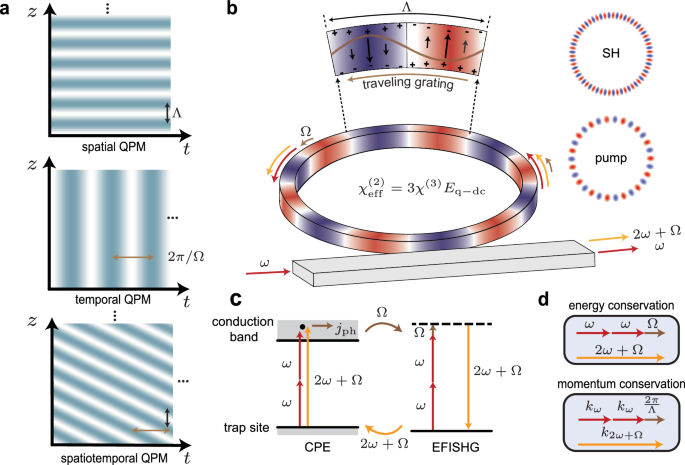
We begin by describing the photoinduced SHG in a Si3N4 microresonator (Fig. 1b). When both the pump and its second-harmonic (SH) are doubly resonant, the initial weak light within the SH resonance seeds the CPE, and the interference between single- and two-photon absorption processes generates an anisotropic coherent current8,9,24:
$${j}_{{{{\rm{ph}}}}}=\beta {({E}_{{{{\rm{pump}}}}}^{*})}^{2}{E}_{{{{\rm{SH}}}}}{e}^{\,i\Delta kR\phi }{e}^{-i{\psi }_{{{{\rm{ph}}}}}}+c.c.$$
(1)
where β and ψph are the photogalvanic coefficient and the interaction phase, respectively. Epump and ESH are the optical fields of the pump and its SH, with Δk = kSH − 2kpump the wavevector mismatch between them. ϕ denotes the azimuthal angle along the circumference of the microresonator with a radius of R. Both * and c.c. stand for complex conjugate.
The separation of charges via coherent current leads to the creation of a photoinduced electric field, while the concurrent drift current results in its decay. In the steady state, the photoinduced field can be expressed as E = − jph/σ(Ipump, ISH), with σ the conductivity which depends on the pump and SH light intensity Ipump and ISH, respectively. Notably, the wavevector mismatch between the inscribing optical fields renders a spatial modulation of the photoinduced electric field with a period Λ = 2π/Δk. Meanwhile, the electric field also imparts an effective χ(2) nonlinearity, i.e., \({\chi }_{{{{\rm{eff}}}}}^{(2)}=3{\chi }^{(3)}E\), thus giving rise to EFISHG. The generated SHG further enhances the CPE (Fig. 1c), forming a positive feedback loop that leads to the growth of SH, ultimately limited by the increase of the photoconductivity σ. Remarkably, when the SHG process is interrupted, the displaced charges maintain their spatial distribution owing to the insulating nature of Si3N4 in the absence of excited carriers. The inscription of a long-lasting nonlinear grating is confirmed by electric-field-sensitive etching11 and TPM imaging18,20.
To gather insights into the AOP dynamics in microresonators, we model the temporal dynamics of doubly resonant SHG with coupled-mode equations (CME) (see Eqs. (5) in Methods). The theoretical analysis provides two important results for efficient SHG by AOP (see Supplementary Note I):
-
The inscribed χ(2) grating is stable only when the generated SH (ωSH) lays on the blue side of the SH resonance (ωs), i.e., when the detuning of the SH light satisfies:
$${\omega }_{s}-{\omega }_{{{{\rm{SH}}}}}\approx {\delta }_{s}^{{\prime} } \,
(2)
where \({\delta }_{s}^{{\prime} }={\omega }_{s}-2{\omega }_{{{{\rm{pump}}}}}\) with ωpump the pump frequency. The approximation is valid as ωSH = 2ωpump + Ω with Ω/2π in the sub-kHz range, according to both the theoretical estimation and experimental observation.
-
The photoinduced grating exhibits a temporal oscillation with an angular frequency:
$$\Omega \approx \frac{{\kappa }_{s}}{2{\delta }_{s}^{{\prime} }\tau },$$
(3)
where κs is the linewidth of the SH resonance and τ is the intensity-dependent grating lifetime.
These results, together with the spatial periodic modulation, can be interpreted as a traveling χ(2) grating, as schematically shown in Fig. 1b. Such simultaneous spatial and temporal modulation of the χ(2) nonlinearity now arises from a quasi-static electric field in the microresonator:
$${E}_{{{{\rm{q}}}}{-}{{{\rm{dc}}}}} \sim {e}^{i\,\frac{2\pi }{\Lambda }R\phi -i\Omega t},$$
(4)
where the electric field travels along the ring circumference with a phase velocity v = ΩΛ/2π on the order of a few millimeters per second. Intuitively, the traveling nature of the grating can be understood as a consequence of its self-organized nature: as the SH field is a source of the photoinduced electric field and vice versa (see Eqs. (5) in Methods and also Supplementary Note I), these two fields can share an arbitrary phase relation with respect to the pump field, which takes the form of the time-dependent phase shift φ(t) = Ωt. In other words, the grating can travel due to the existence of an unconstrained degree of freedom between pump, SH field and photoinduced electric field.
An important consequence of these findings is that the traveling grating influences both momentum and energy matching, respectively related to the spatial and temporal modulation, as illustrated in Fig. 1d. While spatial QPM is well understood2, the energy modification related to its temporal counterpart can be regarded as a Doppler shift imparted by the traveling grating to the generated field. More generally, the phenomenology described here can be set in the framework of the generalized spatiotemporal QPM27,29, where the photoinduced SHG in a microresonator involves the scattering of the pump in a nonlinear photonic crystal. In our spatiotemporal QPM case (Fig. 1a bottom), during AOP the CPE organizes a traveling nonlinear grating that effectively doubles the frequency of the pump, with an additional frequency translation of Ω satisfying energy conservation.
Temporal characterization of spatiotemporal QPM
To verify our theoretical predictions, we experimentally investigate the temporal aspect of self-organized QPM. Fig. 2a shows the experimental setup (see “Methods”) used for measuring the frequency offset between the photoinduced SH generated from a Si3N4 microresonator and a reference SH generated from an external crystal. The Si3N4 microresonator used in this study has a radius of 158 μm (see “Methods”), and many of its TE00 resonances at the telecommunication C-band were found capable to generate SHG via AOP20. We perform nonlinear self-heterodyne measurements by recording the optical beating between the two generated SH fields in an electrical spectrum analyzer (ESA) (see “Methods”). This technique offers a 1 Hz resolution (defined by the resolution bandwidth (RBW) of the ESA) in measuring the possible frequency offset, and allows for the unambiguous determination of the exact photoinduced SH frequency. If only purely spatial QPM takes place, the beatnote frequency will be exactly twice of the modulation frequency owing to the SHG process. Otherwise, the presence of the traveling nonlinear grating would impart an additional frequency offset.
Fig. 2: Characterization of the photoinduced second-harmonic frequency offset.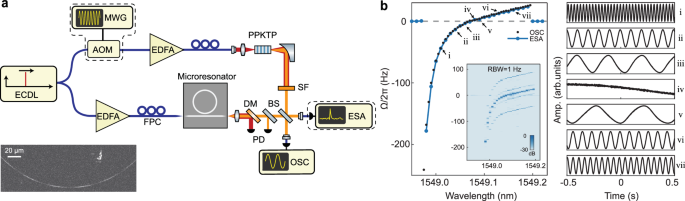
a Experimental setup for measuring the frequency offset between second-harmonics generated in a Si3N4 microresonator and a standard frequency doubler. ECDL: external-cavity diode laser; MWG: microwave generator; AOM: acousto-optic modulator; EDFA: erbium-doped fiber amplifier; PPKTP: periodically poled KTiOPO4 crystal; SF: spectral filter; FPC: fiber polarization controller; DM: dichroic mirror; PD: photodetector; BS: beam splitter; ESA: electrical spectrum analyzer; OSC: oscilloscope. Both self-homodyne measurements of temporal oscillations using an OSC (excluding dashed boxes) and self-heterodyne measurements of frequency spectra using an ESA are performed. The inset showcases a χ(2) nonlinear grating obtained using the two-photon microscopy after the microresonator is poled near the pump resonance at 1549.0 nm. The participating SH mode is TE30 inferred from the measured grating period. b Left: measured frequency offsets (blue dot-lines: self-heterodyne; black dots: self-homodyne) as functions of the pump wavelength when tuning the laser wavelength across the resonance at 1549.0 nm from blue to red side. The inset shows the spectral map on a logarithmic scale obtained from the self-heterodyne measurement with a 1 Hz resolution bandwidth (RBW) in ESA. Right: temporal oscillation traces measured by the self-homodyne technique for the data points indicated on the left panel (i-vii).
The left panel of Fig. 2b presents the steady state frequency offsets experimentally measured at different pump detunings for an AOP instance. In this case, the pump is tuned into the closest resonance near 1549.0 nm from the blue to the red side, and the participating SH mode is TE30 mode identified by TPM imaging (Fig. 2a inset). The offset frequencies are retrieved from the ESA spectra (inset). At each detuning, a clear single tone in the range of a few hundred Hz is measured for the frequency offset Ω/2π, while the electronic pickup signal is much weaker. Notably, the beatnote signal measured when SH is not generated from the microresonator, is resulted from the beating of the SHG of the weak residual pump and the frequency-shifted local oscillator in the crystal path only. This corresponds to the exact SHG process, serving as a frequency calibration for the offset frequency measurements. In addition, we repeat the experiment in a self-homodyne scheme and record the temporal traces in an oscilloscope (see “Methods”). In this case, we observe temporal oscillations after beating the SH lights, which precisely replicate the trend recorded with the ESA, as shown in Fig. 2b. We note that the frequency offset trace here crosses zero near 1549.08 nm, deviating from the theoretical prediction (Eq. (3)). We attribute this behavior to possibly the perturbation from a neighboring SH mode to the SHG process (see Supplementary Note II).
Dynamics of photoinduced SHG
To delve deeper into the dynamics of self-organized spatiotemporal QPM in the Si3N4 microresonator, we perform experiments for several other resonances at C-band that support efficient SHG (see “Methods”). The experimental results can be generally divided into two main cases, depending on the relative red-shift rates of pump and SH resonances while varying the pump wavelength. Two illustrative experimental examples are provided in Fig. 3a, c. In what we call the ‘leading case’ (Fig. 3a), the wavelength at which the maximum absolute value of the frequency offset Ω occurs at the leading edge of the generated SH power trace, and the SH power continuously decreases as the pump is further tuned into the resonance. We use the vector network analyzer (VNA) technique to probe both the pump and SH detunings (see Methods)20. The SH resonance is observed to shift away from the generated SH frequency when decreasing the pump frequency (top panel of Fig. 3a). The underlying dynamic doubly-resonant condition is schematically shown in Fig. 3e, where the SH resonance shift rate is regarded as larger than twice the one of the pump resonance (dλs/dλpump − 2dλp/dλpump > 0), considering both thermal and Kerr effects. Initially (stage I), the SH resonance is blue-detuned with respect to the doubled frequency of pump, violating the necessary detuning condition (Eq. (2)) and thereby no SH generation is possible. Once the detuning condition is met (stage II), the AOP process is triggered with sufficient pump power, the χ(2) grating is inscribed and the generated SH power is suddenly increased. Besides, the VNA response also suddenly appears. Note that, given the relation between the frequency offset and SH detuning (Eq. (3)), this minimal detuning condition not only leads to nearly the maximum generated SH power but also the largest frequency shift. The experimental results are in good agreement with our theoretical prediction. When the pump wavelength is further increased (stages III-IV), the pump detuning reduces slightly but the SH detuning increases significantly (see the VNA response map, where the indicated peak positions approximately correspond to \(| {\delta }_{p}^{{\prime} }|\) and \(| {\delta }_{s}^{{\prime} }|\)20), explaining the drop of generated SH power accompanied by the decrease in the frequency offset. In the final stage V, the SHG vanishes after the pump gets out of its resonance.
Fig. 3: Dynamics of photoinduced second-harmonic generation.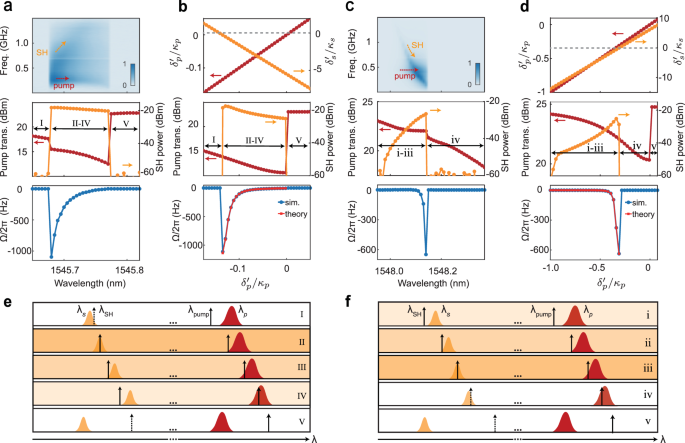
a, c Experimental investigations of photoinduced SHG processes for (a) the leading and (c) trailing cases. They correspond to the scenarios where the generated SH power decreases and increases with the pump tuning into its resonance, respectively. Top: effective detunings of the pump and SH resonances measured by a vector network analyzer; Middle: Measured pump transmission and generated SH power; Bottom: Measured frequency offset as a function of the pump wavelength. b,d, Numerical simulations of photoinduced SHG processes for the leading (b) and trailing (d) cases. Top: simulated effective detunings of the pump and SH resonances (the gray dashed lines denote \({\delta }_{s}^{{\prime} }=0\)); Middle: simulated pump transmission and generated SH power; Bottom: simulated and theoretically predicted frequency offsets as functions of the effective detuning. e,f, Schematics of dynamic doubly resonant conditions for the leading (e) and trailing (f) cases. During pump wavelength tuning from stage I to IV or i to iv, the pump (λpump) stays thermally locked to the blue side of its resonance (λp), while the SH resonance (λs) varies its relative position from the generated SH wavelength (λSH). The leading (trailing) case corresponds to the scenario where the red-shift rate of the SH resonance is two times larger (smaller) than that of the pump resonance when tuning the pump into its resonance. The intensity of the background color indicates the power of the generated SH. At stage V and v, the pump exists the resonance.
A different behavior is observed in the ‘trailing case’ (Fig. 3c). In this case, we observe that the SH resonance approaches the generated SH frequency while increasing the pump wavelength (see the VNA response map). This phenomenology can be attributed to the smaller red-shift rate of the SH mode compared to that of the pump (dλs/dλpump − 2dλp/dλpump 2) is promptly satisfied at the beginning of the pump wavelength tuning. The AOP process is therefore triggered as soon as the threshold pump power (see Supplementary Note I) is reached at stage i, even if the detuning conditions for pump and SH are not optimal. When the pump is further tuned closer to the resonance (stages ii–iii), the generated SH power grows significantly, owing to the increased proximity to the doubly-resonant condition (Fig. 3f). The maximum generated SH power is reached in correspondence with the maximum absolute frequency shift. Further, in the early phase of stage iv, the SH power undergoes a sudden drop as \({\delta }_{s}^{{\prime} }\geqslant 0\), therefore the inscribed nonlinear grating is quickly erased preventing the sustained generation of SH.
To corroborate our interpretation, we replicate our experimental findings through numerical integration of our CME model (see Eqs. (5) in Methods and Supplementary Note I). For simplicity, we set the effective detunings at pump and SH to change linearly in the simulation, in qualitative agreement with the behavior retrieved from the experimental VNA maps. In the simulation, we intentionally set the pump power to zero when the pump is out of resonance (\({\delta }_{p}^{{\prime} }\geqslant 0\)), to replicate the experimental triangular-shaped pump transmission30. The changes in detunings result in the corresponding variations in the pump transmission, generated SH power and also the frequency offset. Figure 3b and d show the simulation results corresponding to the ‘leading’ and ‘trailing’ cases, respectively. Numerically we confirm again that the SH can only be generated when the detuning satisfies the condition Eq. (2). A small discrepancy between simulation and experiment is the jumps in the pump transmission, typically observed when the χ(2) grating is inscribed (erased). Such jumps may be attributed to the change of the pump detuning due to the sudden presence (disappearance) of strong SH inside the microresonator31.