Enhanced magnetic transition temperatures under low pressures
The hydrostatic pressure was applied to the samples using a diamond-anvil cell (DAC) technique, which allowed us to achieve pressures of up to 20 GPa. Initially, NiI2 flakes (50–100 nm) were mechanically exfoliated and then delicately transferred onto the culet of the diamond using a dry transfer method28. Subsequently, we introduced a pressure-transmitting medium, namely silicone oil, into the gasket blanks. The DAC was assembled by aligning and securing the two diamonds with four screws. Notably, this entire procedure was conducted within a nitrogen-filled glove box to prevent any degradation of the samples.
Temperature-dependent Raman measurements and polarization-sensitive second harmonic generation (SHG) were carried out in a back-reflected geometry under applied pressures, capitalizing on the excellent transparency and low polarization response of diamond. These techniques were significant in determining the magnetic transition temperatures. The Raman measurements allowed us to extract the intensity evolution of the phonon mode related to collinear antiferromagnetic orders as temperatures varied and ascertain the transition temperature. Additionally, polarization-resolved and temperature-dependent SHG spectra were obtained to probe the inversion-symmetry-breaking features of the spin structure under pressure, yielding insights into the transition temperature to the helimagnetic state. (For detailed information regarding the experimental setup, please refer to the “Methods” section and Fig. S1.)
We conducted temperature-dependent Raman measurements on a NiI2 flake, utilizing an excitation centered at 1.96 eV. Under ambient pressure, six distinct Raman peaks were observed at 15 K (Fig. S2), in line with previously reported findings in the literature25. Of particular interest is the Raman mode (P3) at 120 cm−1, where its intensity displays a significant temperature dependence. Specifically, the intensity gradually reduces as the temperature increases, ultimately vanishing between the Néel temperature transition points (TN1 and TN2). To verify the origin of the 120 cm−1 Raman mode, we conducted Raman measurements on NiI2 flakes under an out-of-plane magnetic field of up to 8 T (the results are shown in Fig. S3). Surprisingly, we did not observe any shift or splitting in this mode, suggesting it is not a magnon mode. The possible origin of this peak appears to be zone folding due to the presence of antiferromagnetic order. As described in ref. 20, NiI2 exhibits a canted interlayer antiferromagnetic structure with ferromagnetic alignment within layers below TN1. This magnetic arrangement induces Brillouin zone folding along the z-direction by the magnetic cell doubling, thereby making the specific Raman modes active. However, further experiments, such as high-resolution Raman scattering under controlled magnetic fields, are required to fully elucidate the origin of the 120 cm−1 mode. Nevertheless, Raman measurements provide a reliable means to estimate the Néel temperature, despite a slightly lower temperature reading compared to values obtained through thermodynamic measurements.
Figure 2a–f provides a visual representation of our temperature-dependent Raman results under various hydrostatic pressures. At 15 K, two phonon modes (P1 and P2) and a zone-folded phonon mode (P3) exhibit a linear blueshift as pressure increases (Figs. 2g and S4), an effect attributed to enhanced interlayer coupling. Importantly, the absence of new Raman peaks indicates the structural stability of the crystal below 13 GPa. However, it is worth noting that as reported in references29,30,31, the structure of NiI2 begins to collapse when the pressure exceeds 19 GPa. The temperature-dependent integrated intensity of the P3 peak under varying pressure conditions is plotted in Fig. 2h. Notably, our observations reveal the remarkable resilience of the zone-folded phonon signals even under elevated pressures and increased temperatures. For instance, at 2.7 GPa, the P3 peak persists at 100 K, and it continues to endure at 115 K under 4.4 GPa, and at 135 K under 6.0 GPa. Surprisingly, at even higher pressures, such as 7 and 8.6 GPa, the P3 peak remain discernible, with their transition temperature showing a remarkable increase, reaching 155 K at 7 GPa and 200 K at 8.6 GPa. It underlines the robustness of the antiferromagnetic state, illustrating its resilience against the influence of pressure. In the ref. 29, the pressure-induced enhancement of the magnetic transition temperature has also demonstrated using Mössbauer spectroscopy, where the Néel temperature increased to 310 K at 19 GPa. This phenomenon has also been reported in other vdW magnets, such as CrSi(Ge)Te332,33.
Fig. 2: Raman spectra of NiI2 under different pressures.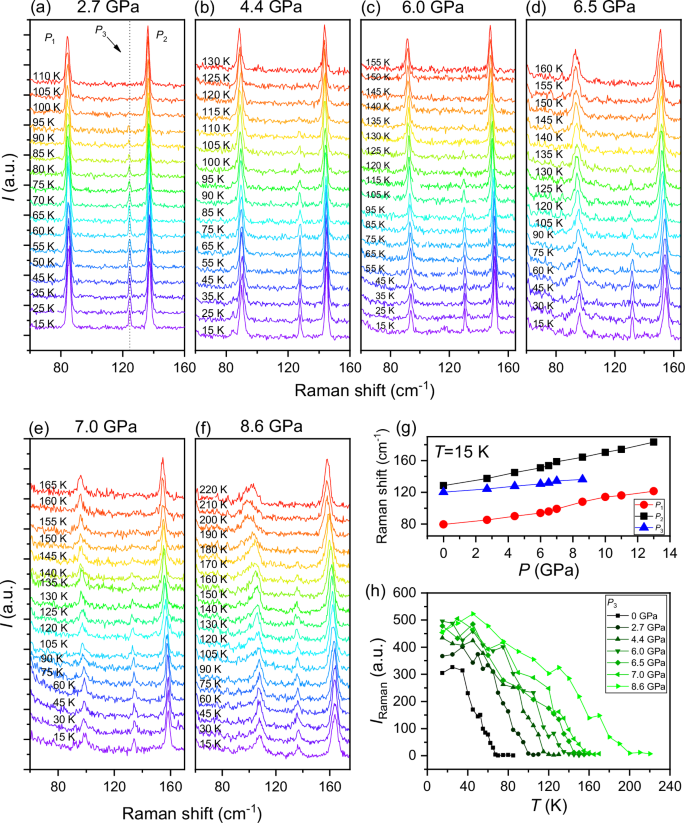
a–f Raman spectra of NiI2 flake at different temperatures under various pressures, e.g., 2.7, 4.4, 6.0, 6.5, 7.0, and 8.6 GPa. The dotted line in (a) indicates the peak of the zone-folded phonon mode (P3). g Raman shifts of P1, P2, and P3 peaks as a function of pressure. h The integrated intensity of P3 peak as a function of temperature under 0, 2.7, 4.4, 6.0, 6.5, 7.0, and 8.6 GPa, respectively.
At room temperature and atmospheric pressure, NiI2, characterized by a centrosymmetric space group, inherently exhibits an electric-dipole forbidden second harmonic generation (SHG). However, below the Néel temperature TN2, a phase transition occurs, leading to the emergence of helimagnetic orders. This transition signifies the breaking of both spatial inversion and time-reversal symmetries, thereby enabling SHG induced by magnetism. We observe a distinct and robust SHG signal at temperatures below 59 K (Fig. S5a), reaching magnitudes up to two orders of magnitude greater than those observed at elevated temperatures. This pronounced SHG signal indicates the presence of a helical spin structure beneath the transition temperature, a characteristic that is consistent with the transition temperature TN2 determined by the magnetic susceptibility measurement. Moreover, the polarization-dependent SHG measurement shows that the SHG intensity at 15 K reveals a strong signal in the XY configuration, manifesting as a distorted “8” pattern, while the XX configuration exhibits a relatively weaker signal characterized by a distorted butterfly pattern. Here, the XX and XY configurations indicate that the orientation of the SHG signal is parallel and perpendicular to the polarization of the incident light, respectively. Both SHG patterns unveil a two-fold symmetry in NiI2 induced by the contribution of both electric and magnetic dipoles below TN2 (Fig. S5b), indicating a mirror symmetry breaking. Furthermore, the polarization-dependent SHG at 65 K reveals a distinctive six-fold rotational symmetry under high-power excitation (Fig. S5b). This symmetry reflects a C3 symmetry, signifying that NiI2 has transitioned to a collinear antiferromagnetic order characterized by spatial inversion symmetry. It may originate from the quadrupole term and surface electric dipole term. Consequently, SHG measurements serve as a valuable tool for delineating the phase transition from helimagnetic to collinear antiferromagnetic states.
Figure 3a presents the SHG signal intensity as a function of temperature under seven constant hydrostatic pressures. At 2.7 GPa, the SHG signal intensity undergoes a gradual change as the temperature increases from 15 to 65 K. However, it experiences a rapid and significant decrease, approaching a minimum at approximately 90 K. This shift corresponds to a remarkable alteration, with a maximum-to-minimum intensity ratio of approximately 30:1 during the temperature rise. Consequently, we can roughly identify this point as the transition temperature marking the phase transition from the helimagnetic to antiferromagnetic states under pressure. Specifically, at 2.7 GPa, this transition temperature is found to be around 90 K, surpassing the 59 K recorded under atmospheric pressure. Elevating the pressure to 4.4 and 6.0 reveals a similar temperature-dependent SHG signal curve, accompanied by a corresponding increase in the transition temperature (as shown in Fig. 3a). The maximum transition temperature is determined to be 125 K at 6 GPa.
Fig. 3: SHG in NiI2 under different pressures.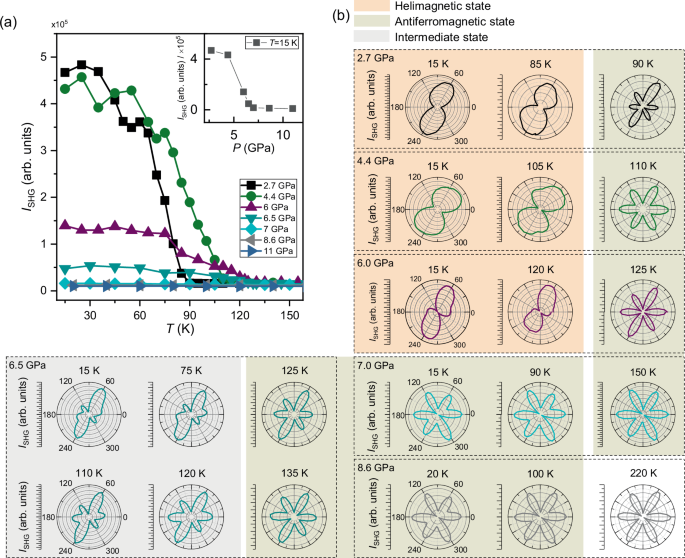
a Temperature-dependent SHG intensity in a NiI2 flake at seven fixed hydrostatic pressures, e.g., 2.7, 4.4, 6.0, 6.5, 7.0, 8.6, and 11.0 GPa. The inset shows the pressure dependence of the SHG intensity at approximately 15 K. b Angular-resolved SHG patterns for temperatures below and above the helimagnetic transition temperature at the six representative hydrostatic pressures. Here, the orange, green, and gray regions represent the helimagnetic state (HM), antiferromagnetic state (AFM) and intermediate state (IMS), respectively.
Beyond the SHG signal intensity, the SHG pattern also serves as a distinctive indicator for distinguishing between helimagnetic and antiferromagnetic states. To clarify the symmetric information, we only focus on the XY component in the polarization-dependent SHG measurement. As displayed in Fig. 3b, the XY component of the polarization-resolved SHG spectrum retains a distorted “8” pattern at both 15 K and 85 K under 2.7 GPa pressure. This signifies a two-fold symmetry that persists at lower pressures. However, at 90 K, the SHG pattern undergoes a transformation, displaying a distorted six-petal pattern indicative of C3 symmetry. It’s worth noting that the distortion may be influenced by the weak polarization response of the diamond under pressure. Thus, the transition temperature (TN2) is determined to be 87.5 ± 2.5 K for NiI2 under 2.7 GPa pressure, consistent with the value derived from the intensity-temperature relationship. At both 4.4 and 6 GPa in Fig. 2b, a noticeable difference in the SHG pattern remains evident as the temperature increases. Consequently, the transition temperature is approximated to be 107.5 ± 2.5 K at 4.4 GPa and 122.5 ± 2.5 K at 6 GPa, allowing for the identification of the maximum transition temperature from the helimagnetic to antiferromagnetic states via the SHG patterns.
Pressure-induced magnetic phase transition from HM to AFM
Remarkably, as we escalate the pressure to 7 GPa, the intensity of SHG decreases by an order of magnitude from 4.67 × 10⁵ at 2.7 GPa to 0.16 × 10⁵ at 7 GPa at around 15 K (the inset of Fig. 3a), while the excitation intensity remains unchanged. Beyond this point, the SHG intensity remains at its lowest value up to 11 GPa. Meanwhile, the SHG intensity at high pressures (>7 GPa) is comparable to that observed at high temperatures under low pressures (3a). This intriguing temperature independence is sustained even when the pressure is further raised to 8.6 and 11 GPa. To further confirm the disappearance of helimagnetic order, we also examined the SHG pattern at 7 GPa. As depicted in Fig. 3b, a distinct distorted six-petal pattern is evident for selected temperature points, including 15, 90, and 150 K. This pattern markedly differs from the previously observed distorted “8” pattern characterizing the helimagnetic state. It is noted that the distortion of SHG pattern is attributed to the interlayer sliding under high pressures, which is characteristic of typical layered materials34. Moreover, at this pressure, the zone-folded phonon (P3) as shown in Fig. 2e remains observable. Hence, this transition indicates the vanishing or complete suppression of the helimagnetic state at approximately 7 GPa, with a subsequent transformation into a collinear antiferromagnetic. The same experimental phenomenon can be observed at 8.6 GPa (Fig. 3b). This further confirms a phase transition from the helimagnetic to the collinear antiferromagnetic states at high pressures. At 6.5 GPa, a notable shift is observed in the maximum-to-minimum intensity ratio of the SHG signal, reducing significantly to 4:1. It is notably lower than the value observed at 2.7 GPa. Furthermore, the SHG pattern at 15 K deviates from its previously distorted ‘8’ pattern, exhibiting a combination of ‘8’ and six-petal patterns. One possible explanation could be the coexistence of AFM and helimagnetic phases due to uneven pressure distribution around the phase transition point. Alternatively, the deviation may originate from an intermediate state between the helimagnetic and AFM states. We fitted the SHG pattern at 6.5 GPa and compared it with that at atmospheric pressure, as shown in Fig. S6. From these results, it is evident that the magnetic dipole term is significantly affected by the applied pressure, while the electric dipole term remains largely unchanged. This suggests that the applied pressure may significantly influence the exchange interaction, which is crucial for determining the intermediate state. The detailed magnetic structure could be clarified through the neutron scattering measurements under pressure. These alterations strongly indicate the transition from a helimagnetic to an antiferromagnetic state has occurred at this critical pressure.
As the pressure surpasses 10 GPa, the P3 peak becomes undetectable (Fig. S4), possibly due to a reduction in the charge transfer gap that shifts the optical transitions away from the excitation wavelength35,36,37. It is noteworthy that antiferromagnetic order can persist up to 19 GPa, with an enhanced Néel temperature of 310 K, as revealed by Mössbauer spectroscopy in ref. 29. At 11 GPa, our SHG patterns, as depicted in Fig. S7, exhibit a consistent distorted six-petal pattern across the temperature range of 20–200 K, indicating the likely presence of a collinear antiferromagnetic state. In Fig. 4, we compile a comprehensive phase diagram outlining the transition from the helimagnetic state (TN2) to the antiferromagnetic state (TN) under varying pressures. Below 6 GPa, the transition temperature for the helimagnetic state (open green circles) exhibits a gradual ascent to 122.5 K with increasing pressure before transforming into an antiferromagnetic state at around 7 GPa. This transition is accompanied by an intermediate state (IMS in Fig. 4) between two pressures. Furthermore, the antiferromagnetic state endures at around 190 K under 8.6 GPa pressure from our Raman findings (purple triangles in Fig. 4). From ref. 29, the actual transition from antiferromagnetic to paramagnetic state can increase to 216 K at around 8.3 GPa. Importantly, upon releasing the pressure to 2 GPa, the reappearance of the distorted “8” pattern below 81 K (as shown in Fig. S8) underscores the pressure-controlled transition between the helimagnetic and antiferromagnetic states. This novel capability to modulate the helimagnetic state transition via pressure holds the promise of advancing innovative functional devices driven by external forces.
Fig. 4: Magnetic phase diagram of NiI2.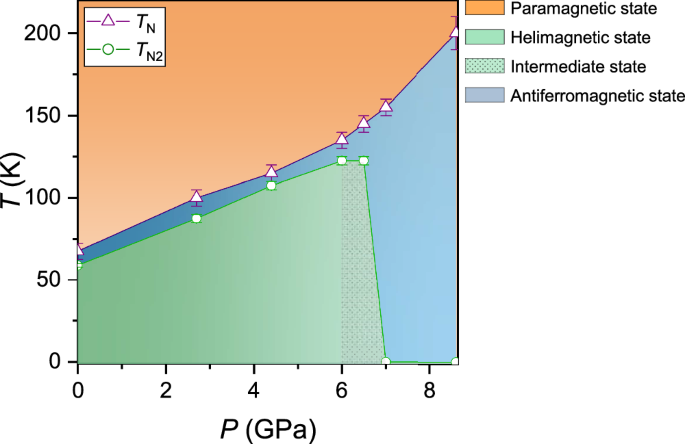
The magnetic phase diagram of the NiI2 flake as a function of pressure and temperature. TN and TN2 are obtained from Raman and SHG measurements, respectively. Here, the orange, green region, blue, and gray regions represent the paramagnetic (PM), helimagnetic (HM), antiferromagnetic (AFM) and intermediate (IMS) states, respectively.
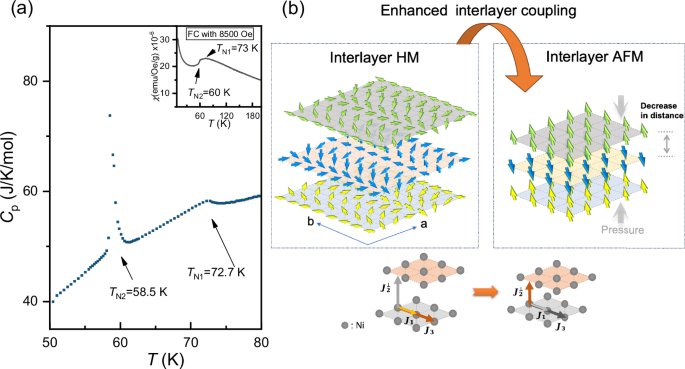
Monte Carlo (MC) simulations were conducted to investigate the response of the magnetic properties of NiI2 to external pressure. Our simulation incorporates consideration of the intralayer nearest-neighbor interaction (\({J}_{1}\)), the intralayer next-next-nearest neighbor interaction (\({J}_{3}\)), and interlayer next-nearest neighbor interaction (\({J}_{2}^{\perp }\)) as defined in ref. 38. Other small exchange interactions estimated in DFT are also added and fixed during our simulation. Detailed information regarding the simulation methodology can be found in the “Method” section. At ambient pressure, the helimagnetic ground state, as indicated by the HL2 (Fig. S9), is attained due to the competition between the intralayer FM interaction \({J}_{1}\) and the AFM interaction \({J}_{3}\)38. In this state, spins rotate within the canted Ni2I2 plane with a propagation vector Q ≈ (1/7, 0, 3/2), as depicted in Figs. 1b and S9. The spin configuration of the helimagnetic states is sensitive to the competition between \({J}_{1}\), \({J}_{3}\), and the intralayer interactions \({J}_{2}^{\perp }\). Varying the interlayer and intralayer interactions has yielded other helimagnetic states, denoted as HL1, HL3, and HL4 (Fig. S9), with corresponding propagation vectors (1/14, 1/14, 1/2), (1/14, 6/7, 0.5), and (0, 13/14, 0.5), respectively. Remarkably, the AFM (Figs. S9–S11) state can emerge as the dominant magnetic ground state when the interlayer interaction is strengthened, as indicated in the deep blue region of Fig. 5. It differs from the MC simulation in ref. 38 in which only the helimagnetic states are revealed under high pressure. To incorporate the DFT results of the magnetic interactions38 into our phase diagram, we scale the DFT values of \({J}_{3}\) by a factor 0.82\({J}_{3}\) to align with our high-pressure experimental results of the magnetic transition from the helimagnetic states to the AFM state. The DFT simulation may overestimate \({J}_{3}\), regarding to the fact that the MC phase boundary is sensitive to the magnetic interaction parameters. In Fig. 5, the DFT results with the scale (0.82\({J}_{3}\)) indicate that the exchange interaction parameter at ambient pressure resides within the HL2 region. However, at pressures of 5 and 10 GPa, the results shift to the HL4 and AFM regions, respectively. This suggests that pressure induces concurrent increases in both the intralayer interaction \({J}_{3}\) and the interlayer interaction \({J}_{2}^{\perp }\), thereby causing a transition in the magnetic ground state from HL2 to eventual AFM under high-pressure conditions. This observation aligns with experimental findings, which note a transition to the AFM state above 7 GPa hydrostatic pressure. Of significant note, if the interlayer interaction remains constant and only the intralayer interaction \({J}_{3}\) is intensified, the magnetic state transitions exclusively from HL2 to HL1, without the potential to reach the AFM state. Consequently, we discern the substantial impact of the second-nearest neighbor interlayer interaction \({J}_{2}^{\perp }\), which competes with intralayer frustration and favors the AFM state. Additionally, MC simulations also indicate that under pressure, the sample undergoes transitions through the HL3 and HL4 states before ultimately reaching the AFM state. This observation suggests that these states with varying wave vectors (q) may serve as intermediate states, a notion supported by the SHG observation around 6.5 GPa, as depicted in Fig. 3b.
Fig. 5: Magnetic states of NiI2.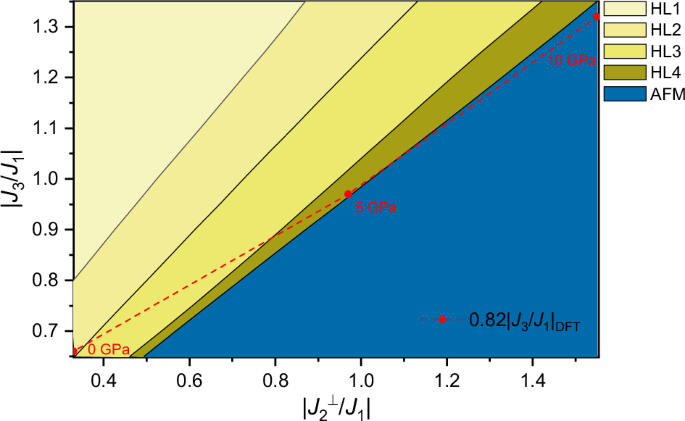
Phase diagram encompassing all the magnetic states (HL1, HL2, HL3, HL4, and AFM, as described in Fig. S9) with differing intralayer and interlayer exchange interactions. HL2 is identified as the helimagnetic ground state for NiI2 at low temperature. The red data points represent the exchange interaction under pressure, sourced from DFT calculations in ref. 38.
In this study, we have presented a comprehensive investigation of the helimagnetic state of NiI2 flakes under pressure using in situ high-pressure SHG and Raman spectroscopies. Our findings demonstrate a significant magnetic phase transition occurring at approximately 7 GPa, transitioning from a helimagnetic to antiferromagnetic state, accompanied by a marked increase in the magnetic transition temperature for both states. Our MC simulation and reported DFT results reveal a rapid strengthening of the interlayer second nearest-neighbor interaction under pressure, surpassing the intralayer exchange interaction. This change in interaction dynamics is pivotal, as it drives the transition from a helimagnetic to an antiferromagnetic state. The findings presented here have significant implications for understanding the fundamental properties of 2D magnetic materials and pave the way for their potential applications in next-generation magnetic devices.