May 18, 2025
IndexBox has just published a new report: Australia – Carboys, Bottles And Similar Articles Of Plastics – Market Analysis, Forecast, Size, Trends and Insights.
The article discusses the rising demand for plastic carboys, bottles, and similar articles in Australia, leading to a projected increase in market volume and value by 2035. Despite a deceleration in market performance, the industry is forecasted to maintain growth with a CAGR of +0.1% in volume and +0.7% in value from 2024 to 2035.
Market Forecast
Driven by increasing demand for carboys, bottles and similar articles of plastics in Australia, the market is expected to continue an upward consumption trend over the next decade. Market performance is forecast to decelerate, expanding with an anticipated CAGR of +0.1% for the period from 2024 to 2035, which is projected to bring the market volume to 35K tons by the end of 2035.
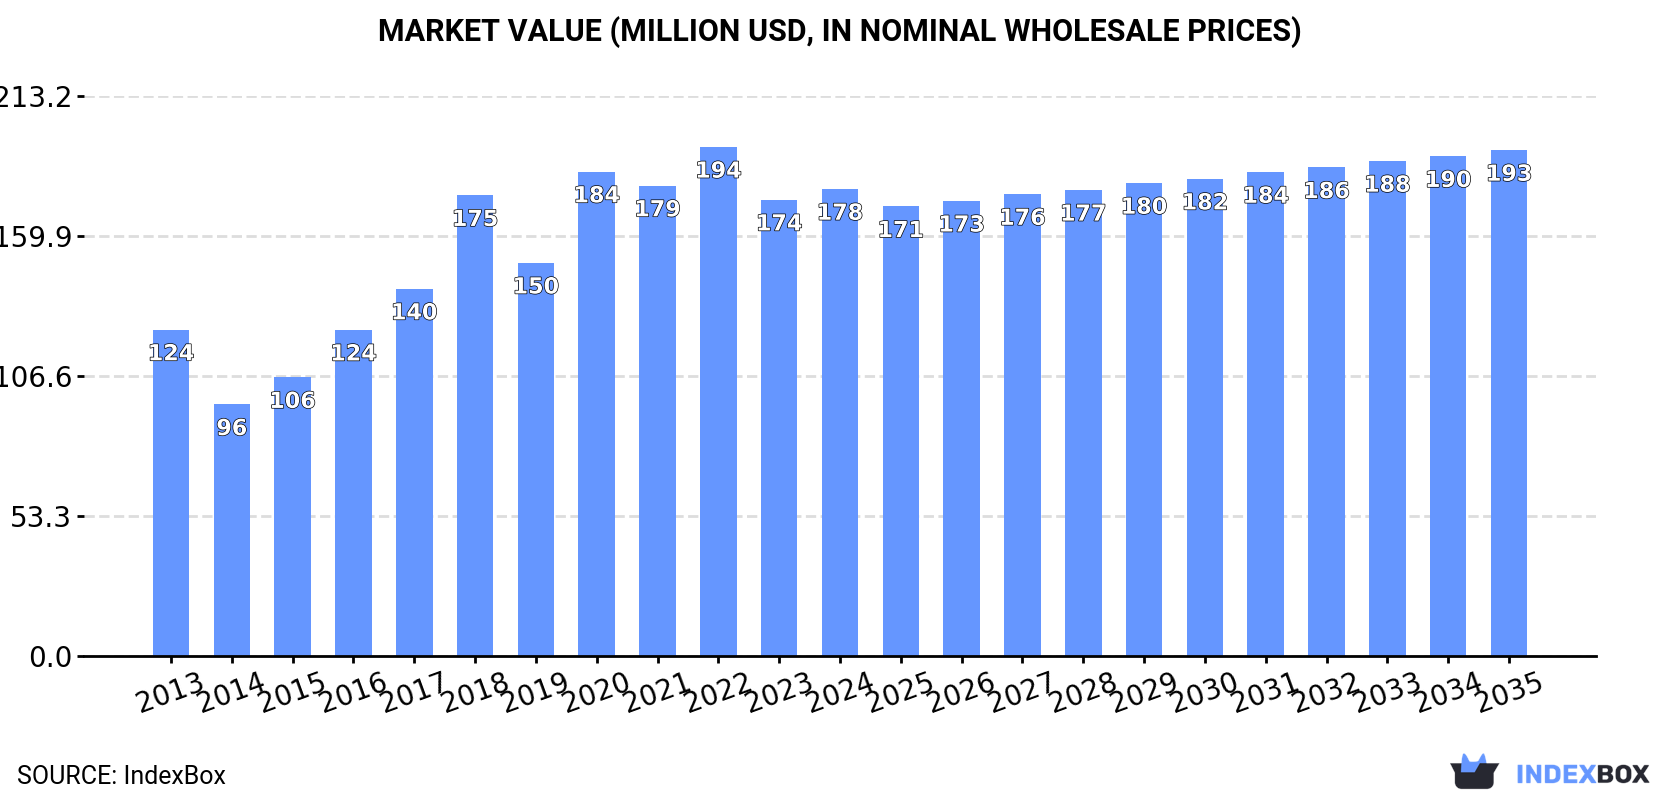
In value terms, the market is forecast to increase with an anticipated CAGR of +0.7% for the period from 2024 to 2035, which is projected to bring the market value to $193M (in nominal wholesale prices) by the end of 2035.
 ConsumptionAustralia’s Consumption of Carboys, Bottles and Similar Articles of Plastics
In 2024, consumption of carboys, bottles and similar articles of plastics was finally on the rise to reach 35K tons after three years of decline. In general, the total consumption indicated a notable increase from 2013 to 2024: its volume increased at an average annual rate of +2.1% over the last eleven years. The trend pattern, however, indicated some noticeable fluctuations being recorded throughout the analyzed period. Based on 2024 figures, consumption decreased by -8.9% against 2020 indices. Over the period under review, consumption attained the maximum volume at 39K tons in 2020; however, from 2021 to 2024, consumption stood at a somewhat lower figure.
The value of the plastic bottle market in Australia was estimated at $178M in 2024, rising by 2.4% against the previous year. This figure reflects the total revenues of producers and importers (excluding logistics costs, retail marketing costs, and retailers’ margins, which will be included in the final consumer price). Over the period under review, the total consumption indicated a moderate expansion from 2013 to 2024: its value increased at an average annual rate of +3.3% over the last eleven years. The trend pattern, however, indicated some noticeable fluctuations being recorded throughout the analyzed period. Based on 2024 figures, consumption decreased by -8.3% against 2022 indices. Over the period under review, the market attained the maximum level at $194M in 2022; however, from 2023 to 2024, consumption stood at a somewhat lower figure.
ProductionAustralia’s Production of Carboys, Bottles and Similar Articles of Plastics
In 2024, the amount of carboys, bottles and similar articles of plastics produced in Australia rose to 14K tons, with an increase of 1.5% compared with 2023 figures. In general, production, however, continues to indicate a perceptible contraction. The pace of growth appeared the most rapid in 2018 when the production volume increased by 30%. Over the period under review, production hit record highs at 18K tons in 2013; however, from 2014 to 2024, production stood at a somewhat lower figure.
In value terms, plastic bottle production fell slightly to $74M in 2024 estimated in export price. Over the period under review, the total production indicated a mild increase from 2013 to 2024: its value increased at an average annual rate of +1.0% over the last eleven years. The trend pattern, however, indicated some noticeable fluctuations being recorded throughout the analyzed period. Based on 2024 figures, production increased by +47.5% against 2019 indices. The most prominent rate of growth was recorded in 2020 with an increase of 33%. Plastic bottle production peaked at $75M in 2023, and then declined in the following year.
ImportsAustralia’s Imports of Carboys, Bottles and Similar Articles of Plastics
In 2024, overseas purchases of carboys, bottles and similar articles of plastics increased by 5% to 24K tons for the first time since 2020, thus ending a three-year declining trend. Over the period under review, total imports indicated perceptible growth from 2013 to 2024: its volume increased at an average annual rate of +3.6% over the last eleven-year period. The trend pattern, however, indicated some noticeable fluctuations being recorded throughout the analyzed period. Based on 2024 figures, imports decreased by -7.2% against 2020 indices. The growth pace was the most rapid in 2018 when imports increased by 28%. Over the period under review, imports reached the maximum at 25K tons in 2020; however, from 2021 to 2024, imports remained at a lower figure.
In value terms, plastic bottle imports reached $120M in 2024. Overall, total imports indicated a tangible increase from 2013 to 2024: its value increased at an average annual rate of +4.9% over the last eleven years. The trend pattern, however, indicated some noticeable fluctuations being recorded throughout the analyzed period. Based on 2024 figures, imports decreased by -8.3% against 2022 indices. The pace of growth was the most pronounced in 2017 when imports increased by 19% against the previous year. Imports peaked at $130M in 2022; however, from 2023 to 2024, imports stood at a somewhat lower figure.
Imports By Country
In 2024, China (13K tons) constituted the largest supplier of plastic bottle to Australia, accounting for a 54% share of total imports. Moreover, plastic bottle imports from China exceeded the figures recorded by the second-largest supplier, Belgium (2.9K tons), fourfold. Vietnam (1.7K tons) ranked third in terms of total imports with a 7.1% share.
From 2013 to 2024, the average annual growth rate of volume from China stood at +7.0%. The remaining supplying countries recorded the following average annual rates of imports growth: Belgium (+39.0% per year) and Vietnam (+18.2% per year).
In value terms, China ($68M) constituted the largest supplier of carboys, bottles and similar articles of plastics to Australia, comprising 57% of total imports. The second position in the ranking was taken by Belgium ($8.7M), with a 7.3% share of total imports. It was followed by New Zealand, with a 4.8% share.
From 2013 to 2024, the average annual rate of growth in terms of value from China amounted to +6.8%. The remaining supplying countries recorded the following average annual rates of imports growth: Belgium (+36.4% per year) and New Zealand (-2.4% per year).
Import Prices By Country
The average plastic bottle import price stood at $5,080 per ton in 2024, approximately reflecting the previous year. Over the period from 2013 to 2024, it increased at an average annual rate of +1.2%. The most prominent rate of growth was recorded in 2017 when the average import price increased by 12%. Over the period under review, average import prices attained the maximum at $5,523 per ton in 2022; however, from 2023 to 2024, import prices failed to regain momentum.
Prices varied noticeably by country of origin: amid the top importers, the country with the highest price was the United States ($11,710 per ton), while the price for Turkey ($2,023 per ton) was amongst the lowest.
From 2013 to 2024, the most notable rate of growth in terms of prices was attained by the United States (+6.3%), while the prices for the other major suppliers experienced more modest paces of growth.
ExportsAustralia’s Exports of Carboys, Bottles and Similar Articles of Plastics
Plastic bottle exports from Australia soared to 2.3K tons in 2024, picking up by 56% against the previous year’s figure. Overall, exports, however, recorded a abrupt contraction. The exports peaked at 7.7K tons in 2014; however, from 2015 to 2024, the exports failed to regain momentum.
In value terms, plastic bottle exports soared to $14M in 2024. Over the period under review, exports, however, saw a perceptible descent. The exports peaked at $21M in 2014; however, from 2015 to 2024, the exports remained at a lower figure.
Exports By Country
New Zealand (769 tons), the United States (471 tons) and Fiji (105 tons) were the main destinations of plastic bottle exports from Australia, together comprising 59% of total exports. Malaysia, the UK, Vanuatu, Papua New Guinea, China, Germany and New Caledonia lagged somewhat behind, together comprising a further 12%.
From 2013 to 2024, the biggest increases were recorded for Malaysia (with a CAGR of +23.2%), while shipments for the other leaders experienced more modest paces of growth.
In value terms, New Zealand ($5.2M), the United States ($2.8M) and Fiji ($627K) constituted the largest markets for plastic bottle exported from Australia worldwide, with a combined 63% share of total exports. Malaysia, Vanuatu, the UK, China, Papua New Guinea, Germany and New Caledonia lagged somewhat behind, together comprising a further 12%.
Malaysia, with a CAGR of +28.2%, recorded the highest growth rate of the value of exports, among the main countries of destination over the period under review, while shipments for the other leaders experienced more modest paces of growth.
Export Prices By Country
In 2024, the average plastic bottle export price amounted to $5,995 per ton, shrinking by -4% against the previous year. Over the period under review, the export price, however, showed a prominent expansion. The most prominent rate of growth was recorded in 2017 when the average export price increased by 39% against the previous year. Over the period under review, the average export prices attained the maximum at $6,244 per ton in 2023, and then fell modestly in the following year.
Average prices varied noticeably for the major export markets. In 2024, amid the top suppliers, the countries with the highest prices were China ($6,761 per ton) and Malaysia ($6,761 per ton), while the average price for exports to Germany ($5,641 per ton) and the UK ($5,869 per ton) were amongst the lowest.
From 2013 to 2024, the most notable rate of growth in terms of prices was recorded for supplies to New Caledonia (+9.7%), while the prices for the other major destinations experienced more modest paces of growth.
Source: IndexBox Market Intelligence Platform