Design
For the present investigation, we used data from the UK Biobank—a large, prospective, population-based cohort study47. Between 2006 and 2010, >500,000 male and female adults, aged 40–69 yr, were enrolled47. Participants attended one of 22 assessment centres located across England, Scotland and Wales, where they undertook a comprehensive baseline assessment, completing questionnaires and physical measures, and provided biological samples. The UK Biobank study received ethical approval from the NHS North West Multi-Centre Research Ethics Committee (reference 11/NW/0382) and all participants provided informed consent.
For the current analysis, we excluded participants who withdrew their consent during follow-up or who completed fewer than two 24-h dietary questionnaires (by first removing individual recalls without plausible energy intakes: 4,200 kcal d−1 for men and 3,500 kcal d−1 for women) (Supplementary Fig. 1). Additionally, for the respective outcomes of interest, we excluded participants with prevalent CVD, T2DM, cancer, respiratory disease or neurodegenerative disease, prior to the last date of dietary assessment (Supplementary Table 8). Lastly, because Shannon’s equation requires intake of at least one kind of flavonoid compound, those with zero total flavonoid intake were excluded, and then, depending on the exposure of interest (flavonoid-rich foods or intra-subclass diversity, and so on), participants with zero intake of flavonoid-rich foods or specific subclasses were excluded on a per-analysis basis, because the collective exclusion at the flavonoid-rich food or intra-subclass level would bias diversity of other levels (for example, compounds (Supplementary Fig. 1)).
Exposures
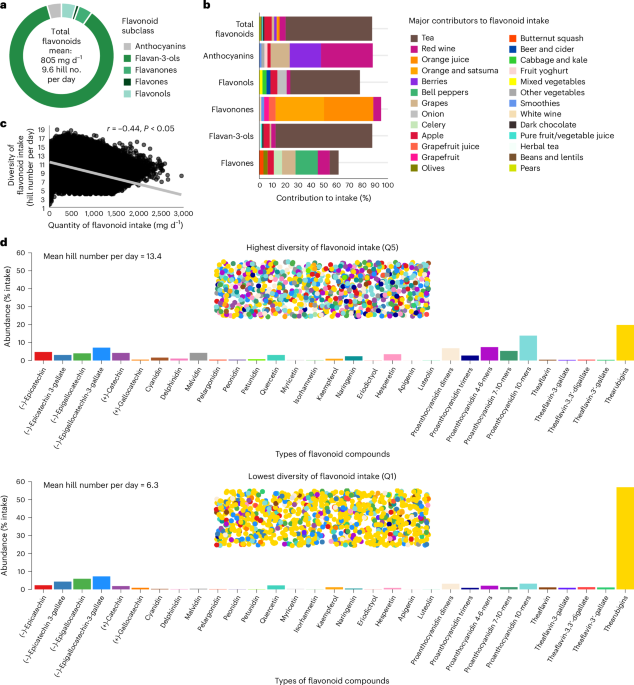
Dietary information was collected using the Oxford WebQ 24-h dietary questionnaire44, which participants completed on up to five separate occasions, between 2009 and 201248. Flavonoid intake was estimated from the Oxford WebQ 24-h dietary questionnaire using the US Department of Agriculture flavonoid and proanthocyanidin food content databases49,50, with food codes derived from the updated version of the nutrient calculations for the Oxford WebQ for food items and composite recipes13,51. Flavonoid intakes (mg d−1) from all completed questionnaires with plausible energy intakes were averaged. We derived intakes of several flavonoids subclasses as follows: flavonols (quercetin, kaempferol, myricetin and isorhamnetin), anthocyanins (cyanidin, delphinidin, malvidin, pelargonidin, petunidin and peonidin), flavan-3-ols ((+)-catechin, (+)-gallocatechin, (−)-epicatechin, (−)-epigallocatechin, (−)-epicatechin 3-gallate and (−)-epigallocatechin-3-gallate, plus dimers, trimers, 4–6-mers, 7–10-mers and polymers, plus theaflavin, theaflavin-3-gallate, theaflavin-3′-gallate, theaflavin-3,3′-digallate and thearubigins), flavanones (eriodictyol, hesperetin and naringenin) and flavones (luteolin and apigenin). Total flavonoid intake was calculated as the sum of all compounds. Intakes of isoflavones were not calculated due to the low consumption of isoflavone-containing foods in the general UK population52.
Diversity of flavonoid intake was calculated using Shannon’s equation for entropy22 which was subsequently converted to Hill’s effective numbers23,24. Calculations of diversity were made for total flavonoid intake, which considered diversity of all 31 flavonoids as described above. In an exploratory analysis we examined (1) intra-subclass diversity, which considered diversity of intake within individual subclasses, and (2) servings of flavonoid-rich foods, which included the key contributors to each flavonoid subclass, including tea (black and green), red wine, apples, berries, grapes, oranges (including satsumas), grapefruit, sweet peppers, onions and dark chocolate. The key contributors were determined as the three foods that contributed the highest percentage to the intakes of each flavonoid subclass (excluding fruit juices), and dark chocolate was included as it is typically high in flavan-3-ols13. Shannon’s equation is as follows:
$${\rm{Shannon}}\; {\rm{index}}\left({H}\;\right)=-\mathop{\sum }\limits_{i=1}^{s}{p}_{i}\mathrm{ln}\,{p}_{i}$$
In Shannon’s equation, pi is calculated as the proportion of individual flavonoids consumed per day (that is, the quantity of compounds (mg d−1) or flavonoid-rich foods (servings per day)) relative to total intake (that is, the total quantity of flavonoids (mg d−1) or flavonoid-rich foods (servings per day)) and s is the total number of individual flavonoid types (that is, compounds or flavonoid-rich foods) consumed. Diversity of flavonoid intake was calculated using the R package Vegan53. Conversion of Shannon’s score into Hill’s effective numbers was undertaken by exponentiating H (refs. 23,24).
The purpose of using effective numbers is to convert Shannon’s non-linear score into an interpretable metric that quantifies diversity23. The resulting output, termed effective numbers, shows the number of different types of flavonoids that would need to be consumed in a specific proportional make-up to meet the same relative diversity as the diet from which it was calculated, wherein a higher value indicates wider diversity (a detailed explanation of effective numbers can be found in the Supplementary Methods). The Shannon equation and Hill numbers produce a measure of diversity that is relative to, and independent of, the quantity of flavonoid intake, such that it is possible that two individuals can have exactly the same diversity score, yet one of them may consume, for example, a threefold higher quantity of flavonoids. Therefore, following statistical adjustment for quantity of flavonoid consumption, it is possible to study the independent benefit of diversity of flavonoid intake.
Outcomes
The outcomes in the current study were all-cause mortality and incidence (first-time fatal or non-fatal events) of CVD, T2DM, total cancer, respiratory disease, and neurodegenerative disease. Date of death was obtained from death certificates held by the National Health Service Information Centre (England and Wales) and the National Health Service Central Register Scotland (Scotland). Dates and causes of hospital admissions were identified via record linkage to Health Episode Statistics (England), the Patient Episode Database (Wales) and the Scottish Morbidity Records (Scotland) as well as the National Cancer Registries (England, Scotland and Wales). Incident outcomes were defined as a hospital admission or death identified through primary or secondary diagnosis codes using International Classification of Diseases, Tenth Revision (ICD-10) as follows: CVD (I20-I25, I63 and I70-I74), T2DM (E11), cancer (C00-C97, excluding non-melanoma skin cancer (C44)), respiratory disease (J09-J98, I26 and I27) and neurodegenerative disease (F00–03, G12.2, G20, G21, G23.1–23.3, G23.8, G23.9, G30 and G31). Hospital admission follow-up data for CVD, T2DM, respiratory disease and neurodegenerative disease were available until 31 October 2022 for England, 31 August 2022 for Scotland and 31 May 2022 for Wales. Follow-up data for cancer were available until 31 December 2016 for Wales, 31 December 2020 for England and 30 November 2021 for Scotland. Mortality data were available until 30 November 2022 for England, Scotland and Wales. We therefore censored outcome analyses on these dates.
Covariates
Information on demographics, lifestyle factors and medical history including sex, age, ethnicity, anthropometry, physical activity, education, smoking and alcohol habits were obtained from the baseline assessment. Anthropometric measurements (height and weight) were obtained by trained personnel. BMI was calculated as weight/(height2) (kg m−2). Physical activity was derived using the International Physical Activity Questionnaire short form, and total physical activity was calculated as the sum of walking, moderate and vigorous activity measured as metabolic equivalents (MET-h per week). Area-based socioeconomic status was derived from postal code of residence using the Townsend deprivation score. History of hypertension and diabetes mellitus (type 1 or 2) was derived from self-reported physician diagnosis of disease or medication use at recruitment, and from ICD codes dated prior to the last date of dietary assessment (Supplementary Table 8). History of hypercholesterolaemia was identified by physician diagnosis (self-reported) or the taking of cholesterol-lowering medication (Supplementary Table 8). To identify other baseline comorbidities, self-reported physician-diagnosed CVD, cancer, neurodegenerative disease and respiratory disease at recruitment was combined with ICD codes dated prior to the last date of diet assessment (Supplementary Table 8). The Oxford WebQ was used to calculate average daily intakes of foods, nutrients, energy intake via information recorded in the UK Nutrient Databank as previously reported54. The healthful plant-based diet index was derived from 17 food groups55.
Statistical analysis
Cox proportional-hazards models were used to investigate relationships between diversity of flavonoid consumption and all outcomes of interest. Participants were followed up from the completion of the last valid diet questionnaire until the first occurrence of the outcome event, death, loss to follow-up or the end of follow-up (as described above), whichever occurred first. Flavonoid diversity was modelled as quintiles with low flavonoid diversity (Q1) as the reference group. All models examining diversity were mutually adjusted for quantity (quintiles) of the same flavonoids that contributed to flavonoid diversity. All models used age as the underlying timescale56. Five models of adjustment were computed: model 1 minimally adjusted for sex, region of residence (entered as a strata variable: London, North West England, North East England, Yorkshire, West Midlands, East Midlands, South East England, South West England, Scotland and Wales) and number of dietary assessments completed with plausible energy intake (2, 3, 4 or 5); model 2 multivariable adjusted for covariates in model 1 plus demographic factors including: ethnicity (White, Black, Asian, mixed or other), BMI (−2), education (low (GSEs/O levels/GCSEs or equivalent), medium (NVQ/HND/HNC/A levels/AS levels or equivalent), high (other professional qualifications, college/university degree)) and socioeconomic status (Townsend deprivation index in quintiles); model 3 multivariable adjusted for covariates in model 2 plus lifestyle factors including: smoking status (current, former, never), alcohol intake (−1, 1–7 g d−1, 8–15 g d−1, 16+ g d−1) and physical activity (MET-h per week in quintiles); model 4 multivariable adjusted for covariates in model 3 plus dietary factors including: intakes of sugary drinks (0 d−1, >0–1 d−1, >1–2 d−1, 2+ d−1), cups of coffee (0 d−1, >0–1 d−1, >1–2 d−1, 2+ d−1), and red and processed meat, whole grains, refined grains, saturated fatty acids and sodium (all g d−1) and energy (kcal d−1) (all as quintiles); model 5 multivariable adjusted for covariates in model 4 plus medical history including history of diabetes type 1 or 2 (yes versus no), hypertension (yes versus no) and hypercholesterolaemia (yes versus no), and for analysis of all-cause mortality, further adjustments for prevalent CVD, cancer, respiratory disease and neurodegenerative disease at baseline. For variables where participants could select ‘do not know’ or ‘prefer not to answer’, or for those with missing data, responses were combined into an ‘unknown’ indicator group. The proportional-hazards assumption was confirmed using Schoenfeld residual plots. Absence of multicollinearity among predictors was verified using variance inflation factors. To address concerns that occult chronic diseases in the years preceding diagnosis may have influenced dietary patterns, we conducted sensitivity analysis excluding participants who developed events within 2 years of follow-up. We conducted further sensitivity adjustments for the healthful plant-based diet index in place of other dietary factors in model 5. To assess the influence of flavonoid intakes irrespective of dietary energy, model 5 was rerun without calorie adjustment. To assess the potential independent benefits of quantity and diversity of flavonoid intake on the risk of our outcomes, we report the terms for quantity of flavonoid intake following adjustment for diversity of flavonoid consumption. To evaluate whether the joint effect of quantity and diversity of flavonoid intake was together larger (or smaller) than the combination of the individual parts42, likelihood ratio tests were used to compare models with and without interaction terms. We observed and interpreted the magnitude and direction of observed associations through estimated HRs and associated 95% CIs with a HR of 1 indicating no association. All analyses were undertaken using Stata/IC 14.2 (StataCorp) and R statistics (v.4.2.1).
Reporting summary
Further information on research design is available in the Nature Portfolio Reporting Summary linked to this article.