Overview of the undiagnosed diseases network patient cohort
We assemble a cohort of 465 patients in the Undiagnosed Diseases Network (UDN) with molecular diagnoses. Most patients are diagnosed with a single causal gene that explains their symptoms; 14 patients (3%) have two causal genes, and two patients (0.4%) have three causal genes. Most patients in the UDN receive an extensive clinical workup and whole genome or exome sequencing (Fig. 1a). Sequencing data is analyzed with the involvement of clinicians and genetic counselors to identify candidate genes that harbor variants likely to explain the patient’s symptoms. Once one to five strong candidates are identified, causality is assessed by searching for genotype- and phenotype-matched individuals in human and animal databases or by introducing candidates into model organisms to determine in vivo impact50.
Fig. 1: Overview of SHEPHERD in the rare disease diagnosis pipeline.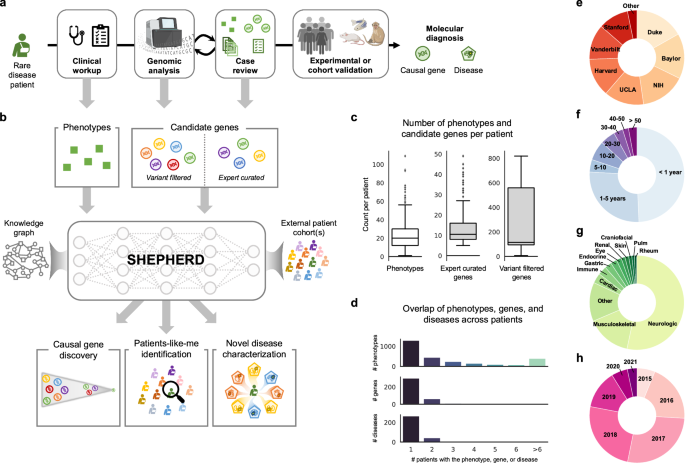
a After years of failed diagnostic attempts, once a patient is accepted to the UDN, they receive a thorough clinical workup and genetic sequencing, and their case is analyzed in an iterative process to identify the candidate genes likely to explain the patient’s symptoms. SHEPHERD can be used throughout the diagnostic process: after the clinical workup to find similar patients, after the sequencing analysis to identify strong candidate genes, and after the case review to further prioritize candidate genes, characterize the patient’s disease, and/or validate candidate genes by finding phenotype- and genotype-matched patients. b SHEPHERD takes in as input the patient’s set of phenotype terms and leverages an external rare disease knowledge graph to perform multi-faceted rare disease diagnosis. SHEPHERD can optionally consider a list of candidate genes (either variant-filtered or expert-curated) or external patient cohort(s), depending on the prediction task of interest (e.g., causal gene discovery, patients-like-me identification). For simplicity, the knowledge graph is depicted using three shapes: circles as genes, squares as phenotypes, and pentagons as diseases; refer to Methods for all node types. c Number of HPO phenotype terms and candidate genes in each of the two candidate gene lists across patients in our UDN cohort. d Overlap of phenotype terms, genes, and diseases across patients. Most phenotype terms, genes, and diseases are found in only a single UDN patient. e–h Number of patients in each e UDN clinical site, f age category, g primary presenting symptom, and h evaluation year. Figure adapted from images created in BioRender129,130,131.
Through this diagnostic process, patients are annotated with a set of Human Phenotype Ontology (HPO) phenotype terms describing their clinical features and a set of candidate genes that may explain the patient’s syndrome. Clinical experts additionally annotate diagnosed patients with an Online Mendelian Inheritance in Man (OMIM) identifier describing their disease (if available). Each patient is characterized by 23.9 HPO terms on average (SD = 16.1; Fig. 1c). The candidate genes are patient-specific and include genes in which the patient has a mutation. For each patient, the diagnostic process creates two sets of candidate gene lists. The lists contain genes considered at two different phases in the UDN diagnosis pipeline (Fig. 1a): VARIANT-FILTERED, a list produced by performing initial variant-based filtering of candidate genes, and EXPERT-CURATED, a list including genes marked by clinical experts as strong candidates for the patient (Methods 3). The VARIANT-FILTERED gene lists are produced using Exomiser24,51, a variant-based tool used in parallel to existing pipelines at three UDN sites50. The two candidate gene lists contain 244.3 and 13.3 genes on average, respectively (SD = 244.0 and SD = 8.0; Fig. 1c). Each gene list is input to SHEPHERD to predict the causal gene (i.e., the gene harboring variants that cause the patient’s disease) from both a long list of candidate genes derived from automated filtering (i.e., VARIANT-FILTERED) and a short list of the strongest candidate genes that are more challenging to prioritize (i.e., EXPERT-CURATED).
UDN patients have heterogeneous disease presentations: 378 unique genes and 299 unique diseases are represented in the cohort, and 48% of phenotype terms, 79% of genes, and 83% of diseases are represented in only a single patient (Fig. 1d). This reinforces the need for machine learning models that can learn from sparsely labeled datasets. 11.4% of patients have a diagnosis in common with at least one other patient. Patients with the same disease have only 67% of phenotype terms in common on average (SD = 43%), and the closest shared ancestor (i.e., lowest common ancestor) in the Human Phenotype Ontology between their phenotype terms is 2.67 hops away on average (SD = 0.81). In addition, 7% of patients have novel genetic diseases, and only 28% of each patient’s phenotypic features have any known association with the causal gene on average (SD = 21%). The assembled cohort of UDN patients has been evaluated at 12 clinical sites across the United States (Fig. 1e). While 75.9% of patients are under 5 years old, patients can present to the UDN with suspected genetic diseases in their 40s or 50s (Fig. 1f). The cohort is predominantly White (80.6%) and non-Hispanic (70.8%); smaller proportions of patients identify as Asian (9.2%), Black or African American (4.5%), or other racial and ethnic backgrounds (5.6%; Supplementary Fig. 1a, b). The sex distribution is relatively balanced, with 47.7% male and 52.0% female patients (Supplementary Fig. 1c). Most patients present with neurological symptoms but can exhibit cardiac, musculoskeletal, rheumatic, and many other symptoms (Fig. 1g). Due to the lag between starting the process at the UDN and receiving the diagnosis, most patients included in the analysis were evaluated by UDN clinicians in 2016–2018 (Fig. 1h). The phenotypic heterogeneity and presence of novel and atypical diseases pose a challenge for diagnosis, requiring diagnostic technology that can accommodate previously unseen phenotypes, genes, and diseases and leverage knowledge beyond direct gene, phenotype, and disease associations (Supplementary Fig. 2). The UDN patients represent a diverse, independent cohort used exclusively for model evaluation. Importantly, these patients are not used to train SHEPHERD.
Overview of SHEPHERD algorithm
SHEPHERD takes a set of patient’s phenotype terms and candidate disease(s) or candidate gene(s) harboring causal variants as input, and performs multi-faceted diagnosis of the patient to identify causal genes, retrieve “patients-like-me” with the same causal gene or disease, and provide interpretable characterizations of novel disease presentations (Fig. 1b). SHEPHERD can integrate into the rare disease diagnostic process workflow at multiple points: (1) to find similar patients after the patient’s clinical workup, (2) to identify strong candidate causal genes after the initial sequencing analysis or in conjunction with the clinical case review, and (3) to characterize the patient’s disease and find similar patients for experimental or cohort validation after candidate causal genes are identified (Fig. 1a, b).
SHEPHERD is a few-shot geometric deep learning approach for rare disease diagnosis. Few-shot learning, which can make predictions when very few (if any) labeled data points are available, is central to rare disease diagnosis because of the low prevalence of each disease. Key to SHEPHERD’s ability to provide diagnostic prediction when zero or at most a few labeled (diagnosed) patients per disease are available is to use a biomedical knowledge graph containing gene, phenotype, and disease relationships. SHEPHERD represents each patient as a set of phenotype terms from the knowledge graph, which we refer to as a phenotype subgraph to emphasize that these terms are embedded within the graph’s structure (Methods 1). It leverages a graph neural network to jointly embed each patient’s phenotype subgraph and candidate genes or diseases into a latent representation space such that the generated embeddings are informed by the structure of the knowledge graph, and patients are embedded nearby their causal gene(s), disease(s), and other similar patients (Fig. 2a, b). Further, SHEPHERD uses an attention mechanism to aggregate each patient’s phenotype terms to generate a patient embedding. While not intended as a clinical interpretability tool, the attention weights can be inspected post hoc to probe how the model prioritizes different phenotypic features during training and inference.
Fig. 2: SHEPHERD architecture, training, and generalizability.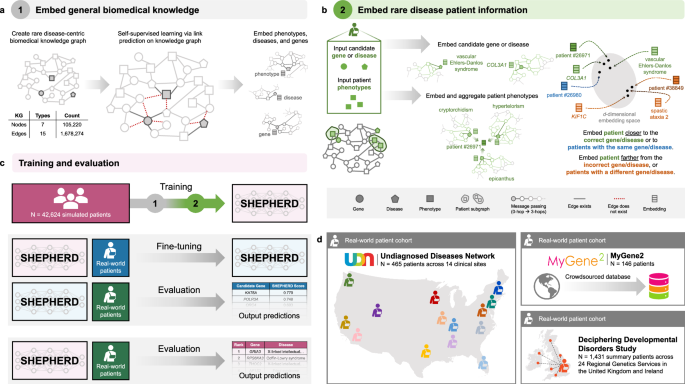
a, b SHEPHERD is trained in a two-step process. a First, the model is pretrained to embed the biomedical knowledge in the knowledge graph. b Then, the pretrained model is applied to the task of rare disease diagnosis. Patient information is overlaid on the knowledge graph, and SHEPHERD generates an embedding for the patient phenotype terms and each candidate gene, disease, or patient. The model is trained via a loss function that encourages patient embeddings to be close to the embeddings of their causal gene or disease or other patients with the same causal gene or disease. c SHEPHERD is trained on a large cohort of simulated patients (pink). It can be further trained on real-world patients (blue) and then evaluated on an independent cohort of real-world patients (green). Alternatively, SHEPHERD can directly be evaluated on real-world patients (green) without any additional training. d We leverage real patient data derived from three distinct cohorts: the Undiagnosed Diseases Network (UDN; N = 465), MyGene2 (N = 146), and Deciphering Developmental Disorders study (DDD; N = 1431). For simplicity, the KG is depicted using three shapes: circles as genes, squares as phenotypes, and pentagons as diseases; refer to Methods for all node types.
SHEPHERD is trained in a two-step process to learn embeddings of biomedical concepts and patients with rare genetic diseases. First, SHEPHERD is pretrained via self-supervised learning to embed genes, phenotypes, and diseases by predicting the relationships (structure) of the biomedical knowledge graph (Fig. 2a; Methods 7). This step produces compact embeddings that can be adapted for a range of analyses and are generalizable by accounting for complementarity between diseases. Then, using the pretrained model as initialization, SHEPHERD is trained for multi-faceted diagnosis of patients with rare diseases via a novel objective function (Fig. 2b; Methods 7). We train SHEPHERD in a disease-stratified manner (i.e., in which patients with the same disease are assigned either to the training or validation set, but not both) to enable SHEPHERD to generalize to diseases unseen during training.
Due to the scarcity of data for patients with rare diseases, we leverage simulated but realistic rare disease patients for training SHEPHERD (Fig. 2c). We train SHEPHERD on a cohort of more than 40,000 synthetic rare disease patients representing over 2000 rare diseases in Orphanet (Methods 6). There are 20 synthetic patients generated for each rare disease. The simulated patients were generated using an approach designed to generate realistic rare disease patients grounded in medical knowledge, and they have been shown to phenotypically and genetically resemble real-world rare disease patients48. The synthetic cohort is essential for training SHEPHERD, as it is considerably larger, more diverse, and more representative of phenotype and genotype heterogeneity than any real-world dataset of rare disease patients (Fig. 2c)48. This dataset, together with knowledge-guided learning on the rare disease knowledge graph, enables deep learning for rare disease diagnosis. A notable byproduct of training the model on synthetic data is that SHEPHERD’s model can be publicly released without the risk of exposing patient information52. After training, SHEPHERD can be further trained on real-world patient cohorts or leveraged directly for rare disease diagnosis.
We leverage real patient data from three cohorts in this study (Fig. 2d): (1) the UDN patient cohort (Methods 3); (2) a cohort of 146 patients from MyGene2, an online portal through which families with rare genetic conditions can share their health information to connect with clinicians and other patients53 (Methods 4); (3) a cohort of 1431 patients derived from the Deciphering Developmental Disorders study, an initiative from the United Kingdom and Ireland designed to diagnose patients with undiagnosed developmental disorders54 (Methods 5). Results are described in the following sections.
SHEPHERD can perform causal gene discovery
A critical step in rare disease diagnosis is identifying the gene(s) that are strong candidates for causing the patient’s syndrome (Fig. 1a). Given a patient’s set of phenotype terms and a list of genes in which the patient has a mutation, SHEPHERD predicts genes that harbor variants most likely to explain the patient’s presenting symptoms. SHEPHERD produces a score for each candidate gene in the patient that fuses two complementary aspects of information: an embedding-based metric that captures the global network topology and a network-based metric computed using knowledge graph distance that captures local network information (Methods 11). We use SHEPHERD to prioritize genes found in both the EXPERT-CURATED and VARIANT-FILTERED candidate gene lists (Methods 3). In both instances, SHEPHERD performs granular prioritization by refining lists of patients’ candidate genes output by bioinformatics pipelines. For this analysis, we leverage patients from three cohorts: the simulated, MyGene2, and DDD cohorts are used for training, and the UDN cohort is used for validation.
We report SHEPHERD’s performance in causal gene discovery as the average recall at k, defined as the number of causal genes correctly predicted in the top k ranked genes on average for all patients in the cohort. On the EXPERT-CURATED gene lists, SHEPHERD ranks the patient’s causal gene first in 40% of UDN patients, achieving a recall of 0.69 when k = 3 and 0.85 when k = 5 on average (Fig. 3a). On the much longer VARIANT-FILTERED gene lists, SHEPHERD achieves an average recall of 0.21, 0.38, and 0.48 for k = 1, 5, and 10, respectively (Fig. 3d).
Fig. 3: SHEPHERD performs generalizable causal gene discovery.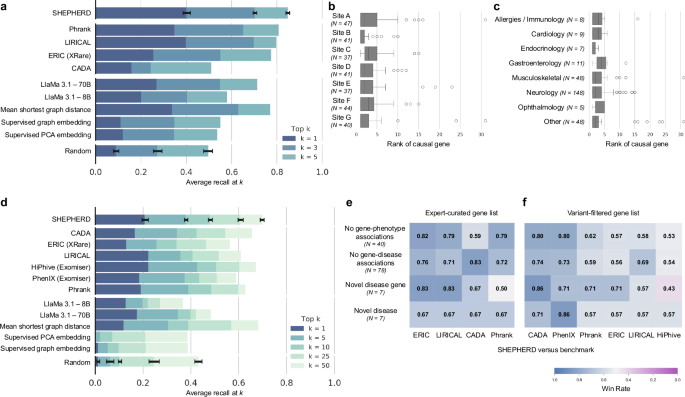
a Performance of SHEPHERD, four domain-specific approaches, five language model, traditional machine learning, and network science baselines, and a random baseline. The performance metric is average recall at k for k = 1, 3, and 5. Error bars denote standard deviation over models trained with five random seeds. b, c Performance of SHEPHERD in ranking causal genes stratified by b clinical sites and c primary presenting symptoms. Each boxplot shows the median and interquartile range of the rank of the causal gene. Whiskers extend to ±1.5 × IQR. d Performance of SHEPHERD, six domain-specific approaches, five large language model, traditional machine learning, network science baselines, and a random baseline. The performance metric is average recall at k for k = 1, 5, 10, 25, and 50. Error bars denote standard deviation over models trained with five random seeds. e, f Performance of SHEPHERD against domain-specific algorithms in four extremely hard-to-diagnose scenarios on e EXPERT-CURATED and f VARIANT-FILTERED gene lists. Shown is the win rate, the proportion of patients where SHEPHERD performs the same as or better than the benchmark algorithms.
We find no significant difference in performance across UDN sites throughout the United States, patients with varying presenting symptoms, and the year of evaluation by UDN clinicians (Fig. 3b, c and Supplementary Figs. 3a, 4a–c) on both the EXPERT-CURATED and VARIANT-FILTERED gene lists. These results indicate that SHEPHERD can generalize across clinical sites and diseases over time. Furthermore, we find that SHEPHERD’s performance does not correlate with the number of annotated phenotype terms for each patient (Spearman’s ρ = 0.02 and ρ = −0.11 for EXPERT-CURATED and VARIANT-FILTERED lists, respectively; Supplementary Figs. 3c, 4e). Finally, we evaluate SHEPHERD’s performance as a function of the prevalence of the rare disease. We leverage the number of submissions to ClinVar as a proxy for prevalence. We find that SHEPHERD’s performance does not strongly correlate with the prevalence of the genetic condition (Spearman’s ρ = −0.17 and ρ = −0.16 for EXPERT-CURATED and VARIANT-FILTERED lists, respectively; Supplementary Figs. 3d, 4f). SHEPHERD’s ability to generalize represents an important capability because rare disease patients are heterogeneous, and developing separate predictive models that perform well for each patient subgroup is not feasible due to the low prevalence of the disorders.
We evaluate SHEPHERD against 12 baseline approaches (Methods 21). We select a network science algorithm and two supervised machine learning approaches as benchmarks to quantify the advantages of SHEPHERD’s graph neural network approach. We also identify six domain-specific algorithms developed for causal gene discovery that leverage information theory (Phrank16, PhenIX24, and ERIC25), likelihood ratios (LIRICAL21), shallow graph embeddings (CADA19), and information-theoretic and random walk methods (HiPhive24). We further evaluate SHEPHERD against two large language models (LlaMa 3.1 8B and 70B55; Supplementary Fig. 8). SHEPHERD performs comparably or significantly better than all benchmarking approaches on the EXPERT-CURATED and VARIANT-FILTERED gene lists (Fig. 3a, d and Supplementary Fig. 8). SHEPHERD outperforms the strongest domain-specific algorithms, LIRICAL and HiPhive, in prioritizing causal genes overall on both EXPERT-CURATED (p value = 4.27 × 10⁻² for LIRICAL) and VARIANT-FILTERED (p value = 2.05 × 10⁻⁴ for LIRICAL and p value = 2.70 × 10⁻⁵ for HiPhive) gene lists (Wilcoxon signed rank-sum test). SHEPHERD significantly outperforms the other domain-specific approaches in retrieving the causal gene first by up to 24.4% (p value = 4.92 × 10⁻¹⁶) and 7.7% (p value = 1.55 × 10⁻³) of patients on the EXPERT-CURATED and VARIANT-FILTERED gene lists, respectively (McNemar’s test). Furthermore, SHEPHERD significantly outperforms large language models in retrieving the causal gene first by up to 20.1% (p value = 1.42 × 10⁻⁹) and 7.9% (p value = 6.85 × 10⁻³) of patients on the EXPERT-CURATED and VARIANT-FILTERED gene lists, respectively, and the other machine learning approaches by up to 29.0% (p value 1.73 × 10⁻¹⁷) and 20.4% (p value 1.44 × 10⁻¹⁵) of patients, respectively (McNemar’s test). For these statistical tests, we apply Benjamin–Hochberg procedure for multiple testing correction.
SHEPHERD’s strong performance demonstrates that SHEPHERD can complement existing variant-based approaches for gene prioritization while leveraging the extensive knowledge sources of gene-phenotype associations. Using SHEPHERD, rare disease experts would need to evaluate 1026 genes from the EXPERT-CURATED lists or 18,005 genes from the VARIANT-FILTERED lists to arrive at the causal gene for all 465 UDN patients. In contrast, with non-guided ranking, experts would need to evaluate a total of 2231 EXPERT-CURATED genes or 27,727 VARIANT-FILTERED genes, suggesting that SHEPHERD has the potential to improve diagnostic efficiency by 2.2-times and 1.5-times, respectively. Compared to the best domain-specific approaches, LIRICAL and HiPhive, SHEPHERD reduces the number of genes that experts need to consider by 97 (8.6%) and 5495 (23.3%) on the EXPERT-CURATED and VARIANT-FILTERED gene lists, respectively (LIRICAL), and by 1878 (9.4%) on the VARIANT-FILTERED gene list (HiPhive).
SHEPHERD can diagnose patients with atypical and novel genetic diseases
Patients in the UDN have atypical or novel disease presentations, which makes them challenging to diagnose because there are no direct associations between patients’ genes, symptoms, and the correct diagnosis. Consequently, the lack of direct linkage between patients’ phenotypic features and the correct diagnosis (causal genes) means that a lookup against medical knowledge bases is ineffective for diagnosis. We find that SHEPHERD can identify the causal gene even when the patient’s presenting phenotypic abnormalities are multiple hops away from the gene causing the disease in the knowledge graph. For 77.8% of patients whose phenotype terms are far away from their causal genes in the knowledge graph (i.e., more than two hops away), SHEPHERD identifies the correct causal gene among its top five predictions from the EXPERT-CURATED gene list. No strong correlation exists between SHEPHERD’s performance and the distance between the patient’s phenotype terms and causal gene (Supplementary Figs. 3b, 4d; R2 = 0.102, Spearman’s ρ = 0.37 and R2 = 0.0004, Spearman’s ρ = 0.12 for the EXPERT-CURATED and VARIANT-FILTERED gene lists, respectively).
We evaluate SHEPHERD against the domain-specific models in four hard-to-diagnose scenarios (Fig. 3e). We identify patients from the UDN whose causal genes lack known associations with phenotype terms or diseases in the literature (based on our rare disease knowledge graph) and who have been identified by UDN experts as having novel disease genes or novel diseases. SHEPHERD achieves win rates (i.e., ranks the causal gene the same or higher) of up to 82 and 83% for patients whose causal genes have no known phenotype or disease associations, respectively, on the EXPERT-CURATED gene lists. On the VARIANT-FILTERED gene lists, the win rates are up to 80 and 74%, respectively. SHEPHERD achieves win rates of up to 67 and 83% for patients with a novel disease or novel disease gene, respectively, according to UDN experts on the EXPERT-CURATED gene lists, and up to 86% on the VARIANT-FILTERED gene lists. The only subset of patients for which a baseline performs slightly better than SHEPHERD consists of patients with novel disease genes, according to human experts in the UDN. In all other scenarios, SHEPHERD outperforms all baseline approaches, demonstrating SHEPHERD’s ability to diagnose patients with atypical and novel genetic diseases.
We further demonstrate the use of SHEPHERD for patients diagnosed with an atypical presentation of a known disease or a novel syndrome through two case studies on patients from the UDN. Patient UDN-P1 (Fig. 4a; SHEPHERD Tool, Tab 1, Patient UDN-P1) received a diagnosis for POLR3-related leukodystrophy three years after acceptance into the UDN. While the involvement of gene POLR3A with leukodystrophy (MIM:607694) is known, the patient’s case was challenging due to her atypical clinical presentation. Several of her presenting clinical features, including lack of tear production, premature adrenarche, laryngeal cleft, hearing loss, and high blood pressure, are not typical of leukodystrophy. Further, only 28.3% (13 out of 46) of the patient’s phenotype terms are directly linked to POLR3A in the knowledge graph, and the patient phenotype terms are 1.98 hops away from the causal gene in the knowledge graph on average. The POLR3A gene is associated with five other diseases, and 93.7% (192 out of 205) of phenotype terms directly linked to POLR3A are not found in the patient, further complicating the diagnosis. Despite this atypical disease presentation, SHEPHERD identifies the patient’s causal gene in the top 1 out of 17 and 86 candidate genes in the EXPERT-CURATED and VARIANT-FILTERED gene lists, respectively. Strikingly, SHEPHERD can disambiguate diseases by optimally up- and down-weighting phenotypic features using an attention mechanism, and correctly down-weights phenotypic features that are atypical of leukodystrophy.
Fig. 4: Causal gene discovery case studies for patients with novel genetic conditions.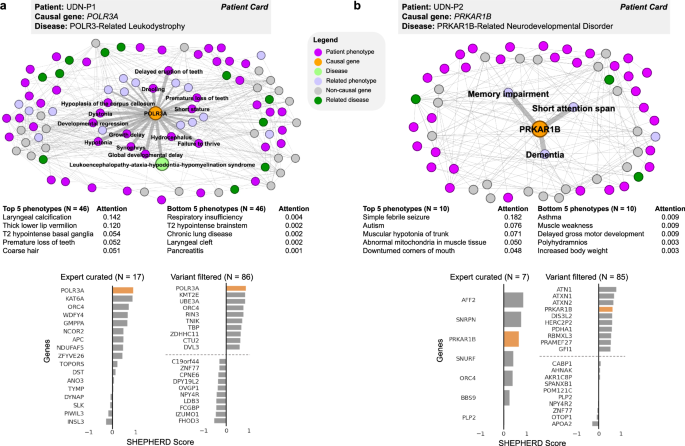
SHEPHERD identifies the causal gene even in atypical or novel disease presentations. Each patient case study, shown in (a, b), includes the subset of the knowledge graph containing all nodes in the shortest path between the patient’s phenotype terms, causal gene, and disease; a table of the patient’s phenotype terms and attention weights learned by SHEPHERD; and bar plots of scores SHEPHERD assigned to each candidate gene in the EXPERT-CURATED and VARIANT-FILTERED lists. The top and bottom five ranked genes in the VARIANT-FILTERED list are shown. The causal gene is highlighted in orange. The direct phenotypic neighbors of the causal gene are emphasized. In patient UDN-P1’s network, the patient’s causal gene is directly connected to the disease in the knowledge graph. In patient UDN-P2’s network, there is no disease node because the patient has a novel, uncharacterized syndrome. All panels, except those labeled as a “patient card” (colored box with the information provided by the UDN), depict SHEPHERD’s predictions or analyses performed on outputs of SHEPHERD.
SHEPHERD can also identify strong candidate genes for patients with novel, uncharacterized syndromes. Patient UDN-P2 (Fig. 4b; SHEPHERD Tool Tab 1, Patient UDN-P2) was accepted into the UDN with congenital hypotonia and developmental delay. While no diagnosis was identified in the primary genomic and clinical evaluation, the patient was diagnosed three years later with a novel PRKAR1B-related neurodevelopmental disorder. The PRKAR1B gene is not associated with known diseases. None of the 21 phenotype terms directly linked to PRKAR1B are found in the patient, and the average shortest path length from the patient’s phenotype terms to the causal gene is 2.4. Nevertheless, SHEPHERD identifies the suspected causal gene among the top 3 in the EXPERT-CURATED candidate list and the top 4 in the VARIANT-FILTERED candidate list, illustrating how SHEPHERD can assist in recognizing novel genetic diseases.
SHEPHERD learns meaningful patient representations that capture patient similarity
Another critical consideration for rare disease diagnosis is finding patients that share the same disease or causal gene, commonly referred to as “patients-like-me”56 (Fig. 1a). Starting from a set of patient phenotype terms, SHEPHERD flags other patients in the cohort with similar genetic diseases suitable for follow-up diagnostic analysis. Concretely, SHEPHERD finds similar patients through a deep embedding scorer optimized to represent patients with the same causal genes or disease as nearby points in the embedding space. For this analysis, we leverage patients from three cohorts: the simulated cohort is used for training, and the UDN and MyGene2 cohorts are used for validation.
SHEPHERD represents each patient as a point in the embedding space colored by the disease category of their diagnosed disease (Fig. 5). The categories correspond to the 33 disease categories outlined in Orphanet (Methods 2). Robust clustering of patients by disease area (AMI = 0.304; p value 5).
Fig. 5: SHEPHERD identifies patients-like-me from UDN and MyGene2 cohorts.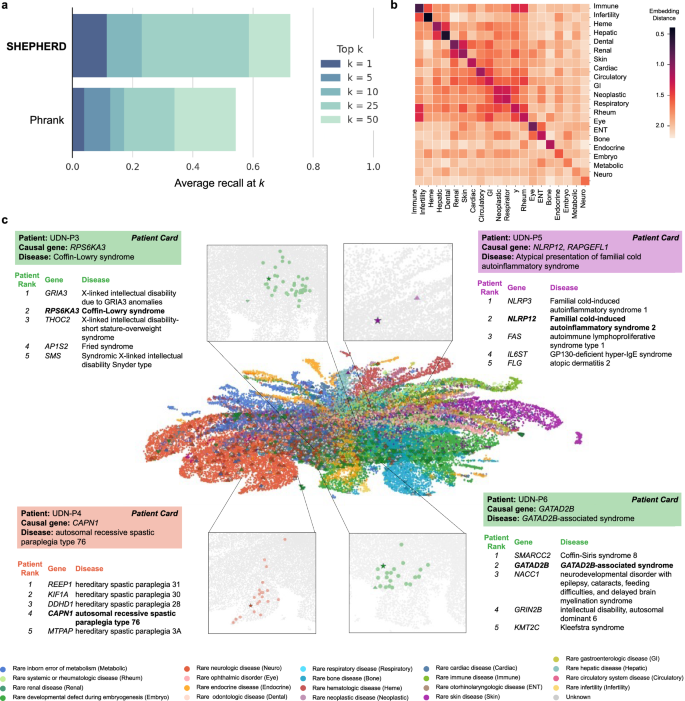
a Performance of SHEPHERD in retrieving MyGene2 patients with the same causal gene as a UDN patient (n = 75 UDN patients with at least one matching patient in the MyGene2 cohort). SHEPHERD is benchmarked against Phrank, a domain-specific algorithm. The performance metric is average recall at k for k = 1, 5, 10, 25, and 50. b Heatmap of the average distance between the phenotype embeddings of pairs of patients across disease categories. Darker colors indicate smaller distances and lighter colors indicate larger distances between patients of each pair of disease categories. c Two-dimensional UMAP plot of SHEPHERD’s embedding space of all simulated (circle), UDN (up-facing triangle), and MyGene2 (down-facing triangle) patients colored by their Orphanet disease category. Each of the four case studies consists of a zoomed-in UMAP displaying the query patient (star) and all patients with the same causal gene as the query (colored circles) and a table containing information regarding the top five most similar patients retrieved by SHEPHERD. Patients are bolded in the table if they share the same causal gene. All panels, except those labeled as a “patient card” (colored box with the information provided by the UDN), depict SHEPHERD’s predictions or analyses performed on outputs of SHEPHERD.
To further evaluate patient embeddings, we compare embedding distances between patients diagnosed with either the same or different disease (i.e., comparing diagonal vs. off-diagonal entries, Fig. 5b). We find that distances between patients of the same category are significantly smaller than between patients of different categories (p value 5b and Supplementary Fig. 7). For example, patients with neoplastic diseases and gastroenterologic diseases cluster together. Similarly, patients with hematologic and hepatic diseases and patients with odontologic and renal diseases cluster together in the embedding space. These clusters represent real co-occurrences of symptoms in disease presentations. For instance, patients with odontologic diseases, atypical dentin dysplasia, and orofaciodigital syndrome I, have both orofacial and renal disease presentations. Atypical dentin dysplasia is caused by a mutation in SMOC2, a matricellular protein involved in both craniofacial development and kidney fibrosis57,58. Orofaciodigital syndrome I is caused by a mutation in OFD1, which is involved in organogenesis and plays a vital role in the normal growth of orofacial and kidney tissues59,60. These relationships reflect that diseases often involve multiple organ systems and indicate that the embedding space can capture the relationship between patients with similar symptoms even when their diagnoses differ.
SHEPHERD can identify “patients-like-me” with similar genetic diseases
We next examine SHEPHERD’s ability to identify “patients-like-me” from a large cohort of rare disease patients. We either rank all simulated, UDN, and MyGene2 patients (UDN-P3 and UDN-P4 cases) or all UDN and MyGene2 patients (UDN-P5 and UDN-P6 cases; Fig. 5c; SHEPHERD Tool Tab 2) to identify patients most similar to the query UDN patient. We locate each query patient and all similar patients with the same causal gene in SHEPHERD’s embedding space, and find that patients with the same causal gene are embedded nearby. In all four patient cases, SHEPHERD retrieves patients with the same causal gene and disease as the query patient among the top five predictions. Patients ranked above the patient with the same causal gene have very similar disease presentations to the query patient. For UDN-P4 and UDN-P5, the patients have a variant of the same disease caused by a different gene (Fig. 5c). For UDN-P6, patients with Coffin-Siris syndrome 8 (ranked first) and GATAD2B-associated syndrome (ranked second) both exhibit impaired intellectual development, hypotonia, feeding difficulties, and hypertelorism, among other phenotypic abnormalities. For UDN-P3, patients with X-linked intellectual disability due to GRIA3 (ranked first) and Coffin-Lowry syndrome (ranked second) share impaired intellectual development, seizures, scoliosis, and other phenotypic abnormalities.
The most similar patients identified by SHEPHERD do not necessarily have the most phenotype terms in common with the query patient. This reflects SHEPHERD’s ability to capture phenotypic similarity rather than just calculating a direct overlap in phenotype terms, typical of some information-theoretic approaches used in practice. In particular, patients who share the same causal gene have two to four phenotype terms in common. Only 10.0, 9.0, 26.6, and 7.7% of the phenotype terms found in query patients UDN-P3, UDN-P4, UDN-P5, and UDN-P6 are also found in the most similar genotype-matched individual, respectively. In contrast, patients with the most phenotype terms in common with the query are ranked at positions 366, 463, 41, and 16, respectively. For example, one patient shares ten phenotype terms with UDN-P6, which is 38.5% of UDN-P6’s phenotypes, yet has a different causal gene and is ranked 16th. This capability of SHEPHERD to consider indirect, deep associations between genes and phenotypic features makes SHEPHERD highly complementary to graph-theoretic techniques and statistical tests that can only score direct associations, which can be ineffective for poorly characterized diseases.
We next quantify SHEPHERD’s ability to identify “patients-like-me” for each UDN patient from all patients in the real-world MyGene2 cohort. As before, we evaluate the average recall at k, here defined as the number of MyGene2 patients with the same causal gene as the query correctly predicted in the top-k ranked patients on average for all UDN patients in the cohort. SHEPHERD ranks a patient with the same causal gene first in 11.5% of UDN patients, achieving a recall of 0.31, 0.43, 0.49, and 0.53 for k = 5, 10, 25, and 50, respectively (Fig. 5a). We compare SHEPHERD to Phrank, an alternative approach that can calculate phenotypic similarity. Phrank uses information theory to calculate the similarity between two sets of phenotype terms based on shared ancestors in the Human Phenotype Ontology. We find that SHEPHERD performs significantly better than Phrank in identifying “patients-like-me” (Mann–Whitney p value = 0.04). SHEPHERD ranks a patient with the same causal gene first for 7.4% more patients and reduces the number of patients that clinicians need to consider by 703 (17.2%) compared to Phrank.
Finally, we evaluate whether SHEPHERD embeds patients with the same disease (rather than gene) closer to each other than to patients with different diseases. Again, we compare UDN patients to MyGene2 patients. We find that embedding distances between patients diagnosed with the same disease are significantly smaller compared to patients with different diseases (p value = 2.42 × 10⁻⁸; Kolmogorov–Smirnov test; Supplementary Fig. 6), further strengthening the evidence that SHEPHERD can capture similarities between different diseases with similar presenting symptoms, but can nevertheless differentiate patients that have the same diagnosed disease.
SHEPHERD provides an interpretable characterization of novel diseases
In addition to supporting causal gene discovery and patients-like-me identification, SHEPHERD can help characterize novel clinical presentations through our current knowledge of rare diseases (Fig. 1a). Given a patient’s set of HPO phenotype terms, SHEPHERD provides an interpretable summary of the patient’s disease based on its similarity to each disease in the KG. SHEPHERD produces a ranked list of all diseases using the embedding similarity between each disease and the patient’s phenotype terms, which are then summarized to generate a distribution of similarities to disease categories. More concretely, SHEPHERD learns an embedding space in which the similarity between a patient and a disease is inversely proportional to the embedding distance between the patient and their diagnosed disease (Fig. 6a). Aggregating SHEPHERD-generated similarities of individual diseases by their disease category enables interpretable characterization of the patient’s disease. For example, a patient’s presenting syndrome may be w1% similar to rare neurologic diseases, w2% similar to rare bone diseases, w3% similar to rare developmental defects during embryogenesis, etc. SHEPHERD can leverage gene-phenotype-disease associations to generate granular descriptions of a patient’s disease. For this analysis, we leverage patients from two cohorts: the simulated cohort is used for training, and the UDN cohort is used for validation.
Fig. 6: SHEPHERD performs novel disease characterization.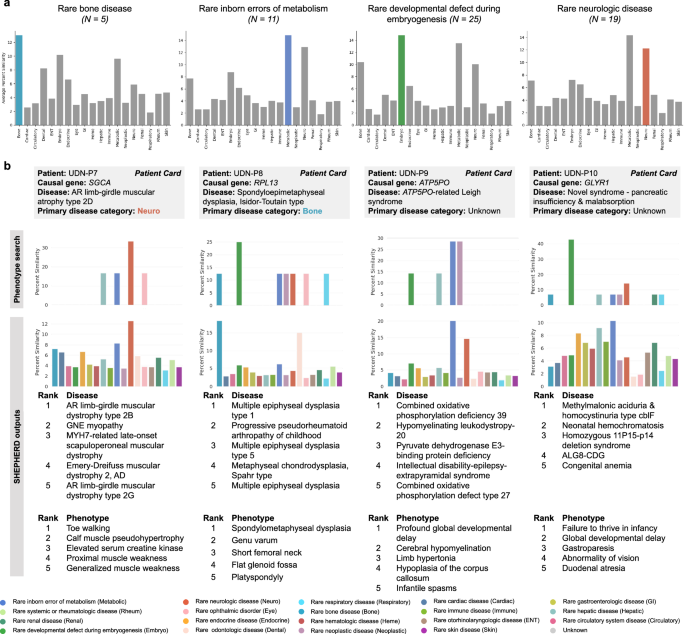
a Bar plots of the similarity between UDN patients and diseases found in each disease category. We group UDN patients by the disease category of their true disease and show plots for all categories with at least five patients. The bars that do not correspond to the disease category of each patient’s true disease are colored gray. b The column for each of the four case studies contains: the percent similarity distributions of the patient’s phenotype terms to diseases in each disease category based on a phenotype search via the KG (top) or SHEPHERD (bottom), a table of the five most similar diseases according to SHEPHERD, and a table of the patient’s five phenotypic features that are most highly attended by SHEPHERD.
We observe that SHEPHERD learns to embed patients near diseases of the same category; on average, 45.7% of the top ten ranked diseases with a known disease category belong to the same category as the patient’s disease, which is nearly three times more than the random expectation alone (16.4%). To evaluate SHEPHERD’s ability to provide interpretable disease names for patients with known rare diseases, we first calculate the similarity between UDN patients and all diseases. This allows us to assess whether the patients are most similar to diseases that share the same disease category as the patient’s disease (Fig. 6a). Concretely, for each patient, we stratify patients by their primary disease category and calculate the average similarity of a patient to all disease nodes under each disease category. As expected, we find that patients tend to be most similar to diseases of the same disease category as their own. For example, patients with a rare bone disease are predicted to be most similar to diseases under the category of rare bone disease (13.0% similarity), followed by rare developmental defects during embryogenesis (10.2%), rare inborn errors of metabolism (9.6%), and rare odontology diseases (8.2%). Similarly, patients with a disease categorized as a rare developmental defect during embryogenesis, a rare inborn error of metabolism, or a rare neurologic disease tend to be most similar to other diseases of the same category.
We examine two patients in depth to interrogate SHEPHERD’s predictive capabilities for characterizing known rare diseases: UDN-P7 and UDN-P8. Patient UDN-P7 (Fig. 6b; SHEPHERD Tool Tab 3, Patient UDN-P7) received a diagnosis for limb-girdle muscular dystrophy 3 (sarcoglycanopathy; MIM:608099) due to variants in SGCA. SHEPHERD compares the patient’s clinical presentation to diseases across 19 disease categories and finds that the patient is most similar to rare neurologic diseases, as expected. From SHEPHERD’s predictions, two of the top five most similar diseases are other types of AR limb-girdle muscular dystrophy, and all five are related to muscular dystrophy. We compare SHEPHERD to a simple phenotypic search of the patient’s HPO terms to generate a distribution of similarities to disease categories. This phenotype search approach can correctly identify the patient’s disease as a rare neurologic disease, but cannot produce disease-level rankings. Patient UDN-P8 (Fig. 6b; SHEPHERD Tool Tab 3, Patient UDN-P8) was diagnosed four years after acceptance to the UDN with the bone disease spondyloepimetaphyseal dysplasia caused by a mutation in RPL13. Again, SHEPHERD can ascertain that the patient’s symptoms are similar to other bone diseases; all of the top five ranked disorders are rare bone diseases with overlapping phenotype terms found in the query patient. In contrast, the phenotype search approach does not identify UDN-P8’s disease as a rare bone disease; rather, it predicts that the patient has a disease due to a rare developmental defect during embryogenesis. These findings on our case studies of two patients with known rare diseases suggest that SHEPHERD can produce correct and granular hypotheses about a patient’s rare disorder.
We also investigate SHEPHERD’s hypotheses for two patients with novel genetic diseases, UDN-P9 and UDN-P10. UDN-P9 (Fig. 6b; SHEPHERD Tool Tab 3, Patient UDN-P9) was diagnosed with ATP5PO-related Leigh syndrome caused by a novel mutation in ATP5PO, a gene previously unassociated with any disease61. As Leigh syndrome is a metabolic disorder with neuropathological features, SHEPHERD correctly identifies UDN-P9’s disease as most similar to diseases under the categories of rare inborn errors of metabolism and rare neurological diseases. In contrast, the phenotype search method incorrectly predicts a tie between a disorder due to a rare inborn error of metabolism and a rare neoplastic disease, failing to label the patient’s disease as a neurological disorder. Three of the top five diseases—combined oxidative phosphorylation deficiency 39 (MIM:618397; ranked by SHEPHERD as #1), pyruvate dehydrogenase E3-binding protein deficiency (MIM:245349; ranked by SHEPHERD as #3), and combined oxidative phosphorylation defect type 26 (MIM:616672; ranked by SHEPHERD as #5)—are mitochondrial diseases affecting the same pathway as ATP5PO and result in a defect in the aerobic energy production. These diseases’ causal genes co-localize with ATP5PO62,63,64,65. Combined oxidative phosphorylation deficiency 39 and combined oxidative phosphorylation defect type 26 are associated with neurological presentations of mitochondrial disease, including hypotonia, seizures, and features of Leigh syndrome66. The remaining two most similar diseases (ranked by SHEPHERD as #2 and #4) are rare neurologic diseases with phenotype terms identical to UDN-P9’s. The causal gene, CNP, for the second-ranked disease, hypomyelinating leukodystropy-20 (MIM:619071), is three hops away from ATP5PO in the physical protein interaction network67,68, suggesting that they may be functionally related69,70,71 or operate together72,73 to mediate phenotypic features associated with UDN-P9’s disease and hypomyelinating leukodystropy-20.
Patient UDN-P10 (Fig. 6b; SHEPHERD Tool Tab 3, Patient UDN-P10), is characterized by SHEPHERD as most similar to diseases under the categories of rare inborn errors of metabolism, rare hepatic disease, rare gastroenterological disease, and rare endocrine disease. These top categories are aligned with many of the patient’s symptoms, particularly duodenal atresia, intestinal malrotation, pancreatic exocrine insufficiency, liver disease, and developmental delay. In contrast, the phenotype search approach predicts that the patient’s disease is most similar to diseases due to rare developmental defects during embryogenesis. Three of the top five most similar individual diseases from SHEPHERD’s outputs—methylmalonic acidemia with homocystinuria type cblF (MIM:277380; ranked by SHEPHERD as #1), neonatal hemochromatosis (MIM:231100; ranked by SHEPHERD as #2), and ALG8-CDG (MIM:608104; ranked by SHEPHERD as #4)—are also due to inborn errors of metabolism, and the diseases are associated with phenotypes that are similar to those seen in the patient, including abnormalities in liver and gastrointestinal function and developmental delay. Notably, the rare respiratory disease category is the third lowest-ranked category. UDN clinicians hypothesized that the patient’s GLYR1 variants cause a mislocalization of the cystic fibrosis conductance regulator (CFTR), which is associated with cystic fibrosis. While the patient has gastrointestinal and pancreatic symptoms similar to those in cystic fibrosis, the patient does not have any of the pulmonary features classic for that condition. Such granularity in SHEPHERD’s predictions is a reflection of SHEPHERD’s ability to differentiate between diseases despite partially overlapping phenotypes and causal genes sharing the same pathway.