3R-MoS2 flake thickness optimization
We begin by optimizing the 3R-MoS2 material platform through analysis of the SHG signal as a function of both pump wavelength and the thickness of unpatterned flakes. This approach allows us to gain insight into how optical resonances within a metasurface can amplify the inherently efficient nonlinear response observed in bare flakes. Although similar studies have been previously reported, they focused on a specific or limited range of pump wavelengths63,64,65. Our work aims to expand this understanding by exploring a wider range of wavelengths and preparing a solid foundation for following metasurface experiments in reflection geometry.
Figure 2 shows an experimental and theoretical study of the total intensity of the SHG as a function of a pump wavelength (λpump in 800–1040 nm range or photon energy ωpump in 1.2–1.55 eV range) and the height of the bare 3R-MoS2 flake exfoliated onto a glass substrate. The schematic of such a study is illustrated in Fig. 2a, where a tunable femtosecond laser is focused through an objective on the 3R-MoS2 flake surface from the glass substrate side. The SHG signal is then collected through the same lens and quantified by an avalanche photodiode (APD), provided that SHG spectra are free of other signals68. As shown in Fig. 2b, (i) an optical image of the flake is correlated with (ii) SHG mapping of the same flake at different pump wavelengths (example of a single wavelength SHG mapping at a single pump wavelength; SHG spectra, as well as SHG signal vs. pump power are presented in Supplementary Information (SI), Supplementary Fig. S1). Finally, (iii, iv) atomic force microscopy (AFM) mapping scans and profiles are measured to assess the relevant flake thicknesses. This approach allows us to collect SHG spectra for several flake thicknesses simultaneously.
Fig. 2: Flake thickness optimization for second harmonic generation (SHG).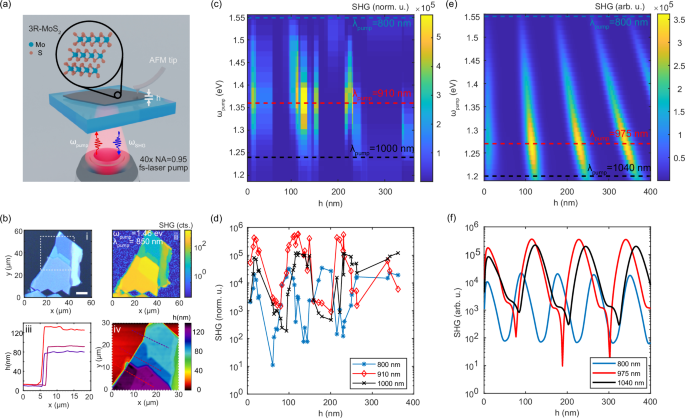
a Sketch of the SHG measurement of the 3R-MoS2 flakes exfoliated on glass substrate. The height of each flake was measured with atomic force microscopy (AFM). b Standard study steps of the flake analysis: (i) Optical image of the flake of interest. Scale bar is 10 μm; (ii) SHG mapping of the intensity at a given pump wavelength; (iii) and (iv) AFM analysis of the flake height. The white dashed line in (i) corresponds to the AFM area of analysis in (iv). c Experimental SHG intensity of 3R-MoS2 flakes for various pump wavelengths and flake thicknesses. The flake thicknesses, h, are measured by AFM. Dashed lines correspond to cross-sections in (d). d SHG intensity cross-sections at given pump wavelengths. Markers represent experimental points. Solid lines connect neighboring points for visual perception. The error bars in y direction are associated with the APD sensitivity. The error bars in x direction are associated with the AFM precision. Both of them are less than the marker size. e Theoretically calculated SHG intensity of the 3R-MoS2 flakes using the transfer matrix method. Dashed lines correspond to cross-sections shown in (f). f SHG intensity from flake thickness at given pump wavelengths.
The experimental result of the SHG intensity of the 3R-MoS2 flakes for different pump wavelengths, λpump, and flake thicknesses, h, is shown in Fig. 2c. Clear bands with high-intensity SHG are observed. They disperse toward increased thickness with decreasing pump energy, indicating resonant Fabry-Pérot (FP) behavior. The bright yellow parts of the map denote the maximum local SHG signal, which is determined by both the resonant FP conditions and the spectral dependence of the experimental χ(2) tensor. Here, the data show a narrow local SHG maximum at small h (~20 nm), whose amplitude is slightly smaller than that at larger thicknesses, which agrees with previous data for reflection SHG spectroscopy of 3R-MoS2 flakes63,64,65. This peak is attributed to the product of the transmission through the flake and the phase mismatch factor according to the following equation15:
$$\frac{{I}_{2\omega }}{{I}_{\omega }}\propto \frac{T(\omega ,h)| {\chi }^{(2)}(\omega ){| }^{2}{I}_{\omega }}{{n}_{2\omega }{n}_{\omega }^{2}}{h}^{2}{{{{\rm{sinc}}}}}^{2}\left(\frac{\Delta kh}{2}\right)$$
(1)
where T(ω, h) is the transmission through a 3R-MoS2 slab of thickness h at frequency ω, \(\Delta k={k}_{2\omega }-2{k}_{\omega }=4\pi {\lambda }_{{{{\rm{pump}}}}}^{-1}({n}_{2\omega }-{n}_{\omega })\) – is the phase mismatch between the second-harmonic and pump beams, λpump is the pump wavelength, and n2ω and nω are the refractive indices at the second-harmonic and pump wavelengths, respectively. Transmission peaks at h → 0, while the phase factor peaks at hcoh = π(Δk)−1 > 0, with their overlap resulting in a local maximum at h ~ 20–25 nm, depending on the wavelength, which coincides with the first optimal 3R-MoS2 flake thickness (Fig. 2c–f).
The relative amplitudes and widths of the SHG signal are further compared in Fig. 2d for selected pump wavelengths (marked in Fig. 2c by dashed lines) λpump: 800 nm (blue) and 1000 nm (black) – as the limits of the spectral range of the pump laser, and 910 nm (red) as the most resonant wavelength. This head-to-head comparison illustrates the sensitivity of the FP resonances to the exact value of h, providing up to three orders of magnitude enhancement in SHG intensity compared to off-resonant flake thicknesses.
The theoretical analysis of the SHG intensity was carried out using the transfer-matrix method (TMM) of a glass/3R-MoS2 interface utilizing the χ(2) tensor calculated in ref. 68 and refractive index from ellipsometric measurements54 (for more detailed information see Methods). Figure 2e presents calculated SHG for different heights of the flake (up to 400 nm) in the same energy range as in experiments. The dispersive FP resonances visible in the calculations match very well the experimentally observed dispersion. However, local SHG maxima within each FP band are slightly offset to the red versus the experiments, showing maxima at around 1.27 eV (~975 nm), where the theoretical χ(2) tensor peaks68. The dashed lines for a cross-section comparison are selected at different pump photon energies due to a slight spectral mismatch between the experimental and theoretical χ(2) tensors. However, the behavior seen in Fig. 2f is similar to that observed experimentally, with a ~3-order of magnitude variability in SHG for a given pump wavelength.
A comparison of the experimental and calculated data underlines that FP interference is the main factor responsible for the observed dispersion of the SHG signal, while the χ(2) tensor modifies the spectral intensity along each FP band. Furthermore, the calculated SHG signal shows saturation with increasing thickness of the 3R-MoS2 material for higher-order FP modes. This is most likely caused by the absorption at the second-harmonic wavelengths, where λSHG = λpump/2. Indeed, the imaginary part of MoS2’s dielectric function in the 400–500 nm range exceeds 1054, preventing light emission from deeper layers of the TMD. While a significant amplitude of the second-order polarization exists throughout the bulk of the flake, only part of it near the surface can radiate efficiently into the far field, while the remainder is strongly attenuated. Hence, we conclude that ~20–25-nm-thick 3R-MoS2 flakes are the most promising in terms of SHG emission per amount of material used in the studied spectral range. The choice of an ultrathin optimal thickness is further supported by several factors, including ease of nanofabrication, the absence of stacking faults (as discussed later), reduced optical losses (especially at the second-harmonic wavelength), and the lack of phase-matching constraints.
Metasurface with circular holes in a square lattice
An often-used design for a resonant metasurface that exhibits a high-Q resonance is a square array of circular holes with a diameter D and a center-to-center pitch Λ39,76. When certain symmetry conditions are fulfilled, such arrays may support so-called symmetry-protected and/or accidental BICs, depending on the angle of incidence and the exact arrangement of holes. The spectral range at which such a square array supports a BIC is determined by the material and geometrical parameters and it is critical to ensure they are chosen to facilitate both sharp resonances as well as efficient baseline SHG signal. The 3R-MoS2 flake thickness analysis indicates that there are several optimal thicknesses, which are candidates for metasurface nanofabrication. One may, in principle, aim at the second optimum value, at ~100–120 nm flake thickness with the strongest SHG signal or the thinner flake with approximately 50% smaller SHG. In the former case, it may be possible that SHG emission will not be able to outcouple efficiently from a thick metasurface. Furthermore, thick samples may present difficulties in achieving precise nanofabrication. This would deteriorate the quality factor of the desired resonances, which are very sensitive to the roughness of the sample75. On the other hand, localizing a BIC mode or other high-Q resonances in structures with sub-20 nm thicknesses may be challenging due to an insufficient amount of the material (see Supplementary Fig. S17 for thickness dependence). Balancing the above benefits and limitations, we aim to engineer metasurfaces supporting high-Q optical resonances in multilayer 3R-MoS2 films of optimal thicknesses – approximately h ~ 20−25 nm, Fig. 277.
Following experimental measurements in Fig. 2c, we aim to generate modes in the 1.3–1.5 eV range, where a thin, unpatterned ~20 nm flake provides an optimized SHG baseline. With the 3R-MoS2 thickness set, the remaining parameters, the lattice and hole size, are used to tune the metasurface modes to the desired energy range. Supplementary Fig. S18 demonstrates how the response is red-shifted with increasing lattice and allows us to move the lowest energy modes from approximately 1.3 eV for Λ = 600 nm to 1.6 eV for Λ = 400 nm for thickness 20 nm and hole filling fraction of 0.3. The last parameter is the hole, whose size can be used to predominantly increase the visibility of the mode as well as, to a much lesser degree, provide fine-tuning of the frequency response by ~0.1 eV, Supplementary Fig. S19. Lastly, the thickness of 3R-MoS2 will also determine the mode, as its increase will result in a significant red shift of the modes, Supplementary Fig. S17. Hence, precise control of the lattice and thickness is key to setting the desired spectral range, while the hole size is less important in this aspect. However, its value is important in ensuring the proper visibility of the modes.
Symmetry-protected BICs have been realized in square lattices of circular holes in a SiN metasurface at normal incidence78. These resonances feature ultra-high quality factors but are challenging to excite from the far field. To effectively excite a BIC, one typically introduces a symmetry break, which can be achieved by illuminating the metasurface at an oblique incidence78 or by rotating the meta-atoms within the metasurface44. To implement the former, we employ back-focal plane (BFP) imaging and spectroscopy using an oil immersion objective to access the reflection of the metasurface at various incidence angles and polarizations. Upon reaching the normal angle of incidence, the signal related to the BIC mode should vanish from the reflection spectrum, indicating the divergence of the quality factor, as expected for symmetry-protected BICs.
The circular hole metasurface was fabricated using electron beam lithography (EBL) and reactive ion etching (RIE) on a multilayer 3R-MoS2 flake mechanically exfoliated from a macroscopic crystal (HQ Graphene, additional details are presented in Methods). Figure 3 shows an SEM image of a circular hole array and BFP reflection spectra from this array fabricated in a 27 ± 1-nm thick 3R-MoS2 flake. The thickness of the flake was measured using AFM.
Fig. 3: Circular hole metasurface.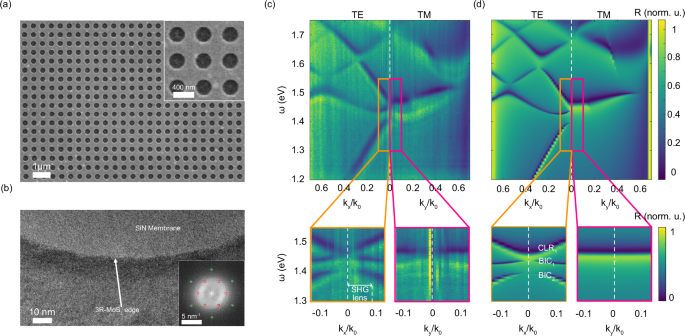
a Scanning electron microscopy (SEM) image of the circular hole 3R-MoS2 metasurface with h = 27 ± 1 nm. The scale bar is 1 μm. The inset shows a zoomed-in image of the metasurface. The scale bar is 400 nm. b High-resolution transmission electron microscopy image of one of the circular holes in a 3R-MoS2 metasurface with a beam direction along the [0001] zone axis. The scale bar is 10 nm. The inset shows the fast Fourier transform (FFT) of the image that exhibits distinct spatial frequency spots corresponding to the crystalline structure of the 3R-MoS2 and diffuse rings corresponding primarily to the amorphous SiN membrane support. The scale bar is 5 nm−1. The red and green circles identify the FFT spots that correspond to the 3R-MoS2 {1100} and {1120} families of crystallographic planes, respectively. c Experimental back focal plane reflection spectroscopy of the metasurface for transverse electric (TE) and transverse magnetic (TM) modes with 2 close-ups. The `SHG lens’ indicates the effective numerical aperture of the lens during second harmonic generation experiments in air. CLR circular lattice resonance, BIC bound-state-in-the-continuum. Extracted parameters are Dhole = 278 ± 8 nm, Λx = 493 ± 7 nm, and Λy = 488 ± 8 nm. d Numerically calculated reflection spectra at different angles of reflection for TE and TM modes with similar close-ups. The parameters of the metasurface used in the calculation are: pitch Λ = 500 nm, D = 262.5 nm, h = 23 nm.
The metasurface, presented in the SEM image Fig. 3a, exhibits some shape imperfections and photoresist residues as a result of the non-ideal nanofabrication process and the usage of e-spacer (see Methods and Supplementary Fig. S2). These features may negatively affect the overall performance of the metasurface75. The comprehensive statistical analysis of the individual circular hole size (Dhole), shape (ellipticity) and pitch size (Λx and Λy) of the lattice is described in the Supplementary Fig. S3. Extracted parameters are Dhole = 278 ± 8 nm, Λx = 493 ± 7 nm, and Λy = 488 ± 8 nm, while the shape of the holes was slightly elliptical. The reasonable resolution, hence error estimation, of the size and shape of the circular hole metasurface from SEM imaging is, conservatively, of the order of 10 nm, which is a substantial value to diminish a high-Q state.
To gain more clarity about the morphology and the atomic structure of the etched holes, we performed high-resolution transmission electron microscopy (HRTEM) and scanning TEM (HRSTEM). Figure 3b shows an HRTEM image of the edge of one of the circular holes on a ~20-nm thick SiN membrane support. A fast Fourier transformation (FFT) of Fig. 3b is shown in the inset image. The indexed FFT spots reveal the single crystal nature of the 3R-MoS2 while the diffuse rings primarily correspond to the amorphous SiN membrane support (see Supplementary Fig. S4). The HRTEM image confirms that the 3R-MoS2 crystallinity extends almost to the edge and there are irregularities in the circular hole edges with a roughness of around 5 nm. Furthermore, there is a ~10-nm thick region near the hole edge (dark contrast in Fig. 3b) where there is a modification to the morphology and structure. The 3R-MoS2 crystalline structure continues through this contrast layer, indicating that the contrast is probably residual material on the flake surface near the edge that is left over from the etching process. Additional HRSTEM images (Supplementary Fig. S5) further support the conclusions about the 3R-MoS2 circular holes.
Figure 3c presents the BFP reflection spectroscopy map of the circular holes metasurface (see Methods and Supplementary Fig. S6 for additional details). The left and right sections correspond to transverse electric (TE) and transverse magnetic (TM) modes, respectively. We observe several narrow dispersive reflection minima corresponding to circular metasurface lattice resonances (CLR) and BIC modes. Specifically, due to the symmetry of the system, for circular nanohole metasurface, the TE and TM polarization modes are expected to align when reaching the normal angle of incidence. The region of interest in terms of angle of incidence is limited to \(\sin \theta \approx 0.66\), which corresponds to the total internal reflection angle in the glass-air interface, calculated as \(\theta =\arcsin ({n}_{{{{\rm{air}}}}}/{n}_{{{{\rm{glass}}}}})\approx 41.{5}^{\circ }\). The orange and red boxes indicate close-up images of the desired region measured in BFP reflection.
In the case of the TE mode (as shown in the orange box inset in Fig. 3c), two symmetric reflection dips gradually thin down and eventually vanish near normal incidence at photon energies of approximately ℏω ~1.4 eV and 1.45 eV, indicating the appearance of symmetry-protected BICs. In contrast, for the TM mode (indicated in the red box in Fig. 3c), a single flat band exists within the entire range of angles in the inset, indicating that this band is not of a BIC character.
The BFP measurements are complemented by numerical calculations of reflection using the rigorous coupled-wave analysis (RCWA, see Methods for more details), see Fig. 3d. This allows us to extract the optical parameters of the metasurface whose spectrum would match the experimental data. The parameters used in the calculations are Λ = 500 nm, D = 262.5 nm, h = 23 nm, and reasonably close to those extracted for the fabricated sample (see Methods). In addition, the calculations confirm our experimental observations, demonstrating a good agreement in terms of position and dispersion for both TM and TE modes, as is seen from the comparison of Fig. 3c, d. Furthermore, our calculations confirm the CLR and BIC nature of the modes observed at normal incidence at ~1.4−1.5 eV. To conclude this section, while the reflection spectroscopy of the circular hole 3R-MoS2 metasurfaces shows promising performance, there remain several aspects to improve, particularly concerning the quality of individual meta-atoms and the precision of their edges.
Quasi-BIC metasurface with triangular holes
As a next step, we fabricate a 3R-MoS2 metasurface consisting of a square array of triangular holes using anisotropic wet etching of an initially pre-fabricated array of circular holes. This process follows the strategy reported previously for 2H-WS2 and 2H-MoS2 (for comparison between the etching of 2H- and 3R-MoS2, see Supplementary Fig. S7; and for faulty stacked 3R-MoS2, see Supplementary Fig. S8)74,79,80 and aims to accomplish two key objectives: (i) achieving ultrasharp edges of the triangular meta-atoms, and (ii) breaking the in-plane C2 and C4 rotational symmetry. The former aims at minimizing the scattering losses at the meta-atoms edges, while the latter is necessary to realize the q-BIC concept44. To ensure that the metasurface composed of triangular holes offers modes with similar dispersion in the same spectral range as those for the circular hole array, we keep the fill factor (ff) similar to that of the metasurface shown in Fig. 3. Since the material is consumed during wet etching, it is necessary to use a smaller diameter of the initial circular hole to achieve the required triangular hole size. The typical dependence between the side length atri of the equilateral triangle hole and the diameter of the initial circular hole D for a given thickness of the 3R-MoS2 flake (h = 24.5 ± 1.5 nm) shows a linear dependence: atri = 2.14D + 72 nm, where D is the hole diameter in nanometers (Supplementary Fig. S9).
It is important to note that material removal occurs in a specific manner: the edges of the triangular hole are oriented along the zigzag (ZZ) edge of the 3R-MoS2 crystal79. Therefore, to achieve a triangular hole array in a perfect square lattice with one side of the triangle parallel to one of the axes of the unit cell, one must know the exact orientation of the ZZ and armchair (AC) directions of the crystal. Moreover, the strict correspondence between lattice orientation and crystalline coordinates plays a pivotal role in SHG experiments, as the χ(2) tensor aligns with the crystalline axis, peaking in the AC direction, while optical resonances follow the metasurface lattice orientation. In this study, we aim to optimize both material properties and optical resonances; therefore, it is greatly beneficial that the orientations of nonlinearity and metasurface lattice are aligned.
Figure 4a shows a high-resolution SEM image of a wet-etched metasurface with triangular holes. After the wet etching, the 3R-MoS2 surface appears to be significantly cleaner than in the case of circular holes, while the edges of the triangular holes are exceptionally sharp (approaching atomic sharpness, due to the self-limiting nature of the wet etching process74,79). The average size of the triangular hole side lengths (atri), which was extracted from the SEM image in Fig. 4a, is atri = 373 ± 7.6 nm (Supplementary Fig. S9). Finally, we note that the anisotropic wet etching is able to reveal stacking faults that occasionally occur in 3R-MoS2 multilayers (Supplementary Fig. S8); such faulty metasurfaces were excluded from reflection and SHG experiments. Furthermore, the apparent absence of defects in the triangular metasurface shown in Fig. 4 suggests that it is entirely free from stacking faults and 2H inclusions. Since the likelihood of stacking faults increases with sample thickness, this observation further supports the use of ultrathin metasurfaces with h ~ 20–25 nm.
Fig. 4: Triangular hole metasurface.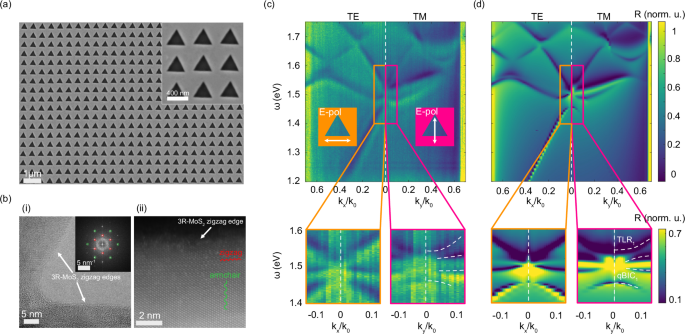
a High-resolution scanning electron microscopy (SEM) image of the h = 24.5 ± 1.5 nm thick metasurface. The scale bar is 1 μm. Inset is a close-up SEM image of the metasurface. The scale bar is 400 nm. b(i) High-resolution transmission electron microscopy image of a vertex of one of the triangular holes in a 3R-MoS2 metasurface with a beam direction along the [0001] zone axis. The scale bar is 5 nm. The inset shows the fast Fourier transform (FFT) of the image that exhibits distinct spatial frequency spots corresponding to the crystalline structure of the 3R-MoS2. The scale bar is 5 nm−1. The red and green circles identify the FFT spots that correspond to the 3R-MoS2 {1100} and {1120} families of crystallographic planes, respectively. The orientation between the {1100} family of spots in the FFT and the edges of the triangle in the image confirm the zigzag nature of the etched edges. (ii) High-resolution scanning transmission electron microscopy image of a representative triangular hole edge. The overlays show possible zigzag and armchair directions, confirming the edge is aligned with the zigzag direction. The scale bar is 2 nm. c Experimental back focal plane reflection spectroscopy of the metasurface for transverse electric (TE) and transverse magnetic (TM) modes with 2 close-ups. TLR triangular lattice resonance, qBIC quasi-bound-state-in-the-continuum. d Numerically calculated reflection spectra at different angles of reflection for TE and TM modes with similar close-ups using following parameters: atri = 375 nm, pitch size Λ = 500 nm, h = 20 nm.
HRTEM and HRSTEM images of triangular holes, as shown in shown in Fig. 4b and Supplementary Figs. S10–S14 confirm that the triangular hole edges have better crystallinity and are sharper compared to the circular hole edges. The HRTEM image of a triangle vertex in Fig. 4b(i) and the HRSTEM image of a triangle edge in Fig. 4b(ii) show that the triangle vertex is exceptionally sharp and that the edges are nearly atomically sharp with a roughness ≤1–2 nm. The orientation between the edges in the HRTEM image in Fig. 4b(i) and the indexed FFT spots in the inset reveal that the triangle edges are aligned with the zigzag direction. This is also confirmed by the 3R-MoS2 atomic structure that is resolved in the HRSTEM image in Fig. 4b(ii), as indicated by the overlay markers. Additional HRTEM and HRSTEM images (Supplementary Figs. S10–S14) further support the conclusions about the 3R-MoS2 triangular holes.
As with the circular hole array, we measure reflection spectra in BFP for the triangular hole metasurface. Unlike the former case, the unit cell with an equilateral triangular hole lacks in-plane C2 and C4 symmetries, therefore a metasurface based on such a cell is a promising candidate to allow the existence of the q-BIC state at normal incidence from the far-field excitation44. The collected experimental BFP spectra are plotted in Fig. 4c for TE and TM polarizations with the same orientation as for the circular hole metasurface. Overall, the mode dispersion for the triangular metasurface shows similar behavior to the circular one, however, with a few exceptions. Specifically, unlike the circular hole metasurface, in this case, a closer look reveals the presence of a reflection dip for the lower order mode even at normal incidence at 1.47 eV, indicating the presence of q-BIC. This normal incidence q-BIC is confirmed in the calculated reflection spectra for a metasurface with the following parameters: atri = 375 nm, lattice Λ = 500 nm, h = 20 nm (Fig. 4d), which closely match the parameters extracted experimentally: atri = 373 ± 7.6 nm, lattice pitches Λx = 501 ± 7.3 nm, Λy = 507 ± 7.4 nm, and flake thickness h = 24.5 ± 1.5 nm (see Methods). Both experimental and theoretical results prove that the wet-etching fabrication is a powerful tool to break the in-plane symmetry of the meta-atom to access the q-BIC modes alongside reaching exceptional sharpness of the meta-atoms’ edges.
SHG enhancement in circular and triangular hole metasurfaces
After careful analysis of SHG in bare 3R-MoS2 flakes and BFP reflection of metasurfaces, which identified the existence of promising lattice resonance and optical BIC (q-BIC) modes in the 1.4–1.6 eV range, we proceeded to study the SHG in those metasurfaces. Figure 5a shows SHG enhancement spectra of the circular hole metasurface for a linearly polarized excitation along the y-axis (specified in the inset). Circular points are experimental SHG enhancement data, namely the ratio of the SHG intensity of the metasurface over the SHG intensity of the host flake at a given pump wavelength. We introduce this figure of merit – SHG enhancement – to quantify how the high-Q modes can amplify the SHG signal of the metasurface compared to the SHG signal of the optimized host flakes. However, since χ(2) of 3R-MoS2 depends on the pump wavelength, direct comparison between metasurfaces with resonances occurring at different wavelengths is not straightforward. One can see that the circular hole metasurface features a clear resonant enhancement around 850 nm, which corresponds to a pump energy of 1.46 eV – the same energy as the supported TM mode observed in the BFP spectra. The experimental SHG enhancement reaches ~200-fold, while the numerically calculated one is almost an order of magnitude larger at the same pump wavelength (gray shaded area in Fig. 5a). The numerically calculated SHG of the metasurface was carried out using the same parameters as the calculated reflection spectra in Fig. 3c. The SHG of the host flake was calculated using the same thickness as the metasurface (for additional details about SHG calculations, see Methods). The mismatch in the magnitude of SHG enhancement between the calculation and experiment can be attributed to the surface and shape roughness of the circular holes, as one can see from the AFM image shown in the inset of Fig. 5a, and from the SEM image in Fig. 3a.
Fig. 5: Second harmonic generation (SHG) of circular and triangular hole metasurfaces.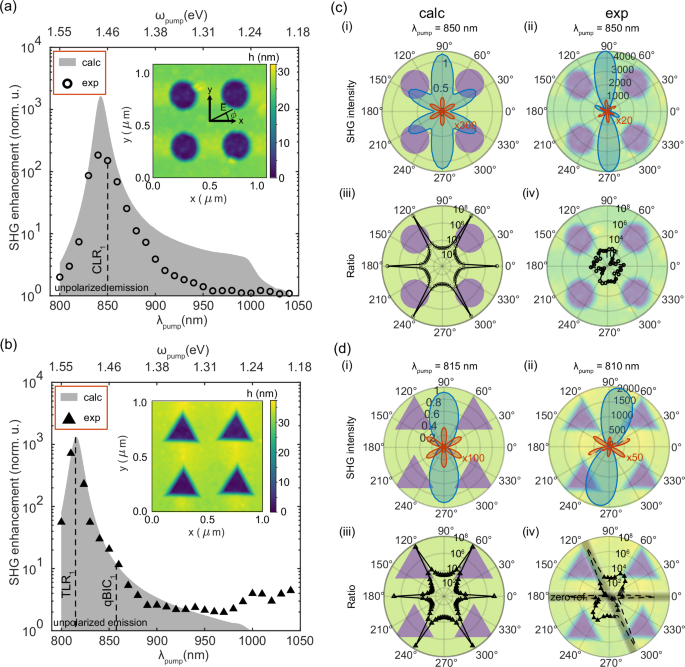
a Circular hole metasurface SHG enhancement, SHGmeta/SHGflake, vs. pump wavelength λpump. The pump polarization is linear along the y-axis. Detection has no analyzer. Circles correspond to experimental data, while the shaded area to numerical simulations. The inset depicts an atomic force microscopy (AFM) scan of the metasurface. b Triangular hole metasurface SHG enhancement, SHGmeta/SHGflake, vs. the pump wavelength. The pump polarization is linear along y-axis. Detection has no analyzer. Triangles correspond to experimental data, while the shaded area to numerical calculations in Comsol. The inset depicts an AFM scan of the metasurface. The error bars in (a) and (b) are less than the marker sizes. c Numerical (calc) – (i, iii) – and experimental (exp) – (ii,iv) polar plots of the SHG intensity (i, ii) and SHG enhancement (ratio of metasurface-to-flake SHG; iii,iv)) for the circular hole metasurface. SHG intensity (i,ii) is plotted in a linear scale. SHG enhancement (ratio; iii, iv) is plotted in a log-scale. The shaded background is the AFM image of the metasurface aligned with the polarization angles. d Numerical (calc) – (i, iii) and experimental (exp) – (ii, iv) polar plots of the SHG intensity (i, ii) and SHG enhancement (ratio of metasurface-to-flake SHG; iii, iv) for the triangular hole metasurface. SHG intensity (i, ii) is plotted in a linear scale. SHG enhancement (ratio; iii, iv) is plotted in a log-scale. The shaded background is the AFM image of the metasurface aligned with the polarization angles. Paramaters of the numerical calculation are the same as in Figs. 3 and 4.
Similar experiments and numerical analysis were carried out for the triangular hole metasurface. Figure 5b shows SHG enhancement of the triangular hole array with the incident polarization along the y-axis (along the height of the triangular hole and parallel to one of the axes of the unit cell). Similarly to the circular hole case, the spectral match is nearly perfect between the experimental SHG enhancement and the numerical one with the parameters extracted from Fig. 4d, peaking at roughly λpump = 810 nm, which matches with the mode appearing in BFP around 1.53 eV in Fig. 4c. However, in the case of the triangular hole metasurface, numerical and experimental data match not only spectrally, but also in the magnitude of the SHG enhancement – ~800-fold experimentally and ~1400-fold for the numerical study. It is worth mentioning, that the numerically perfect circular and triangular hole arrays perform similarly in terms of the peak SHG enhancement (~1500-fold), however, experimentally we obtain substantially larger values for the triangular case – ~800-fold vs. ~200-fold. We associate these results with the sharpness of the edges in triangular nanoholes and the cleanliness of the sample surface, as one can see in the AFM scan of the triangular hole sample with ultrasharp edges and a residual-free surface (Fig. 5d inset).
After optimizing the pump wavelength for the circular hole metasurface at 850 nm, we perform polarization-resolved SHG measurements at this excitation wavelength (see Methods). Figure 5c shows experimental data of the SHG intensity of the circular hole metasurface (blue area) as a function of the angle ϕ characterizing the rotation of pump polarization with respect to the x-axis, and SHG of the nearby bare host flake (red line) at 850 nm. The black circles are the ratio between the SHG of the metasurface and the host flake indicating how efficiently the metasurface can enhance the SHG intensity at a given angle. In Fig. 5c one observes at ϕ = 90°, which corresponds to the maximal SHG in both the host flake and the lattice resonance of the metasurface (along AC axis of the flake), the enhancement factor, although smaller than maximum values, exceeds 3 orders of magnitude.
The Fig. 5c(i) shows the calculated SHG intensity of the metasurface and the host flake at λpump = 850 nm overlaid with a schematic of the metasurface to illustrate the alignment of polarization-resolved SHG signal with respect to the metasurface axes. The data indicate perfect six-fold symmetry of the flake (red line) and 3 pairs of 2-fold symmetric features in the SHG of the metasurface with one dominant direction (blue line, dominant along ϕ = 90° direction). Since the total SHG intensity is a product of the field enhancement and the nonlinearity of the material system, it is evident that the vertical direction is dominant for SHG in terms of both the AC direction of the flake and the lattice resonance of the metasurface. However, the appearance of non-zero SHG along the directions at which the host flake has theoretically vanishing SHG (ZZ-axis) provides substantial SHG enhancement (up to 8 orders of magnitude in calculations), which is plotted in Fig. 5c(iii) (black line).
The Fig. 5c(ii) shows experimental polarization-resolved SHG for circular hole metasurface in polar coordinates. The experimental data exhibits substantially less pronounced subpeaks (blue line, at ~30° and 330°), however, they appear along approximately the same direction as in the numerical calculations. Such a discrepancy could be caused by (i) a slight misalignment of the crystalline axes and the metasurface unit cell and/or (ii) the metasurface not supporting high-Q modes because of the shape and surface imperfections. The latter hypothesis is also confirmed by the modest SHG enhancement shown in the Fig. 5c(iv) (black line), where the maximum enhancement does not reach 3 orders of magnitude along the ZZ direction where the reference flake exhibits minimum SHG.
The polarization-resolved analysis of the SHG enhancement in triangular metasurface is shown in Fig. 5d. The panel (i) shows a numerical calculation of the SHG intensity of the triangular hole metasurface (blue line) and the host flake (red line) as a function of ϕ. In this case, the SHG intensity of the metasurface exhibits a single 2-fold symmetry feature along the triangular hole array lattice and the AC axis of the host flake – y-axis. This is in agreement with the experimental result, shown in panel (ii), however, the experimental polar plot exhibits a slight tilt in the peak position (by several degrees in a clockwise direction). This tilt is also observed in AFM (inset Fig. 5b) and SEM (Fig. 4a) images of the triangles and is likely caused by a slight misalignment of the crystalline axes of the 3R-MoS2 host flake with respect to the metasurface’s unit cell, which in turn induces a slight symmetry break. Finally, the calculated SHG enhancement in the Fig. 5d(iii) (black line) is in good agreement with the experimental data in panel (iv) (black line) supporting the dominant direction of the enhancement along the ZZ direction of the flake and the experimentally measured SHG enhancement factor along ϕ ≈ 60° direction exceeds 103. In summary, the triangular nanohole metasurface presented here demonstrates performance that is considerably improved in comparison to its circular counterpart, making it a promising candidate for future nonlinear nanophotonics applications.
To additionally demonstrate the final point and benchmark our metasurfaces against established standards, we directly compared both circular and triangular metasurfaces to SHG from a monolayer MoS2. Our results demonstrate that the SHG signal is enhanced ~33,000- and 133,000-fold for the circular and triangular metasurfaces, respectively, relative to monolayer MoS2, values which are achieved despite a moderate increase in the overall sample thickness. Furthermore, the absolute conversion efficiencies, defined as η∘,△ = PSHG/Ppump, are on the order of η∘ = 0.02% and η△ = 0.08% for circular and triangular metasurfaces, respectively. Note that these conversion efficiencies are estimated at a moderate Ppump = 0.3 mW, at 800–850 nm pump wavelength range, repetition rate of 80 MHz, and pulse duration of ~100 fs (see Methods for further details).