Samples
European samples from UK Biobank [18] were retained if they had genetic information available, sex that was consistent between self-reported and inferred using genotype, no sex chromosome aneuploidies, not having been detected as extreme outliers of heterozygosity and missingness as defined in sample QC file by UKB, having not withdrawn consent, and having a genotyping rate greater than 0.9. This resulted in 440,964 participants being available for analysis. European ancestry was identified from the UK Biobank participants that self-reported as white. Principal components (PC) were derived from the genotype data and participants were excluded if they were outside of a mean ± 3 standard deviations from the first six principal components. For our general factor phenotypic of SES, we used all participants who had provided phenotypic data on at least one of our measures of SES.
For our Mendelian randomisation analysis, we derived two independent samples using the participants of UK Biobank. The brain imaging subset which consisted of 38,371 participants that had at least one MRI phenotype, and the general genetic factor of SES (gSES), and cognitive ability group that consisted of 383,220 participants who did not have any MRI phenotype and did not have any relatives in the outcome set based on as defined by UK Biobank. See Fig. 1 for more details.
Fig. 1: Shows GWAS sample size, relationship among samples, and analytic plan.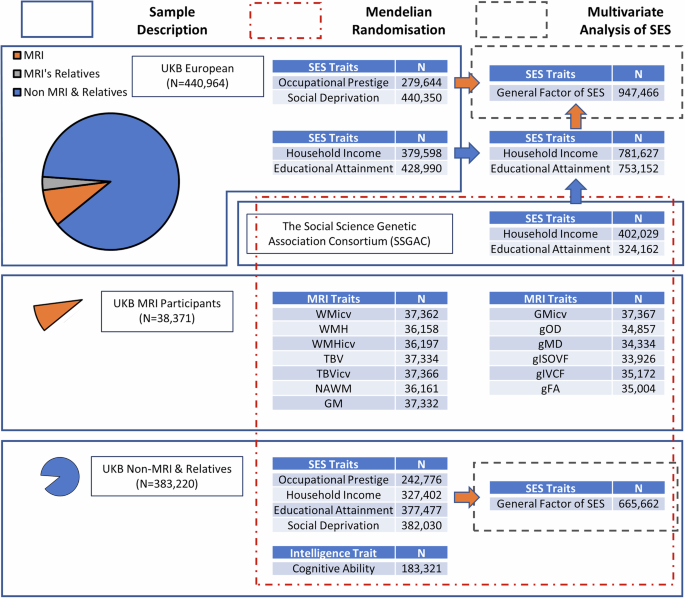
Blue arrow refers to meta-analysis in METAL. Orange arrow refers to common factor GWAS in GenomicSEM. N refers to sample size. In common factor GWAS, N refers to effective sample size. TBV total brain volume, TBVicv total brain volume as a proportion of intracranial volume, GM total grey matter volume, GMicv total grey matter volume as a proportion of intracranial volume, WMH white matter hyperintensity volume WMHicv white matter hyperintensity volume as a proportion of intracranial volume NAWM normal-appearing white matter volume, WMicv white matter volume as a proportion of intracranial volume. gFA The first unrotated component of fractional anisotropy properties. gMD The first unrotated component of mean diffusivity properties. gICVF The first unrotated component of intra-cellular volume fraction properties. gISOVF The first unrotated component of isotropic volume fraction properties. gOD The first unrotated component of orientation dispersion properties.
Ethics approval and consent to participate
Ethical approval was granted by UK Biobank and this project was conducted under UK Biobank application 10279. All methods were performed in accordance with the relevant guidelines and regulations. Each GWAS dataset included received approval from their respective ethics committees or institutional review boards, with informed consent obtained from participants.
Measures
Income was measured at the level of the household (HI, N = 379,598, MR sample = 327,402 excluding MRI participants and their relatives), which was measured in UK Biobank using an ordinal scale of 1–5 corresponding to the participants self-reported level of household income before tax (1 = £100,000).
Social deprivation was measured using the Townsend deprivation index (TS, N = 440,350, MR sample = 382,030 excluding MRI participants and their relatives). The Townsend deprivation index is an area-based measure of SES derived using the participant’s postcode. Townsend scores were calculated immediately prior to joining UK Biobank and are formed from four measures: the percentage of those aged 16 or over who are unemployed, the percentage of households who do not own a car, do not own their own home, and which are overcrowded. Scores were multiplied by −1 when used for deriving phenotypic and genetic correlations as well as for use in in Genomic SEM to ensure that the direction of effect was the same across each measure of SES (i.e., a greater score indicates a higher level of SES). However, for use in Mendelian randomisation the original direction of effect is retained where a greater score indicates higher level of deprivation (i.e. a lower level of SES).
Occupational prestige was measured using the Cambridge Social Interaction and Stratification Scale (CAMSIS, N = 279,644, MR sample = 242,776 excluding MRI participants and their relatives) and was derived using job code at visit (data field 20277) in UK Biobank transformed using the method described by Akimova et al. [19]. In brief, the CAMSIS uses the idea that social stratification acts to create differential association where partners and friends are typically selected from within the same social group. Thus, CAMSIS captures the distance between occupations by measuring the frequency of social interactions between them.
Educational attainment (EA, N = 428,990, MR sample = 377,477 excluding MRI participants and their relatives) was measured by transforming educational qualifications found in UK Biobank to a binary variable where ‘1’ indicated that the participant had attained a university level degree and ‘0’ indicated that they had not.
Due to the high genetic correlations between occupational prestige (rg = 0.69, SE = 0.02), household income (rg = 0.58, SE = 0.02), educational attainment (rg = 0.67, SE = 0.02) and social deprivation (rg = 0.27, SE = 0.03) with cognitive ability found here and in previous studies [20, 21] and the finding that cognitive ability is a likely causal variable in differences in income and educational attainment in the UK [8, 12, 22], cognitive ability was also included as an exposure variable. Cognitive ability was measured using the verbal-numerical reasoning test (VNR, N = 183,321 excluding MRI participants and their relatives) in UK Biobank. This test consists of 13 (14 for the online version of the test) multiple-choice questions (six verbal and seven numerical) which are to be completed within a two-minute time limit. A participant’s score on each of the questions is then summed to provide an overall measure of the participant’s level of cognitive ability. Participants either completed the VNR test at the assessment centre at one of four time points or completed an online version of the VNR test. If participants took the VNR at multiple time points, only the first instance of the test was used to avoid capturing practise effects in the assessment of the participant’s level of cognitive ability.
Brain structural and diffusion neuroimaging data were acquired, processed and QCd by the UK Biobank team as Imaging Derived Phenotypes (IDPs) according to open access publications [23, 24] and online documentation (https://biobank.ctsu.ox.ac.uk/crystal/crystal/docs/brain_mri.pdf). Global macrostructural outcomes of interest were selected as they have been shown to be associated with both ageing and differences in cognitive ability [25, 26]. These global macrostructural outcomes of interest were: total brain volume (TBV), total brain volume as a proportion of intracranial volume (TBVicv), total grey matter volume (GM), total grey matter volume as a proportion of intracranial volume, (GMicv), white matter hyperintensity (WMH) volume, white matter hyperintensity volume as a proportion of intracranial volume (WMHicv), normal-appearing white matter volume (NAWM, total white matter volume–WMH), white matter volume as a proportion of intracranial volume (WMicv). In addition, we include five global white matter microstructural measures derived from twenty-seven major white matter tracts, for which five tract-averaged white matter diffusion properties were available as IDPs (UK Biobank Category ID 135): fractional anisotropy (FA), mean diffusivity (MD), intra-cellular volume fraction (ICVF), isotropic volume fraction (ISOVF) and orientation dispersion (OD). We ran five PCAs of all 27 tracts, a separate model for each of the five properties. The first unrotated component of each PCA was extracted for further analysis, yielding five global white matter measures (gFA, gMD, gICVF, gISOVF and gOD) which explained 44, 50, 68, 37 and 26% of the variance, respectively. These derived variables capture the variance that is shared across each regional white matter property, providing a global measure of white matter integrity. As with the total brain, white matter hyperintensity, and grey matter volume traits described above, these global measures of white matter integrity capture age-related deterioration of white matter in healthy, non-clinical populations [27]. Prior to analysis, participants with the following conditions (UK Biobank field ID 20002.2) were excluded at the outset: dementia, Parkinson’s disease, Guillain-Barré, multiple sclerosis, stroke, brain haemorrhage, brain/intracranial abscess, cerebral aneurysm, cerebral palsy, encephalitis, epilepsy, head injury, infection of the nervous system, ischaemic stroke, meningioma, meningitis, motor neurone disease, spina bifida, subdural haematoma, subarachnoid haemorrhage, transient ischaemic attack, brain cancer, meningeal cancer, other demyelinating or other chronic/neurodegenerative illness, or other neurological injury/trauma. Outliers (>4SDs from the mean, which represented
Detailed information on sample size and which traits were involved in these analyses are provided in Fig. 1.
Genome-wide association studies
Genome-wide association studies (GWASs) were conducted in REGENIE v3.1.3 [28]. REGENIE uses a two-step approach to account for sample relatedness and population structure. In the first step, a whole genome regression model was fit to each trait (Exposures and outcomes) using 564,253 genotyped variants. These variants have minor allele frequency (MAF) > 0.01, call rate > 0.9, and Hardy-Weinberg Equilibrium of HWE-p value > 10−15.
In the second step, an association test was performed for each of the 13,192,861 imputed variants using a LOCO (leave-one-chromosome out) scheme. These variants have MAF > 0.001 and INFO > 0.8. For binary phenotypes (i.e., Educational attainment), firth logistic regression test was performed in the second step.
The per-chromosome LOCO genomic predictions produced in the first step were fitted in the second step to account for sample relatedness and population structure. In addition, sex, age at assessment, assessment centres, genotyping array, genotyping batch, and the first 40 PCs derived from genotype data were fitted as covariates in both steps. For cognitive ability, participants’ who took the VNR at an assessment centre were analysed together including time point (1–4) as an additional covariate before being meta-analysed with the participants whose first instance of taking the VNR was online. Regarding brain imagining phenotypes, three-dimensional head position along the X, Y, and Z axis were fitted as extra covariates. For TBV height was fitted as an additional covariate and for GM and NAWM both height and TBV were fitted. For VNR, the GWASs were performed in participants who took the test in the assessment centre, and those took the online test separately, before combining the results with an inverse variance weighted model [29].
Linkage disequilibrium score regression (LDSC)
Using the 1000 G European reference panel LDSC [30] was performed to estimate the heritability of the exposure and outcome traits. In addition, the intercept of each LDSC regression was used to examine the GWAS association test statistics for inflation due to factors other than polygenicity.
Phenotypic and genomic structural equation modelling
Phenotypic common factor of SES was derived in R [31] using factor analysis in psych [32] package using standardised phenotypes. A total of 248,480 participants provided data pertaining to their occupational prestige, household income, educational attainment, and social deprivation phenotypes.
The genetic factor structure was assessed using Genomic SEM and GWAS data conducted on occupational prestige (N = 279,644), household income (N = 781,627), educational attainment (N = 753,152), and social deprivation (N = 440,350) phenotypes (Fig. 1). Note that as sample overlap is controlled for in Genomic SEM these samples sizes are larger than those used in our Two-sample Mendelian randomisation analysis described above. Regarding genetic common factor of SES, we used genomic structural equation modelling [33] to derive LDSC—based [34] genetic correlations and covariances between occupational prestige, household income, educational attainment, and social deprivation. Next, the covariance structure between each of the four traits used to derive a genomic structural equation model to examine their loading on a single factor of SES. This common factor model was ran using SNPs from occupational prestige, household income, educational attainment, and social deprivation where MAF > 0.01 and INFO > 0.9. Next, we performed a multivariate GWAS using genomic SEM where 7,462,121SNPs with MAF > 0.01 and INFO > 0.6 were included to derive genome-wide summary statistics describing each SNPs association with the common factor of SES, termed gSES. In addition, we derived genome-wide heterogeneity (Q) statistics describing the degree to which a given SNP is likely not acting on single latent factor of SES. To examine the goodness-of-fit of the phenotypic model and the model derived using Genomic SEM the standardised root mean square residual (SRMR), model χ2, and the comparative fit index (CFI) were used. We used the criteria proposed by Hu and Bentler [35] to determine a good fit: CFI > 0.95, SRMR
Meta analysis of income and education
Data provided by the Social Science Genetic Association Consortium (SSGAC) was used to add power to the gSES as well acting as a replication sample for educational attainment and household income and for use in Multivariable Mendelian Randomisation (MVMR). For both meta-analyses, METAL [36] was used to conduct a sample size weighted meta-analysis from which Beta values and standard error obtained using the following equation as provided by Zhu et al. [37].
$$\beta =\frac{Z}{\sqrt{2\times {MAF}\times \left(1-{MAF}\right)\times (N+{Z}^{2})}}$$
$${SE}=\frac{1}{\sqrt{2\times {MAF}\times \left(1-{MAF}\right)\times (N+{Z}^{2})}}$$
(Where \({MAF}\) is the minor allele frequency, \(N\) is the sample size, and \(Z\) is the test-statistics.)
Loci identification and overlap
For each trait, genomic risk loci were identified by FUMA [38] (version v1.3.6a) using 1000 G EUR reference panels. Briefly, FUMA performed two LD clumpings. The first clumping was designed to define independent signals (genome significant SNPs at P −8) with r2 > 0.6. In the second clumping, independent signals were clumped into one genomic locus if the r2 between two signals is >0.1 or two signals are within 250 kb. The SNPs clumped into each genomic locus naturally formed its physical boundary.
We compared the positions of genomic loci between two traits locus-by-locus. We define that a locus of trait A overlaps with trait B, if the positions of any trait B loci overlap with the position of that trait A locus. For the general factor of SES, we define a locus as unique to general SES if that locus does not overlap with any of the four contributing traits. For the four contributing traits of gSES, we define a locus is unique to that trait if that locus does not overlap with gSES.
Mendelian randomisation
For two-sample MR, UK Biobank data was divided into two non-overlapping subsets, one for the exposure and one for the outcome (Fig. 1). Genome-wide association study (GWAS) were performed to identify instrumental variables for six exposures. These were occupational prestige, household income, educational attainment, and social deprivation, and cognitive ability. A multi-variate GWAS was conducted on occupational prestige, household income, educational attainment, and social deprivation to extract a common SES factor (gSES), resulted into the sixth exposure. GWASs were also performed in an independent sample on thirteen MRI outcomes (total brain volume, TBV; grey matter volume, GM; normal appearing white matter volume, NAWM; white matter hyperintensity volume, WMH; TBV as a proportion of intracranial volume, TBVicv; GM as a proportion of intracranial volume, GMicv; white matter volume as a proportion of intracranial volume, WMicv; WMH as a proportion of intracranial volume, WMHicv; a general factor of brain white matter tract fractional anisotropy, gFA; a general factor of brain white matter tract mean diffusivity, gMD; a general factor of brain white matter tract intracellular volume fraction, gIVCF; a general factor of brain white matter tract isotropic volume fraction, gISOVF; a general factor of brain white matter tract orientation dispersion, gOD) capturing different aspects of brain morphology. Publicly available non-UK biobank GWAS data were downloaded to replicate MR findings. More details see Online Methodology.
A valid inference from MR is dependent on satisfying three assumptions: relevance, meaning that the genetic variants must be associated with the risk factor of interest; independence, that the there are no unmeasured confounds of the associations between genetic variants and the outcome; exclusion restriction, that the genetic variants affect the outcome only through the effect they have on the exposure [39].
Instruments for each exposure were identified using SNPs that attained genome-wide significance (P −8). These SNPs were then clumped using the 1000 G European reference panel and an r2 = 0.001, with a 10 Mb boundary. The most significant SNP in each clump was used as an instrumental variable. As all GWAS conducted for this study were performed on the same strand, no palindromic SNPs were excluded from these analyses. The effect of each SNP on the exposure and on the outcome was harmonised to ensure that the effect allele is the same across the exposure and the outcome traits. Steiger filtering was used to ensure that the detected direction of effect (i.e., from exposure to outcome) was correct.
Inverse variance weighted (IVW) regression was used to identify putatively causal effects. If there is only one SNP to be used as an instrumental variable, Wald ratio was used. Sensitivity analyses were conducted using MR Egger regression and MR Pleiotropy Residual Sum and Outlier (MR-PRESSO).
As cognitive ability shows high genetic correlations with measures of educational attainment [21] and shows potential causal effects on income [8]. We applied Multivariable Mendelian Randomisation (MVMR) [40] to examine the direct effects of SES independent of cognitive ability on brain structure. For MVMR, SNPs that were genome-wide significant in both exposures were retained. Steiger filtering was applied for both exposures on the outcome.
To correct for multiple testing, we performed FDR correction for IVW method for each of the following families. These are gSES as exposure on 13 brain MRI phenotypes as outcome (1 × 13 = 13 tests), 13 brain MRI phenotypes as exposure on gSES as outcome (13 × 1 = 13 tests), occupational prestige, household income, and educational attainment as exposures on 13 brain MRI phenotypes as outcome (3 × 13 = 39 tests), 12 brain MRI phenotypes as exposure on occupational prestige, household income, educational attainment, social deprivation as outcomes (12 × 4 = 48 tests), cognitive ability as exposure on gSES, occupational prestige, household income, educational attainment, social deprivation as outcome (1 × 5 = 5 tests), and gSES and occupational prestige, household income, and educational attainment as exposure on cognitive ability as outcome (4 × 1 = 4 tests). Significant threshold was set to FDR
Replication data sets
Replication of significant MR associations was examined using independent GWAS data set of educational attainment (measured as the number of years of schooling an individual has completed) [9] (N = 324,162) and household income [41].
Household income was replicated using the data of Kweon, Burik [41] excluding UKB. Four income measurements (measured as the natural log of income before-tax) were used: household income N = 108,635, occupational income N = 149,997, individual income N = 72,235, and parental income N = 105,667. Household income was meta-analysed with the other three income measurements using MTAG, resulting in a final household income replication GWAS dataset with an effective sample size of 402,029.
The replication data set for education showed a large significant genetic correlation of rg = 0.960, SE = 0.015, P −323 with education in UK Biobank, as did the two household income data sets rg = 0.955, SE = 0.028, P = 1.34 × 10−251.
MiXeR
MiXeR v1.3 (https://github.com/precimed/mixer) was used to examine the genetic overlap between cognitive ability and gSES. First, a univariate model [42] was run to study the polygenicity (i.e. number of variants) of each trait using the Z-score from GWAS summary statistics and 1000 G European LD panel. Second, a bivariate model [43] was used to estimate the genetic overlap (i.e. number of variants shared between cognitive ability and gSES) using the parameters learned from the univariate model. The analysis was repeated twenty times using 2 million randomly selected SNPs at each time. The overlap between cognitive ability with occupational prestige, household income, educational attainment, and social deprivation was also performed. The results across twenty runs were then averaged and the genetic overlap of the best model with the lowest –log likelihood ratio was plotted.