
02Visitor spending in UK cities
This first section establishes six stylised facts about the visitor spending in UK cities, and the lessons that can be learned from them. It looks at: 1) which cities visitors spend in; 2) where they come from; 3) spending based on type of visit; and the 4) importance; 5) geography; and 6) type of visitor spend within cities.
1. A minority of cities are visitor ‘destinations’, and international spend is even more concentrated
Domestic visitor spending in cities is concentrated in just a few places. Figure 1.a shows that just five cities account for half of in-person domestic overnight visitor spend in urban areas.
Figure 1.b shows alongside this the distribution of visits from ONS short-term let data, to calibrate these findings – without equivalent hotel data, this is the best comparable picture available of overnight stays at the city level. The correspondence between these two measures suggests the spending data are a good illustration of the UK urban visitor economy.
Figure 1: Half of all in-person overnight visitor spend occurs in five cities, closely matching the distribution of short-term let visits

Source: Fable Data, ONS 2023. • Notes: ONS short-term lets data refers to ‘…rentals, such as apartments or rooms, booked through three platforms (Airbnb, Booking.com and Expedia Group), excluding other forms of accommodation, such as hotels or campsites’. A ‘visit’ is defined by ONS as any time a short-term let offered by the platforms was occupied.
Unsurprisingly, it is the four largest UK cities that have the largest overnight visitor economies in terms of in-person spend, with London accounting for 30 per cent. But Edinburgh and Blackpool, while the 14th and 45th largest UK cities by population respectively, take the next two spots – these cities punch well above their weight for attracting visitors.
Comparing the visitor spending shares to city population shares identifies which cities are true ‘destinations’ for overnight visitors (Figure 2).
To investigate this, a ‘Destination Ratio’ for each city was calculated. As an example, Edinburgh’s Destination Ratio of 2.4 says the city’s share of overnight visitor spend (3.3 per cent) is 2.4 times higher than its share of the UK’s total urban population (1.4 per cent). This report classes the third of cities with a Destination Ratio above one as domestic visitor ‘destinations’.
Figure 2: About a third of UK cities are ‘destinations’ for domestic visitors

Source: Fable Data, ONS. • Notes: The Destination Ratio on the vertical axis is the overnight city spend share divided by the population of a city as a proportion of total UK urban population. A Destination Ratio above one classifies a city as a ‘destination’ city. The share of overnight city spend on the horizontal axis is presented in logarithmic terms.
There are three cities that receive more than twice as many visitors as their size would otherwise suggest: Blackpool (with a Destination Ratio of 4.9), York (3.4), and Edinburgh (2.4). The next five biggest destinations by this measure (Bournemouth, Milton Keynes, Brighton, Cardiff, and Exeter) all have Ratios above 1.5.
Birmingham clearly underperforms on attracting visitor spend relative to its size. Other large cities that underperform in a similar way include Sheffield, Nottingham, and Leicester, with smaller cities mainly in the Midlands and the North having the fewest domestic visitors.
International visitor spend seems even more concentrated across UK cities. Spending data – which is available for German and Austrian cards only, as set out in Box 1 – can give an illustrative, rather than representative, picture. Even so, the concentration is clear: in this sample, London accounts for 77 per cent of all spend, far ahead of Edinburgh’s five per cent (Figure 3a). The only places that come out as ‘destinations’ for international visitors with this data are London, Edinburgh, Oxford, Cambridge, and Brighton.
Figure 3: German and Austrian card spending data suggests London is by far the leading international tourist destination

Source: Fable Data, ONS. • Notes: Fable Data spend based on German and Austrian cardholders spending in the UK – not representative of all international tourists. ONS short-term lets data refers to ‘…rentals, such as apartments or rooms, booked through three platforms (Airbnb, Booking.com and Expedia Group), excluding other forms of accommodation, such as hotels or campsites’. A ‘visit’ is defined by ONS as any time a short-term let offered by the platforms was occupied. In Figure 3.b, city names highlighted in green are destination cities.
This is corroborated by ONS data on the split between domestic and international visits within short-term lets (Figure 3.b). The top three destinations based on these international spending data are the ones with the highest share of international short-term let occupancy (all over 50 per cent). The share of occupants in short-term lets from international origins drops off quickly – for three quarters of cities this amounts to less than a quarter of occupancies, with many far lower. Blackpool, the biggest domestic visitor destination, has only five per cent of occupations from international visitors.
All international visitor destinations are already domestic visitor destinations, but this is not the case the other way around. So the concentration of international visitor spend suggested by the German and Austrian card spending data could highlight an opportunity for many domestic destination cities – with proven records of attracting visitors – to expand their existing offer to international tourists as this could bring in additional spending from overseas to both the city and the national economy. These destination cities would stand to benefit if UK’s international visitor economy more closely matched the dispersal of the domestic visitor economy.
Taken together, the concentration of visitors across cities shows that the visitor economy currently plays a significant role in a handful of UK cities, and the visitor economy is effectively the domestic visitor economy in most of those places.
2. Most cities mainly attract visitors from their surrounding areas
Most cities have a regional, rather than a national pull. The typical distance travelled for an overnight stay in a British city is 54 miles (or the distance between London and Oxford), and for a day trip just 35 miles (roughly the separation between Leeds and Sheffield). Destination cities have a further reach: the median visitor to these cities travels 68 miles for an overnight stay, and 42 miles for a day trip. This still means the majority of visitors to these cities come from the surrounding regions.
There is plenty of variation between cities. A typical overnight visitor to geographically isolated Aberdeen travels 122 miles, compared to just 28 miles for visitors that Wigan attracts. And not all destination cities are the same. Take Milton Keynes and Edinburgh – both cities see day trippers travel similar distances (31 versus 43 miles), but overnight stays in Milton Keynes are from a similar local pool (42 miles), whereas Edinburgh has a pull three times stronger (120 miles).
The example of Liverpool in Figure 4.a shows how this plays out geographically. Even as a destination city, the vast majority of visitors come from the surrounding areas such as Manchester, Cheshire, and North Wales. Other hotspots from further afield are Leeds and North Yorkshire, and West Coast Main Line and M40/M6 transport corridors also show up.
Figure 4.b shows this in terms relative to the populations of origin local authorities. Visitors to Liverpool from surrounding regions (North Wales, South Lancashire) are vastly overrepresented relative to these places’ population, while all other more distant regions of the UK (particularly the Greater South East) are underrepresented.
Figure 4: Liverpool is a visitor destination, but its pull is mainly regional

Source: Fable Data. • Notes: Visitors grouped by local authority district. Map shows both overnight and day visitors. Liverpool PUA highlighted in green.
The fact that most visits come from a city or town’s immediate vicinity, combined with the uneven geography of the economy in the UK, means that most city visitors will be subject to the same regional economic constraints as locals. Neighbours matter when thinking about what additional spending power visitors can bring to a city’s economy. This is most pertinent to destinations outside the Greater South East: Liverpool as a destination is different to Brighton which, due to its location, has a potential pool of visitors (From London and the Home Counties) with higher average incomes.
The Liverpool example further offers a clue as to how cities could extend their reach and somewhat mitigate these local economic geography constraints: visitor shares are raised along the longer-distance transport corridors that connect the city to further-flung locations.
Destinations can mitigate the issue of regional pull by attracting overnight visitors from further afield. York versus Sheffield illustrates this point: both have similar levels of visitor spending but, based on city size, York is a top visitor destination while Sheffield lags behind (see Figure 2). Figure 5 shows the density of visits from individuals living at different distances from each city, relative to the underlying population. A peak above the horizontal line indicates that the visitors to the city overrepresent places at these distances from the city, whereas troughs below are distances at which visitors are underrepresented.
Figure 5: York expands its reach through overnight visitors, while Sheffield struggles

Source: Fable Data, ONS. • Notes: Horizontal line at zero represents the underlying population density of places at different distances to the centre of each city, taken from MSOA (England and Wales) and IZ (Scotland) estimates of population from 2022. Each density for day and overnight visitors is normalised relative to this line. Northern Ireland is excluded as non-contiguous with rest of the UK. Distances calculated as the crow flies. Densities calculated using visitor home locations at the MSOA level. Density lines exclude the top percentile of visit trips.
This shows that York takes overnight visitors from a wider area compared to its day visitors – the line for its overnight visitors clearly flattens and the peak shifts outwards. Meanwhile, Sheffield’s overnight visitors look much more similar to its day visitors – it does not expand its reach through overnight visits, having less draw than York as an overnight destination from places further afield.
3. Overnight visitors are more valuable, but day trippers account for more total in-person spend
On average across all UK cities, overnight visitors spend more than twice the amount of day visitors in-person – £100 versus £42 per trip. So while overnight trips account for 19 per cent of total visits, they are 35 per cent of total visitor spend.
This means the remaining two thirds of in-person visitor spending is from day visitors. This highlights that the visitor economy is not just the ‘tourist’ economy – for example, in the 2023 Great Britain Day Visit Survey the most common reason for a day trip was to ‘visit friends and relatives’. Just focusing on overnight stays leaves a good portion of the visitor economy out of the picture.
Destination cities nevertheless seem to specialise in maximising spending from overnight visitors (Figure 6) – these cities entice visitors to both stay and spend their money. Destination cities clearly pull to the right-hand side of Figure 6. While some look similar to non-destination cities on spend per day visit, they distinguish themselves from the rest by having high spend among overnight visitors – only in destination cities do visitors spend more than £100 per trip.
Figure 6: ‘Destinations’ have higher-spending overnight visitors

Source: Fable Data.
4. Visitors’ contribution to in-person spend within cities is outsized in a few places
On average, one in every seven pounds spent in-person across all UK cities comes from visitors. Around a third of that amount is due to overnight visitors (four per cent of total in-person spending), and this average is driven by the handful of places that have rates significantly higher than this (Figure 7). In York, for instance, for every pound spent in town by locals, visitors spend 55 pence. In nearby Hull, this figure is just seven pence.
The nature of day and overnight visits differs too. York and Blackpool have similar shares of overnight visitor spend. But overnight trips account for over a half of total visitor spend in Blackpool, versus only a third in York. York captures day trip spend in a way Blackpool does not.
Figure 7: ‘Destination’ cities have visitors contributing to a higher share of local in-person spending

Source: Fable Data. • Notes: Bars show share of total in-person spend within city attributable to visitors. Cities are ordered left to right by the proportion of in-person spend. City names highlighted in green are destination cities.
reveals the top ten domestic destination cities. These cities (from Blackpool to Bristol) all see more than five per cent of local in-person spend accounted for by overnight visitors. These are cities that both attract overnight visitors and have them spend on their high streets.
Of the destination cities, this leaves a remaining dozen or so which clearly have a visitor offer, but where valuable overnight visitors account for less spend within the city – Norwich, Southampton, and Newcastle are some examples. London is the clear exception here, having below typical visitor spend share, despite accounting for by far the largest share across the country. This is testament to the size of its economy – locals also spend a lot on the capital’s high streets.
One thing to consider for these destination cities outside the top ten would be how to ‘convert’ day visitors into overnight visitors, who spend more per trip. In the top ten, Edinburgh, Bournemouth, and Aberdeen (as well as London) get more than 40 per cent of their visitor spend coming from overnight visitors. In contrast, cities such as Exeter, Norwich, and Milton Keynes are destinations where people don’t tend to stay more than a day, getting less than a quarter of in-person visitor spend from overnight visitors.
The other consideration is that the share of in-person spending will also be determined by the size of the rest of the local economy – as mentioned, London is one example, but Blackpool’s high share will also be in part determined by locals’ lack of spending power. Section 2 considers this in more detail, exploring the important role a city’s broader economic success plays in determining the share of spend that comes from visitors.
5. Visitor spending within cities is concentrated
For most cities, visitor spend is more concentrated in city centres than locals (Figure 8).
Figure 8: Visitor spend concentrates in city centres, with a larger gap in geographic spend patterns between visitors and locals in destination cities

Source: Fable Data. • Notes: City centres spend is within MSOAs overlapping standard Centre for Cities’ definitions of city centres. Cities grouped by destination (left) and non-destination (right) cities, ordered by degree of concentration of overnight visitor spend.
The share of overnight visitor spend in city centres is higher than the share for locals for almost all cities. There are only a handful of exceptions to this rule, such as places with significant out-of-town draws.
Figure 8 splits cities by destinations and non-destinations to show that it is not the level of city centre concentration that differs between visitors to the two groups of cities, but the degree of concentration of visitor spend relative to local spend – this can be seen by the wider gap between the local and visitor bars for destination cities in Figure 8. In other words, visitors have far more distinct geographic spend patterns in destination cities than locals whereas, in non-destination cities, they act more like locals. Part of this is due to destination cities being larger on average. But almost half of the destination cities have overnight visitor spend that is more than twice as concentrated in the city centre. This compares to just three non-destination cities (Birmingham, Nottingham, and Leeds).
Figure 9 shows how the geography of this plays out relative to local spend with the example of Manchester (a large visitor destination). Other visitor spend clusters are found around the Trafford centre and Old Trafford stadium – highlighting visitor draws unique to the city – as well as the airport. Local spend is far more distributed across the city.
Figure 9: Manchester’s visitor spend is concentrated in the city centre
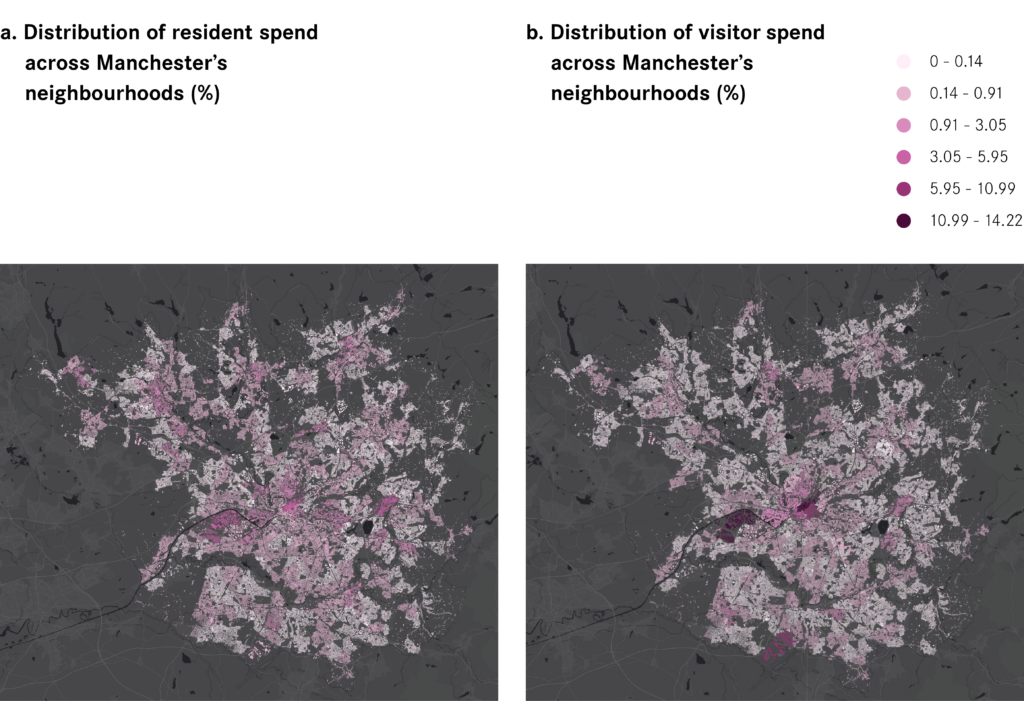
Source: Fable Data, ESRI. • Notes: chart displays visitor and local spend within Manchester PUA, visualising the share of spend that each MSOA accounts for.
This concentration of visitor spend suggests a gravitational pull of visitors towards visitor hotspots, particularly the city centre. This will have implications for the distribution of visitor accommodation which, while likely more dispersed, would be concentrated around these hotspots. As a result, any city region looking to implement a levy on overnight stays (as exists in Liverpool or Manchester, see Section 2) should expect to disproportionately raise revenue from the authorities containing these hotspots – this will invariably include the central authority.
6. Visitors help sustain a larger chunk of amenities in destination cities
What visitors spend on in UK cities differs from local residents’ spending, as Figure 10 shows.
Figure 10: Day visitors go shopping, overnight visitors eat out

Source: Fable Data. • Notes: Consists of all spending across all UK cities. Day visitors by definition do not spend on accommodation. Retail excludes supermarkets, produce shops, corner shops and chemists (all within Groceries).
This clearly shows visitors are not simply ‘additional locals’ when it comes to their spending. Almost half of local spend across all UK cities is on grocery shopping. In contrast, over half of visitor budgets are spent on a combination of shopping and eating and drinking out, compared to a third of local spend. Day visitors tend to focus on shopping, while overnight visitors opt more for eating out – this is the largest proportion of their spend, even with a fifth of in-person spend going on accommodation. And all visitors spend four percent of their budgets on culture and leisure activities, four times the proportion of locals.
So shopping, eating, drinking, and entertaining are where visitors have an outsized influence on in-person spend on typical ‘high street’ activities. Figure 11 sets out how this varies across cities (relative to visitors shares across all spending), showing that visitor destinations tend to have high visitor shares of spending in at least one of these categories.
Figure 11: ‘Destination’ cities have high visitor spend share in retail, food, and entertainment

Source: Fable Data. • Notes: Bars show share of total in-person spend within city attributable to visitors. Dots are the share of total in-person spend within city in a particular spend category attributable to visitors. City names highlighted in green are destination cities.
Culture and leisure is a small proportion of overall spending, but is very reliant on visitors in many places. Three quarters of Blackpool’s in-person culture and leisure spending is from visitors. York, Brighton, Newcastle, Bournemouth, and Nottingham all see more than half of spend from visitors on these activities.
Retail spending among visitors is more concentrated in specific locations. Exeter, Milton Keynes and Southampton are destinations with retail offers more tilted toward visitors. Meanwhile in Blackpool, Bournemouth, and Liverpool, visitors are not particularly influential on local in-person retail spend.
In almost all cities, destinations or not, visitors have an outsize impact on food and drink spending. Visitors spend more in total on eating and drinking out in York than locals (they also account for over 40 per cent of in-person retail spend in the city).
This means that, in visitor destinations, visitors can sustain variety in merchants that locals otherwise could not. Take York, where more than half of local spending on food and drink places is from visitors. The spending data identify over 700 separate food and drink establishments in the city, or 3.5 per 1,000 residents. In similar-sized Swindon, this figure is just 2.2 per 1,000, despite Swindon’s local economy being significantly stronger, based on average workplace wages.
The type of establishments sustained in each place differs too. In York, 54 per cent of total spend on food and drink is in cafes and restaurants versus 23 per cent in fast food establishments. The figures for Swindon are 39 versus 37 per cent. Overnight visitors are a big driver of this – in York, they spend four times more of their eating-and-drinking-out budget on restaurants compared to fast food. Having an established visitor economy is a path to increase the amenity offer of a city’s high street to locals in ways a less visited city may struggle.
Spend per overnight visit on different activities gives a sense of how the visitor offer varies across different cities – Table 1 shows the top ten cities for retail, food and drink, and culture and leisure.
Table 1: Top ten shopping, eating out, and entertainment cities based on spend per overnight visit
Source: Fable Data. • Notes: Bolded places are ‘destination’ cities – cities with higher share of UK urban overnight visitor spend relative to the share of UK urban population. Figures rounded to the nearest full pound.
Considering each in turn:
- Retail: Many of the top ten cities are the primary shopping offer in their area. Newcastle city centre and the Metro Centre bring in a lot of spending from overnight visitors (Zara, John Lewis, Primark are top destinations), with Milton Keynes playing a similar role. Meanwhile places like York see more spend in high-end (such as jewellers), independent, and souvenir shops. Exeter and Glasgow straddle both these roles as retail destinations. A striking result is that seven of the top ten have an Ikea. Overnight visitors seem to get their furniture and then go on to do other spending, highlighting the value of having large, flagship retailers in a city. At the other end, in places like Southend, Wigan, and Aldershot – all of which have larger shopping destinations nearby – overnight visitors spend less than £10 per head on retail.
- Food and drink: This is the largest spend category among overnight visitors. Top destinations for this kind of spend are mainly places with a large variety of restaurants and cafes (Edinburgh, York, London) but also include Blackpool with its offering of pubs and fast food. At the bottom of the rankings, overnight visitors to places like Slough, Warrington, and Burnley spend less than a third of those at the top.
- Culture and Leisure: Blackpool is the only city where walk-up culture and leisure spending makes up a serious proportion of a visitor’s city break budget. Below it are the other seaside cities of Chatham, Southend, Bournemouth, and Brighton with their traditional offering of amusements, and funfairs. Belfast (Titanic experience), Edinburgh (the Castle), and Liverpool (The Beatles Story) have spending anchored by cultural attractions. Derby and Nottingham specialise in nightlife.
Overall, zooming in to the type of spending visitors do in each city shows where visitors are ‘additional’ in the types of local services they support, and provides a pen portrait of the type of offer that different destinations make to visitors.