
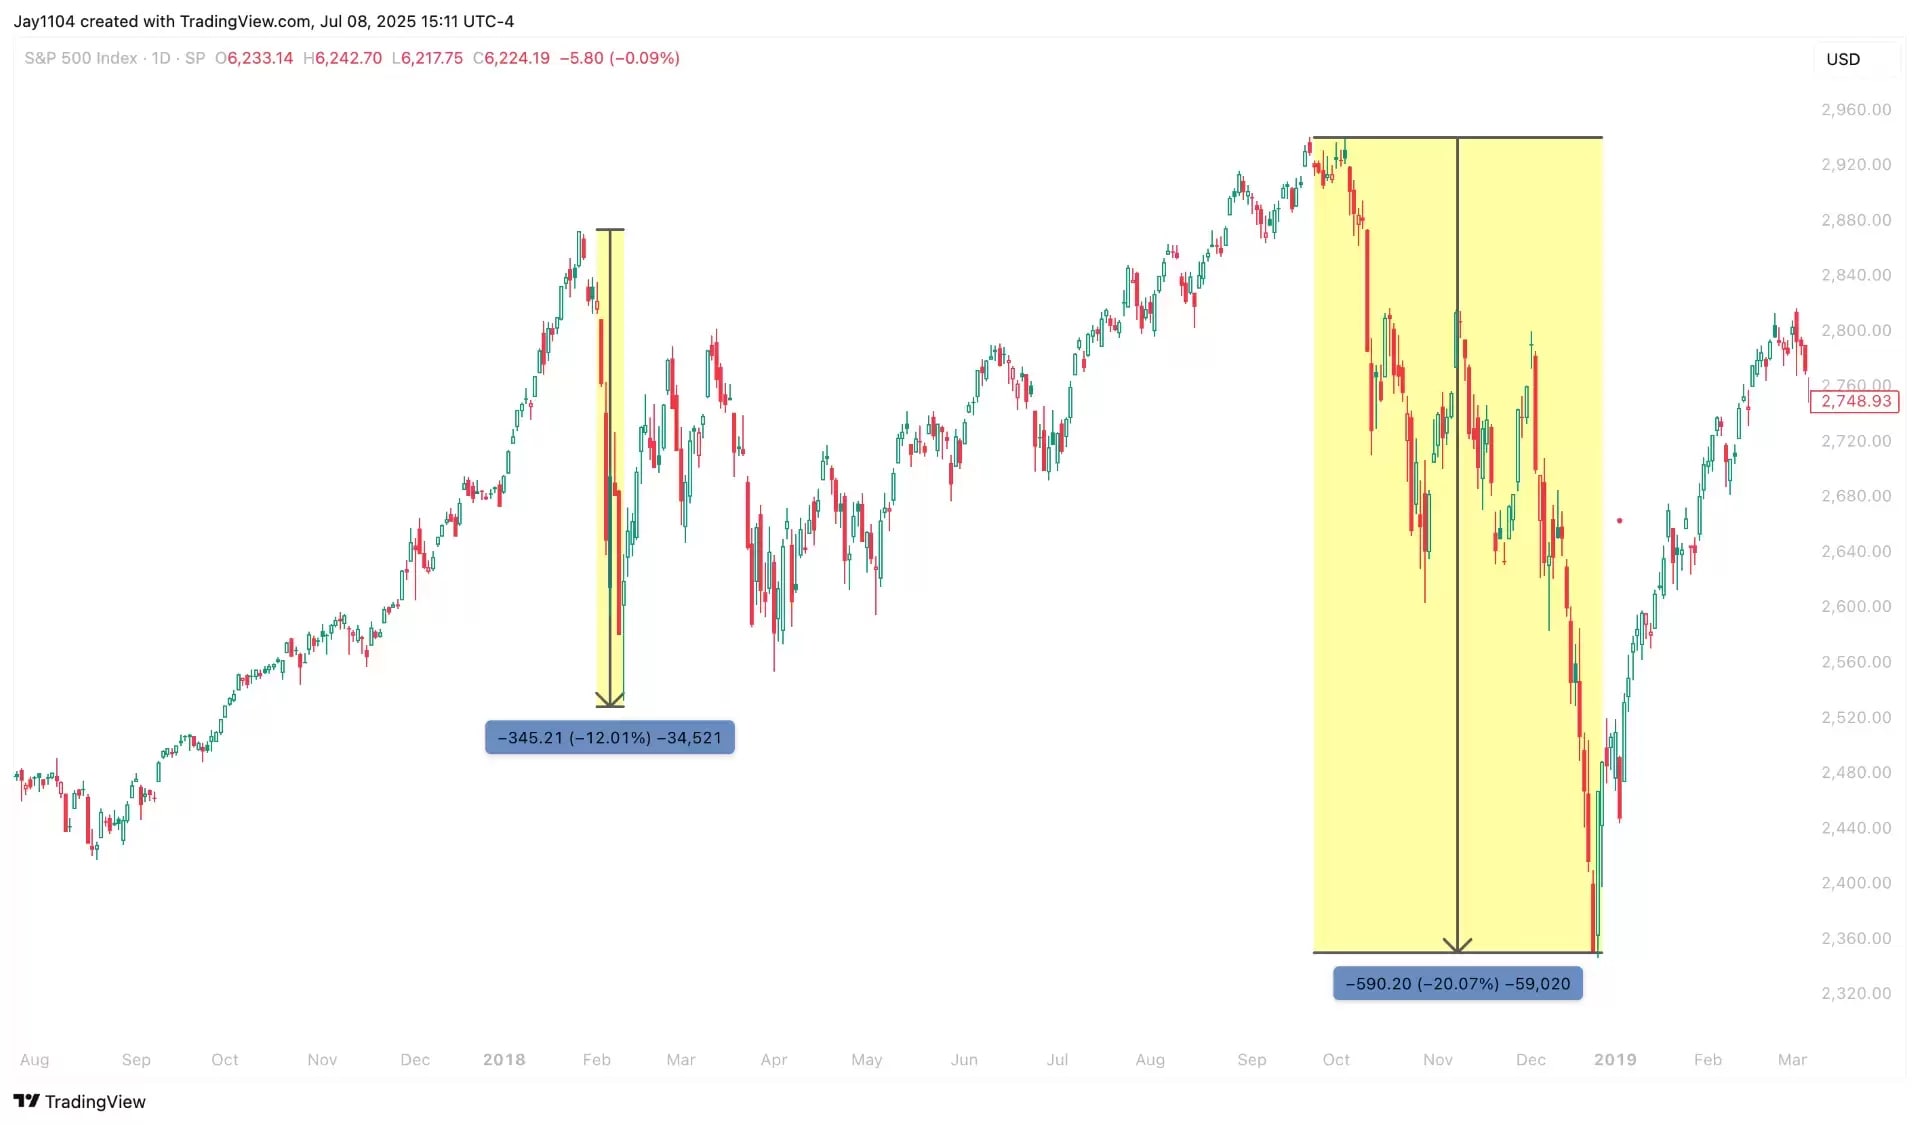
You may not recall or perhaps weren’t active in the markets during 2018, but that year experienced a sharp sell-off in January and February, followed by a brief recovery before finally bottoming out on 2 April, amid the initial phase of the Trump 1.0 trade war, mainly with China. A substantial rally followed this downturn in US equities, driving the S&P 500 to new highs, only for everything to collapse dramatically in the final quarter of the year as economic impacts finally took hold.
If this narrative sounds somewhat familiar, that’s because we are experiencing similar conditions today. History tends to repeat itself, and the damage from current tariffs may not become apparent until the latter half of 2025. In 2018, a combination of tariff impacts and the US Federal Reserve’s slow rate reduction, despite clear signs of an economic slowdown, catalysed the sharp year-end sell-off.
The bottom line is that we can expect to see more volatility in the second half of the year, not just in the stock market, but also in interest rates, currencies, and commodities.
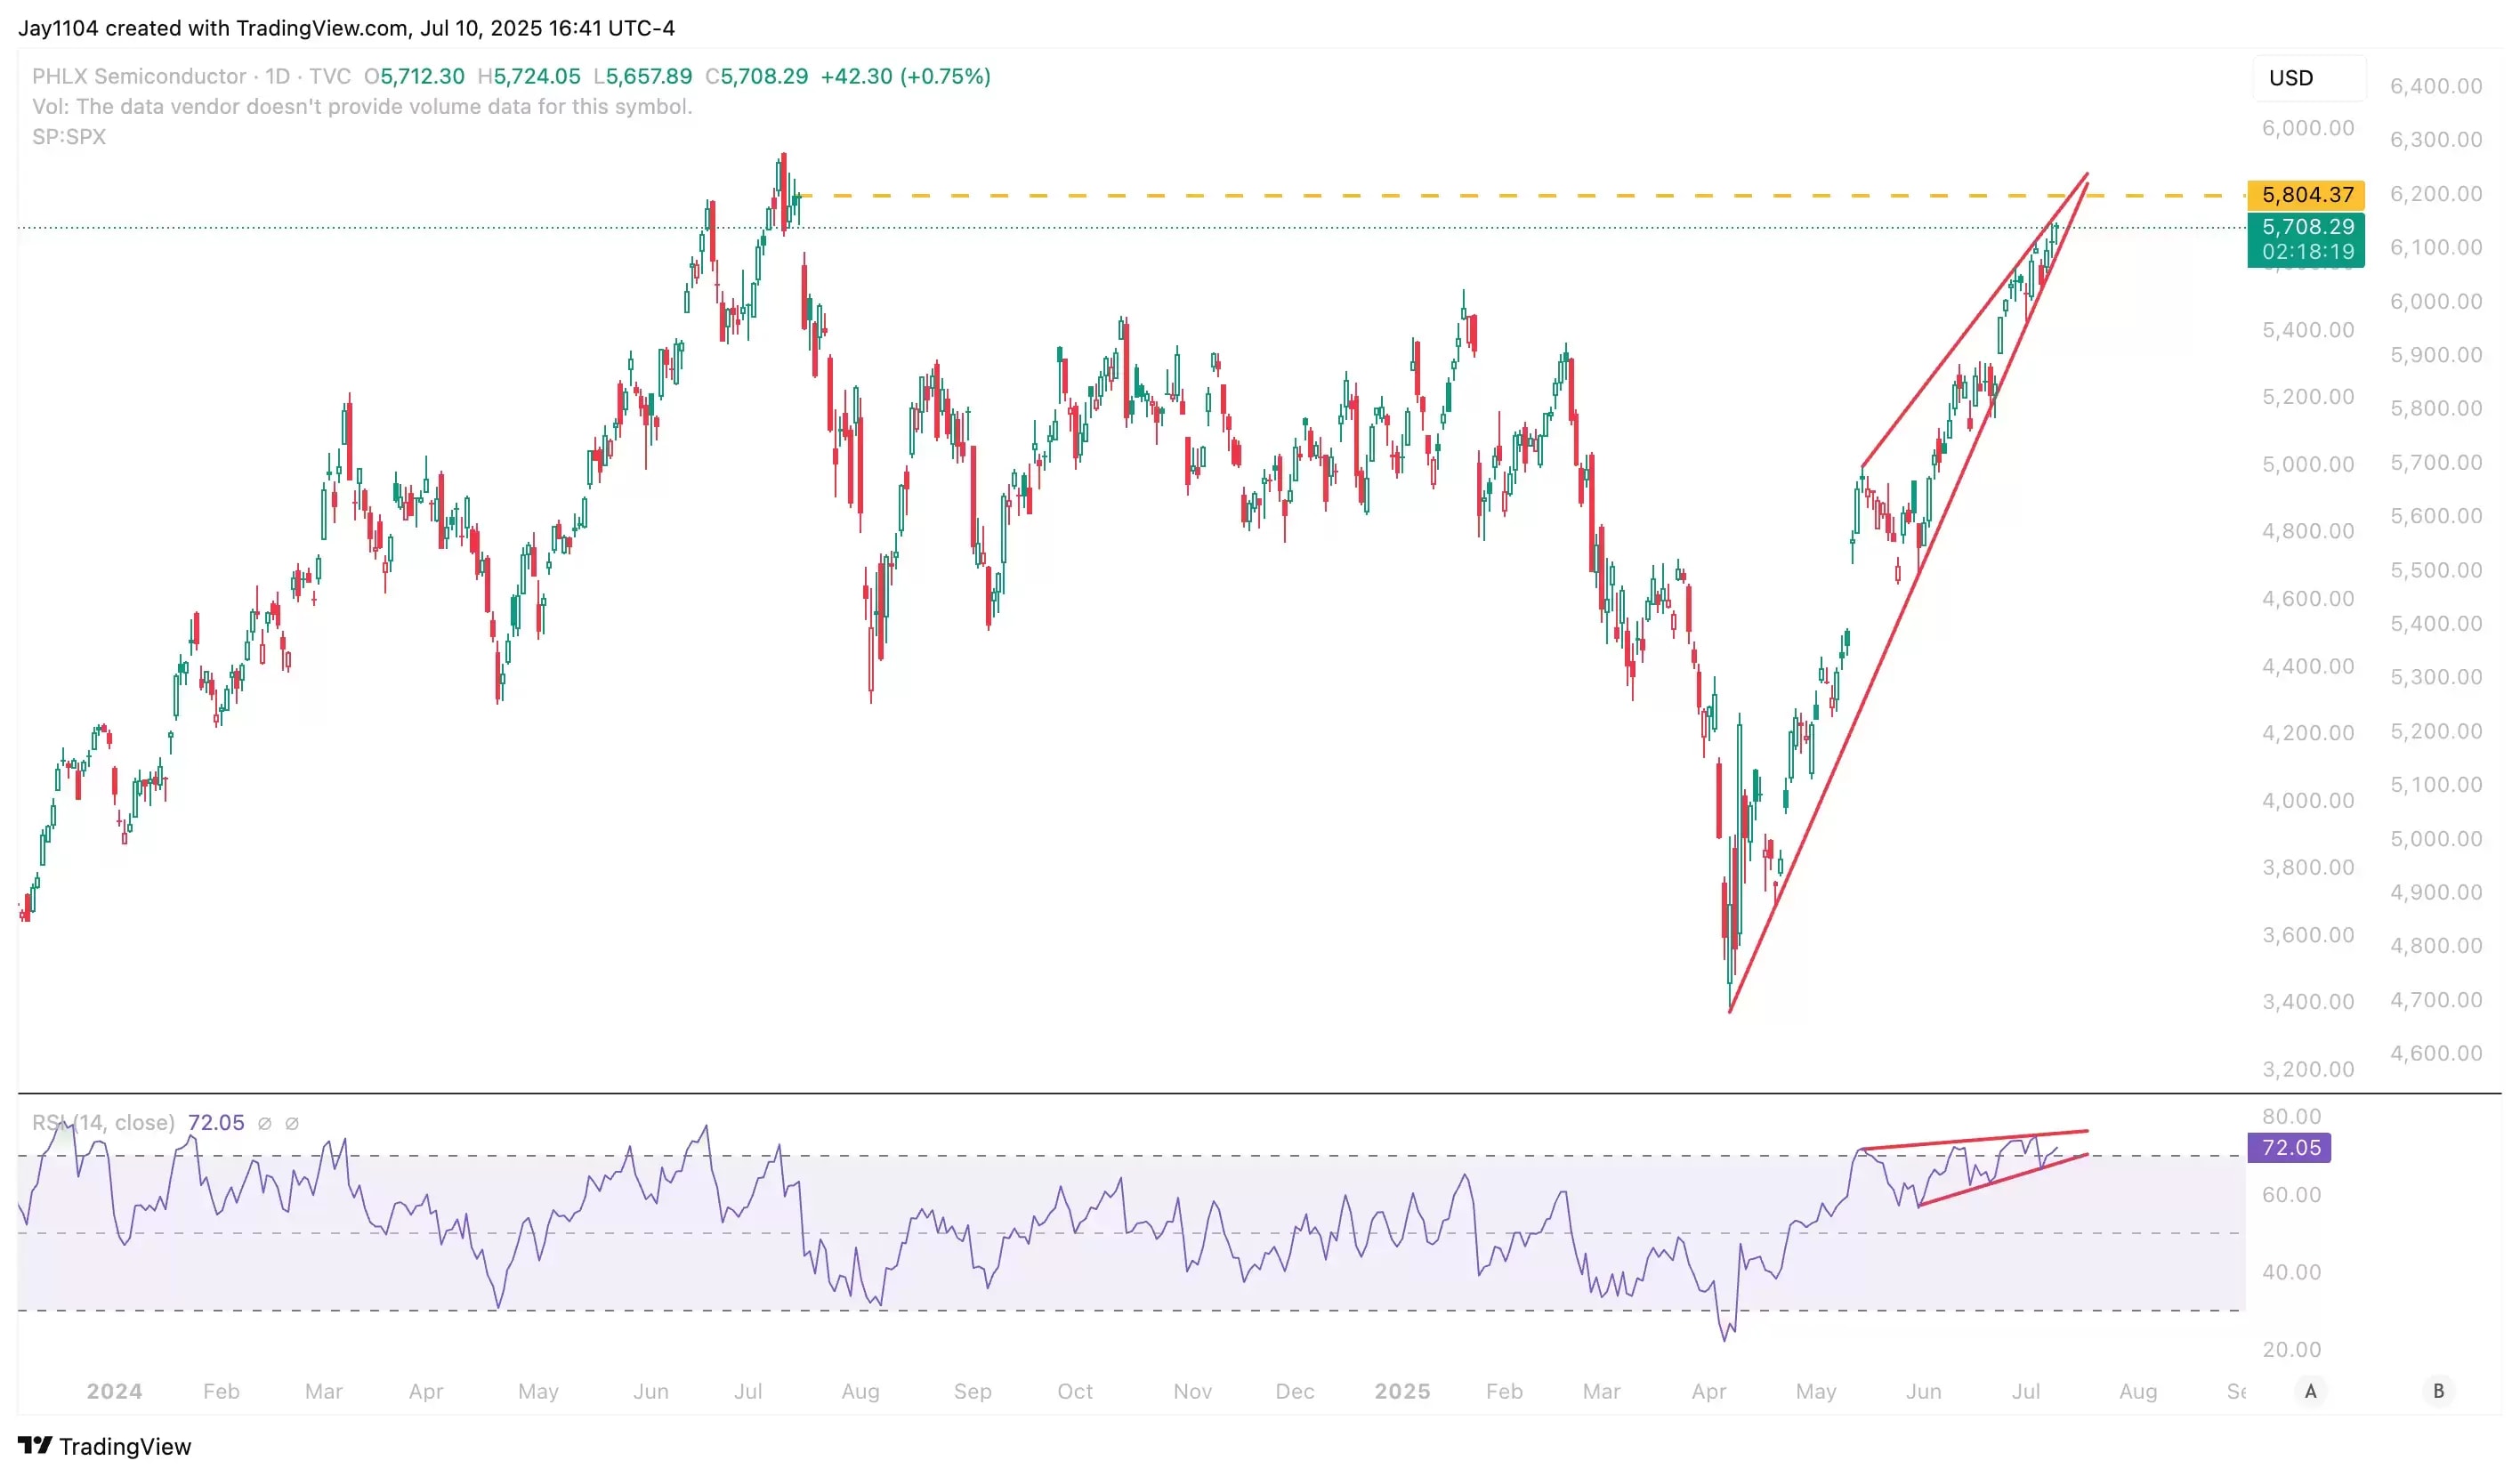
Given the recent surge in AI and technology stocks, along with new tariffs imposed on Japan and South Korea, as well as a 50% tariff on copper and potential tariffs on Taiwan, the risk of a severe backlash in the technology sector in the second half of the year is heightened.
The PHLX Semiconductor Index (ETF: SOXX) has been trending upward and, notably, appears to be forming a rising wedge pattern as it attempts to fill a gap from July 16, 2024. Significantly, this rising wedge pattern is also evident in the relative strength index (RSI). A break below this uptrend would not only indicate a possible trend reversal but also signal the breakdown of the rising wedge, implying substantial downside risk.
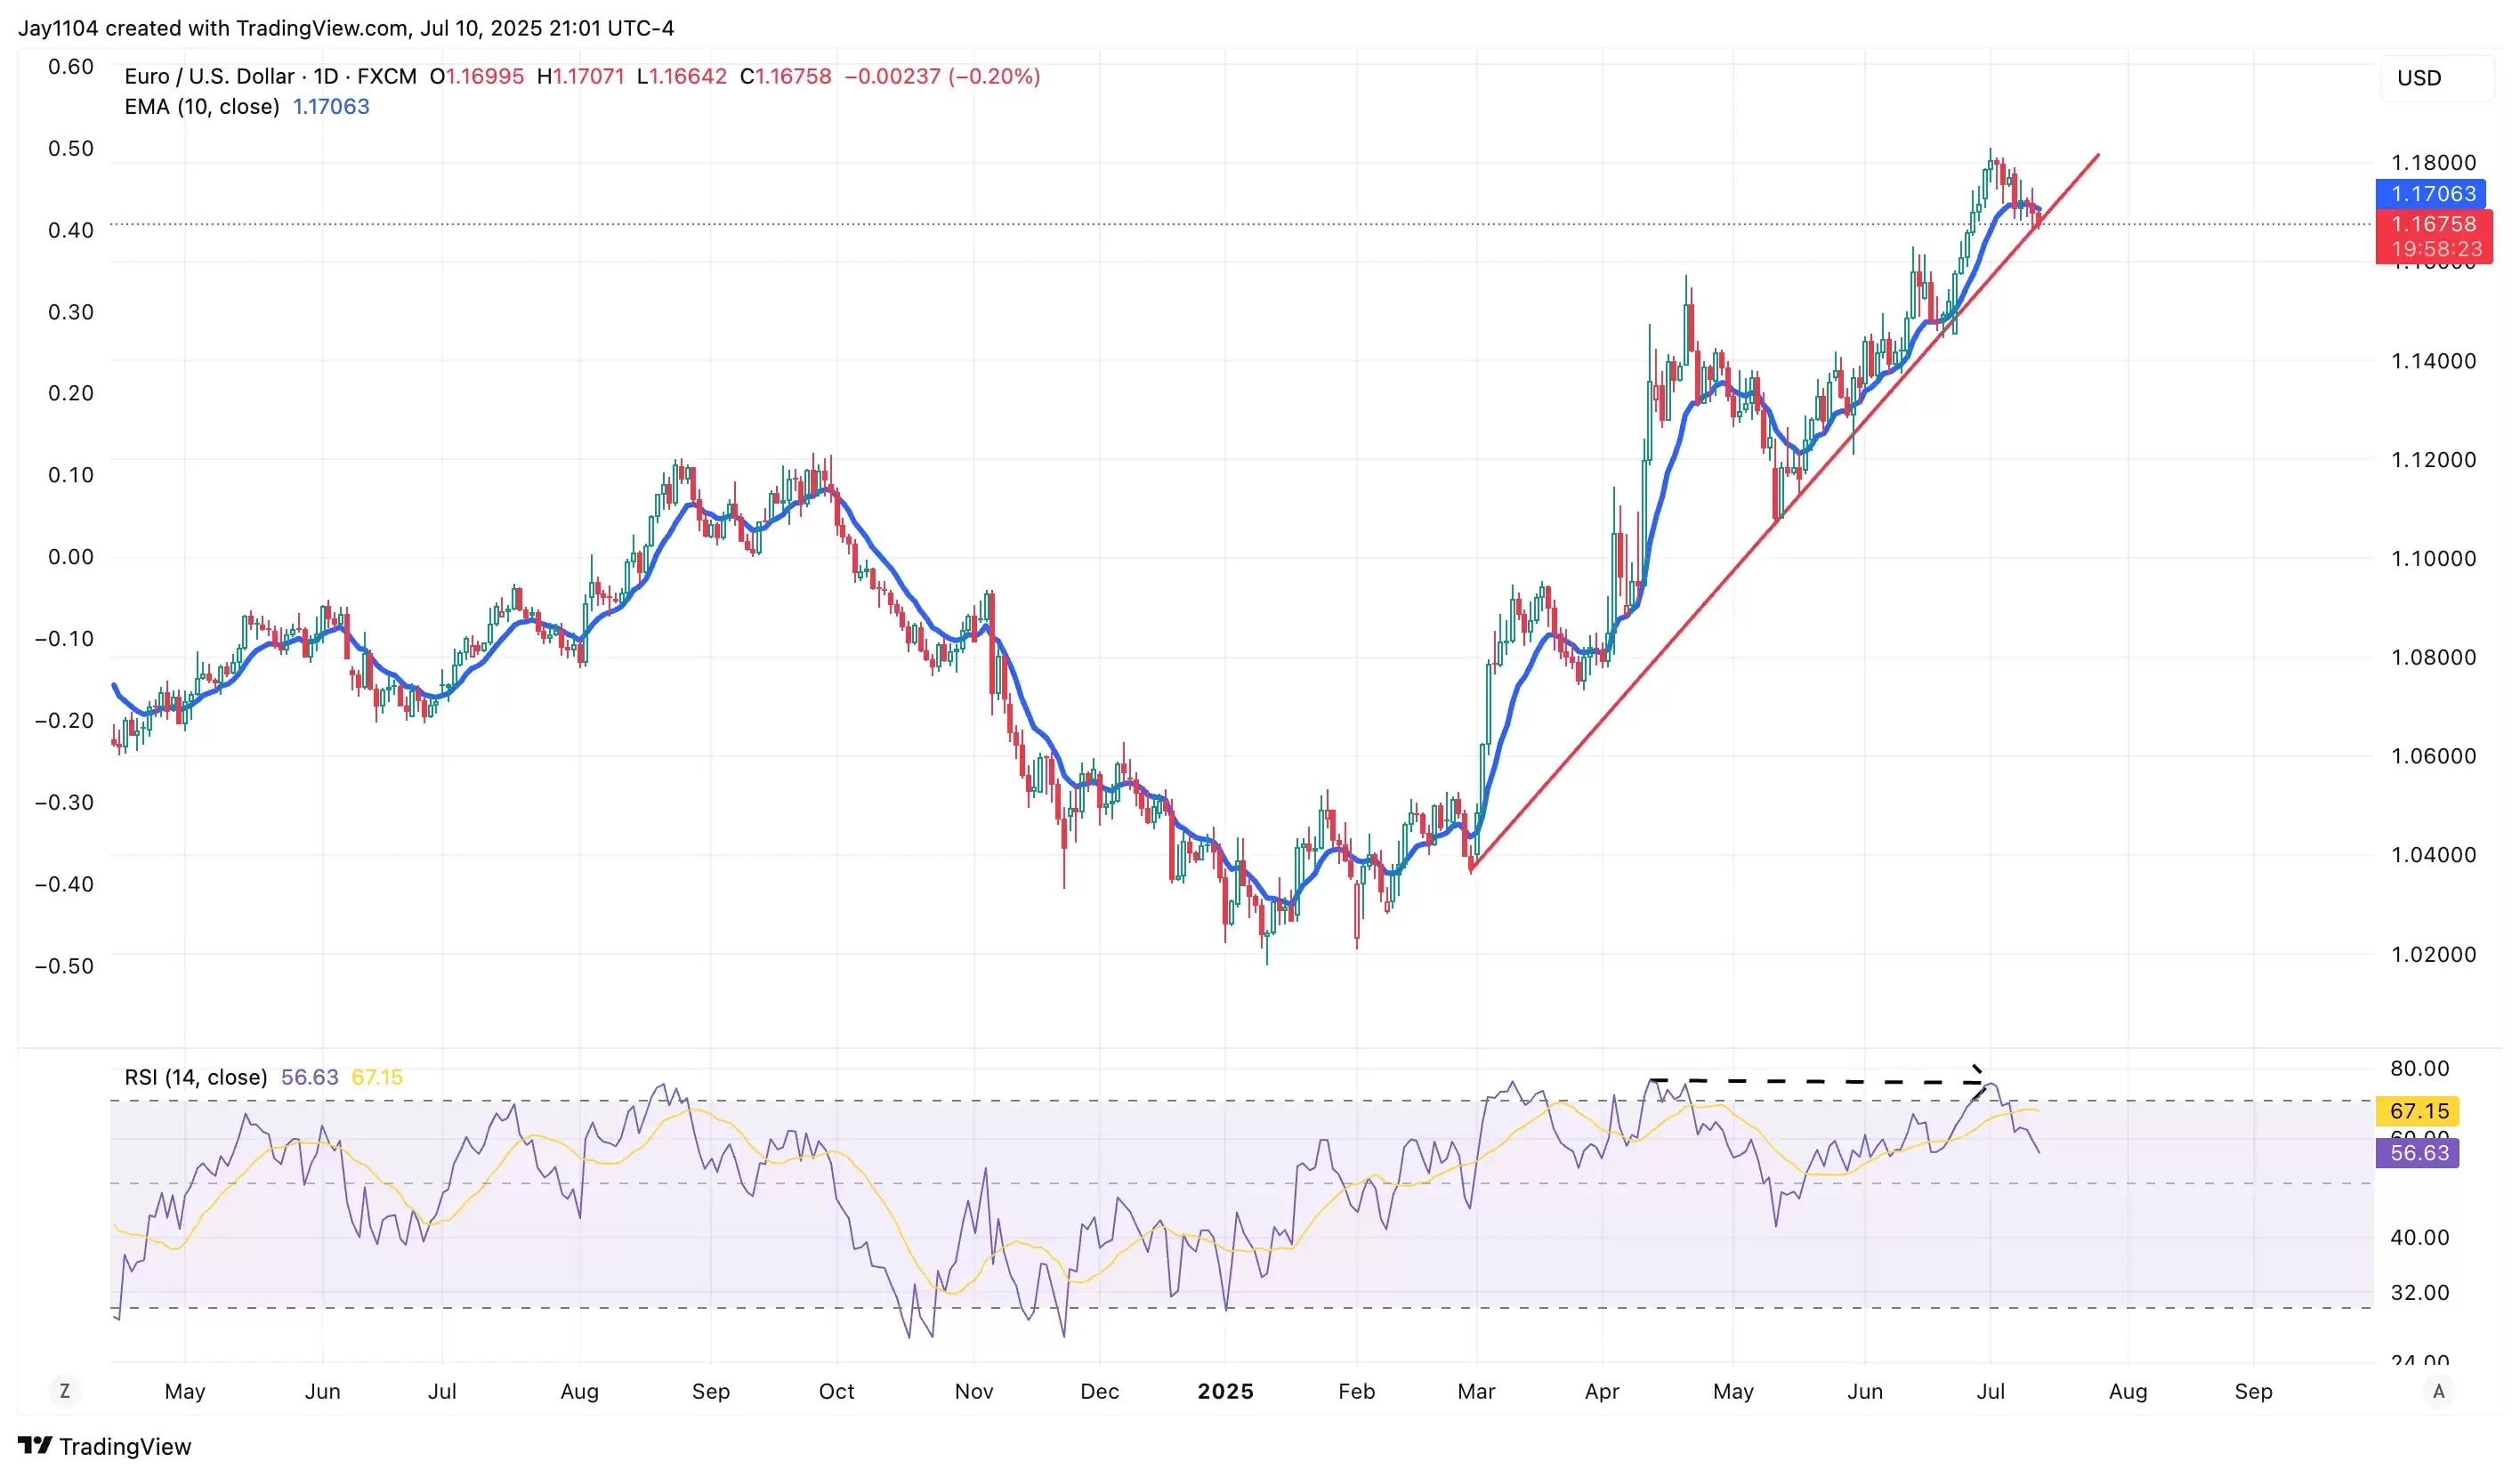
One thing that is beginning to evolve similarly to 2018 is the current dollar weakness, which was subsequently followed by a period of dollar strength. The charts today suggest that the dollar may be starting to turn higher again.
Although subtle, the RSI for the EUR/USD recently formed a lower high, reaching 75.3 on 1 July, after peaking at 76.1 on 11 April. Meanwhile, the price chart made a higher high – a potential sign of bearish divergence. Currently, the 10-day exponential moving average has been serving as support for the euro; however, a break below this moving average would set up a critical test of the uptrend in place since the end of February. Breaking that trend line around 1.16 would indicate the euro’s strength is over, and the dollar is likely to return to dominance.
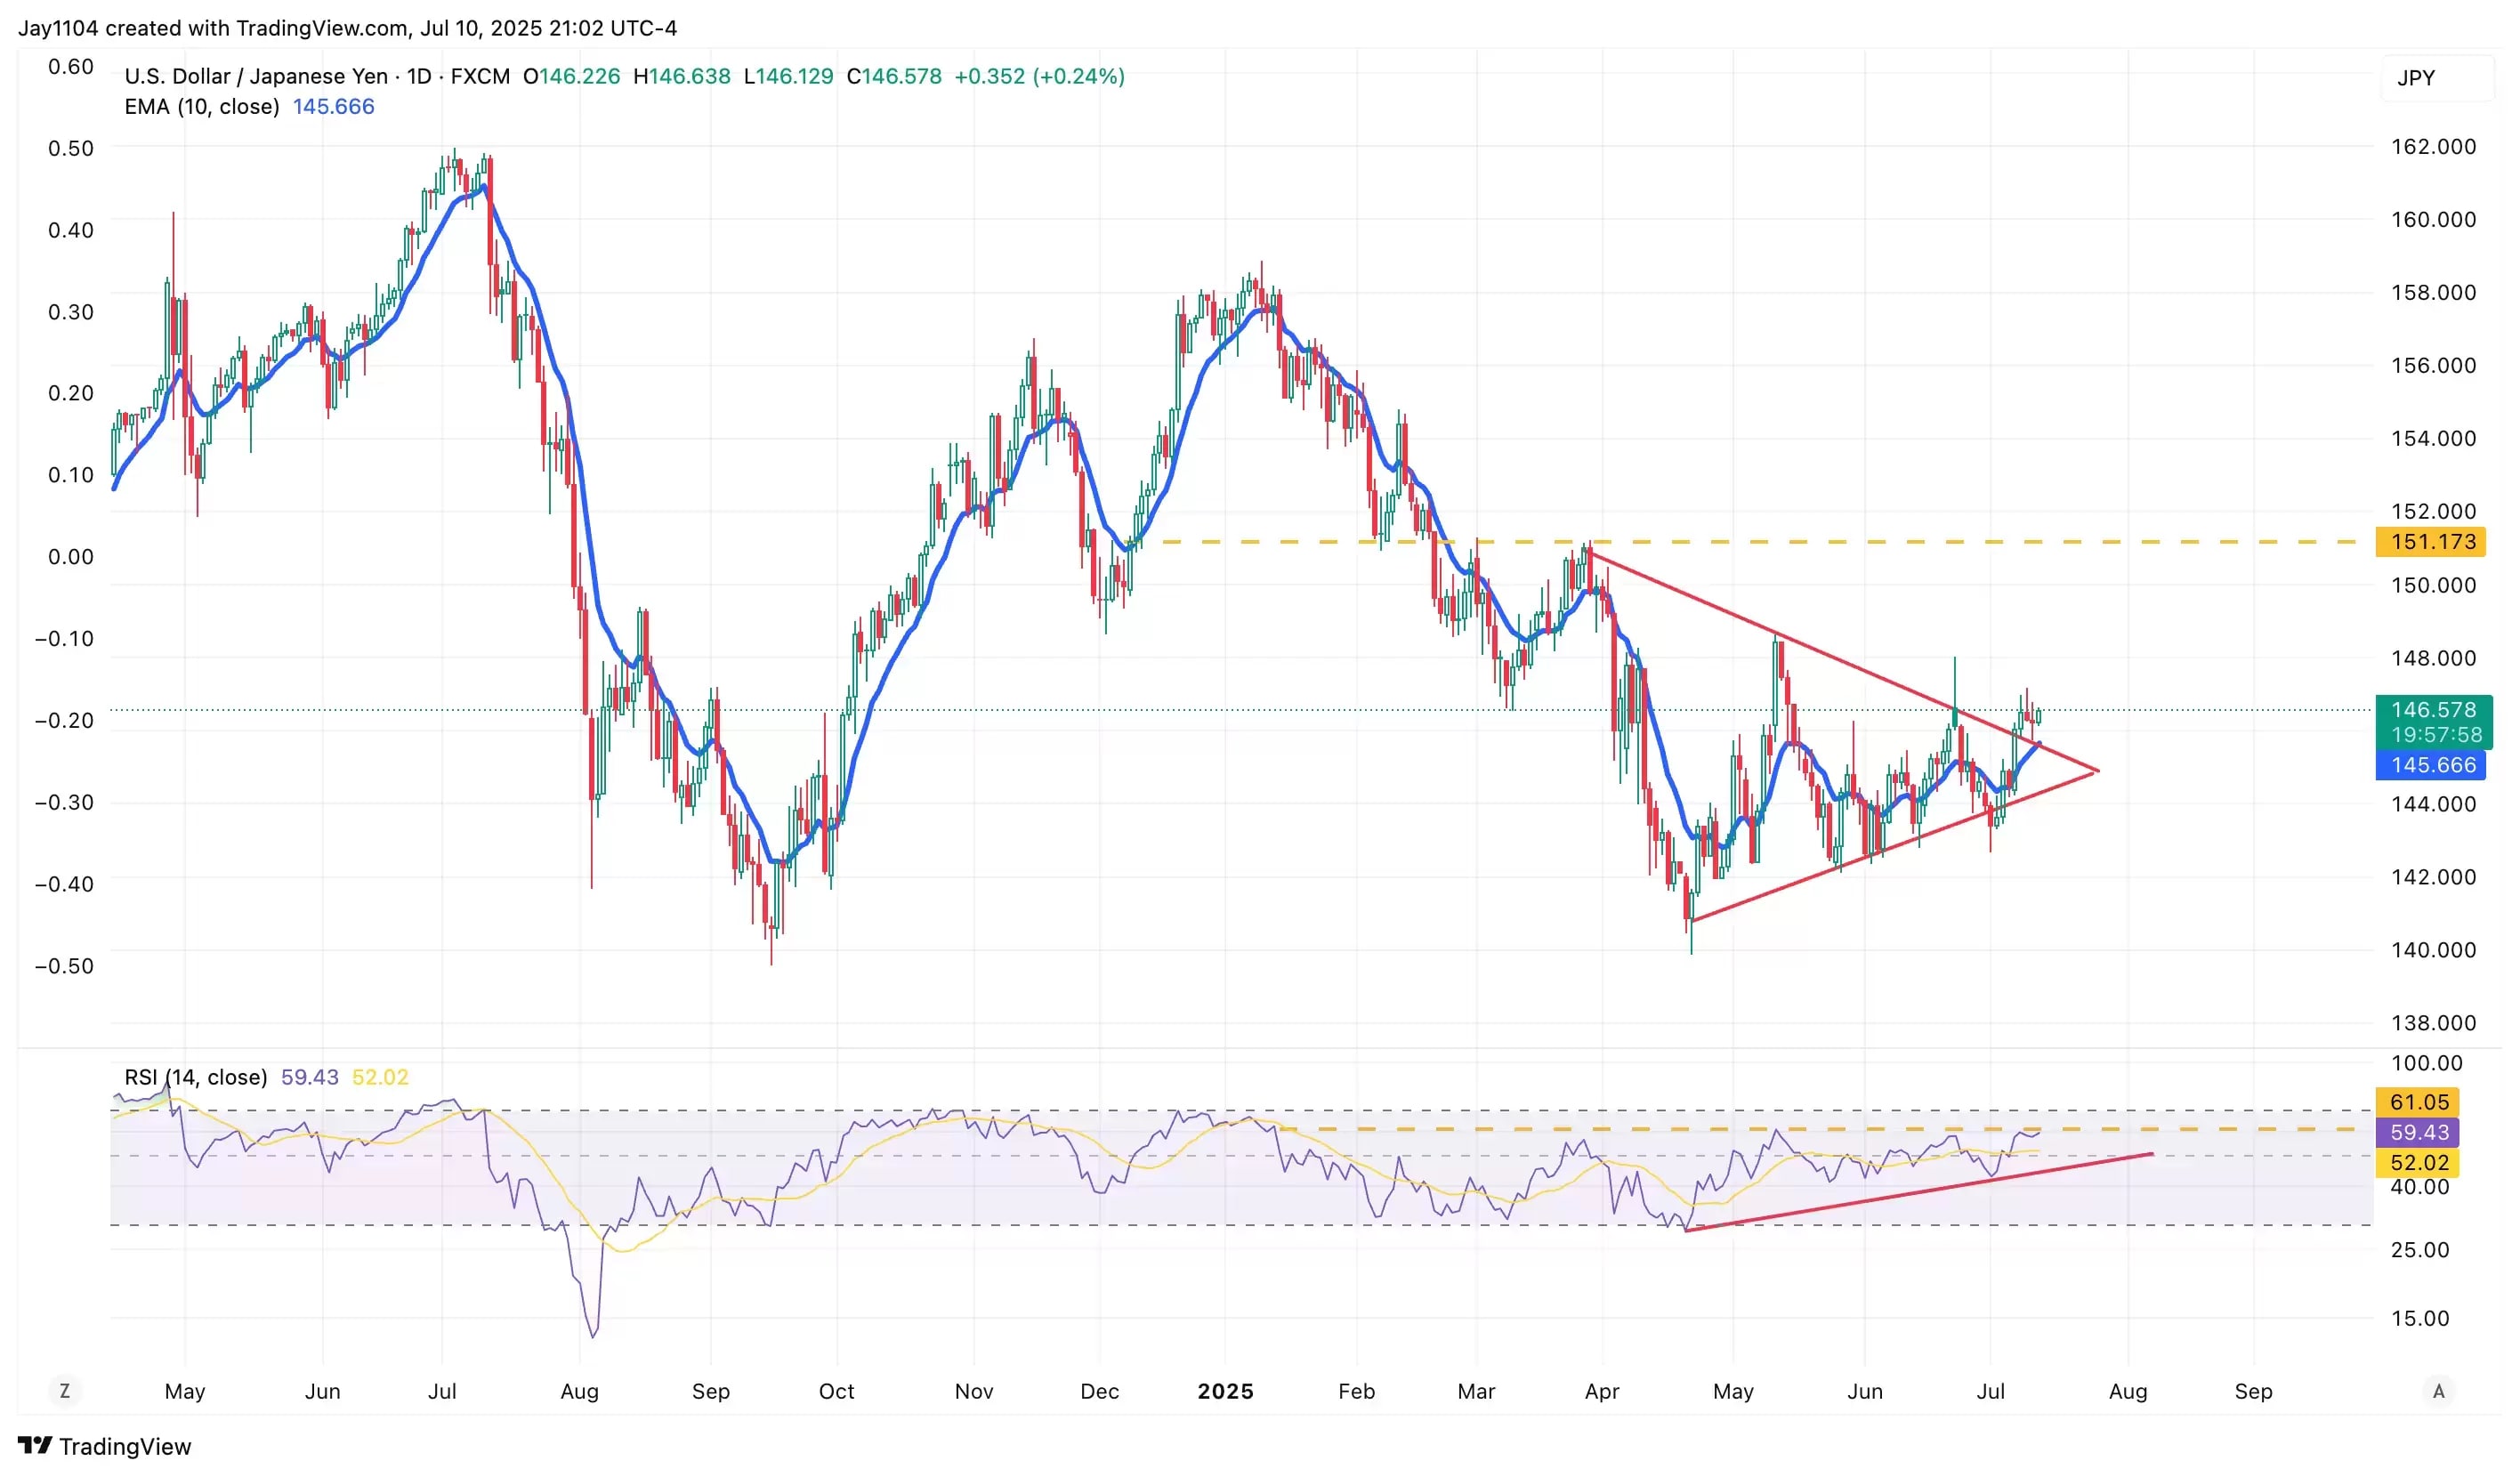
 Something similar is happening in USD/JPY, with the yen showing signs of weakness as USD/JPY moves above a trendline forming a triangle pattern. This upward break could signal an early trend reversal, potentially driving USD/JPY back above 150.
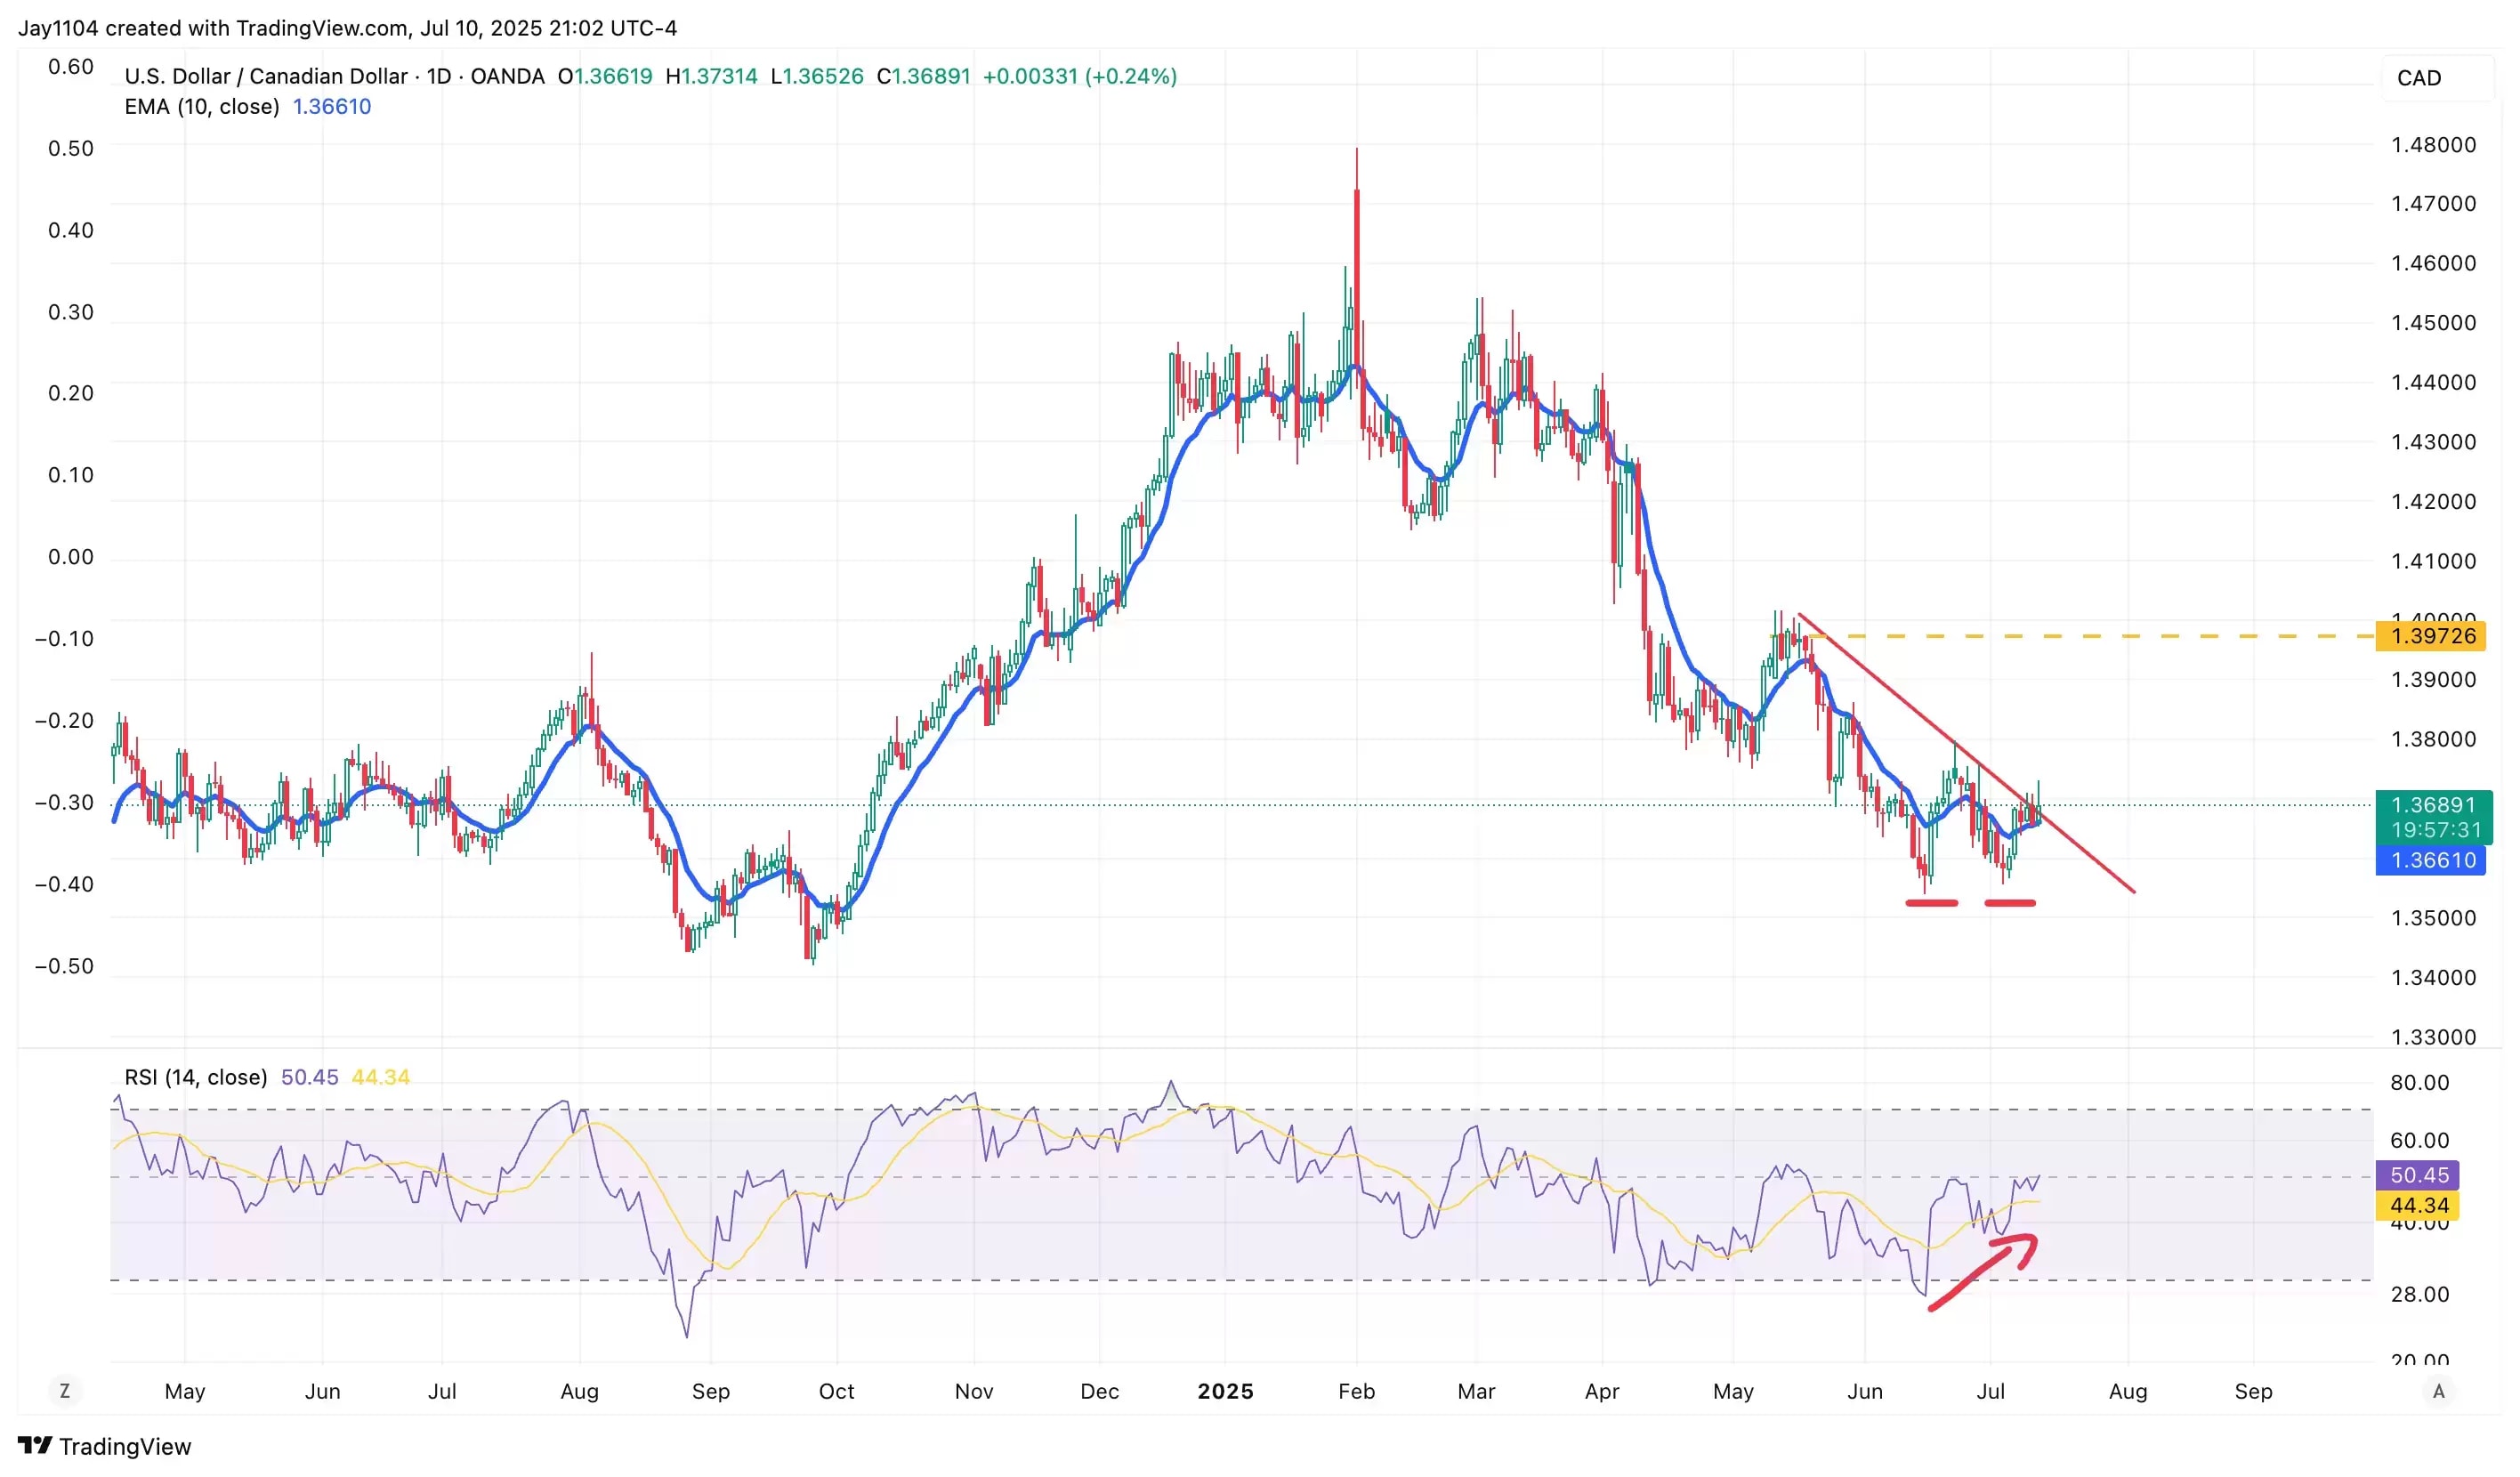
 This is also clearly visible in USD/CAD, which shows an RSI trending higher and the potential formation of a double bottom on the price chart. Most importantly, USD/CAD is nearing a break of its current downtrend, and should that occur, the Canadian dollar could weaken materially against the US dollar, potentially moving towards 1.40.
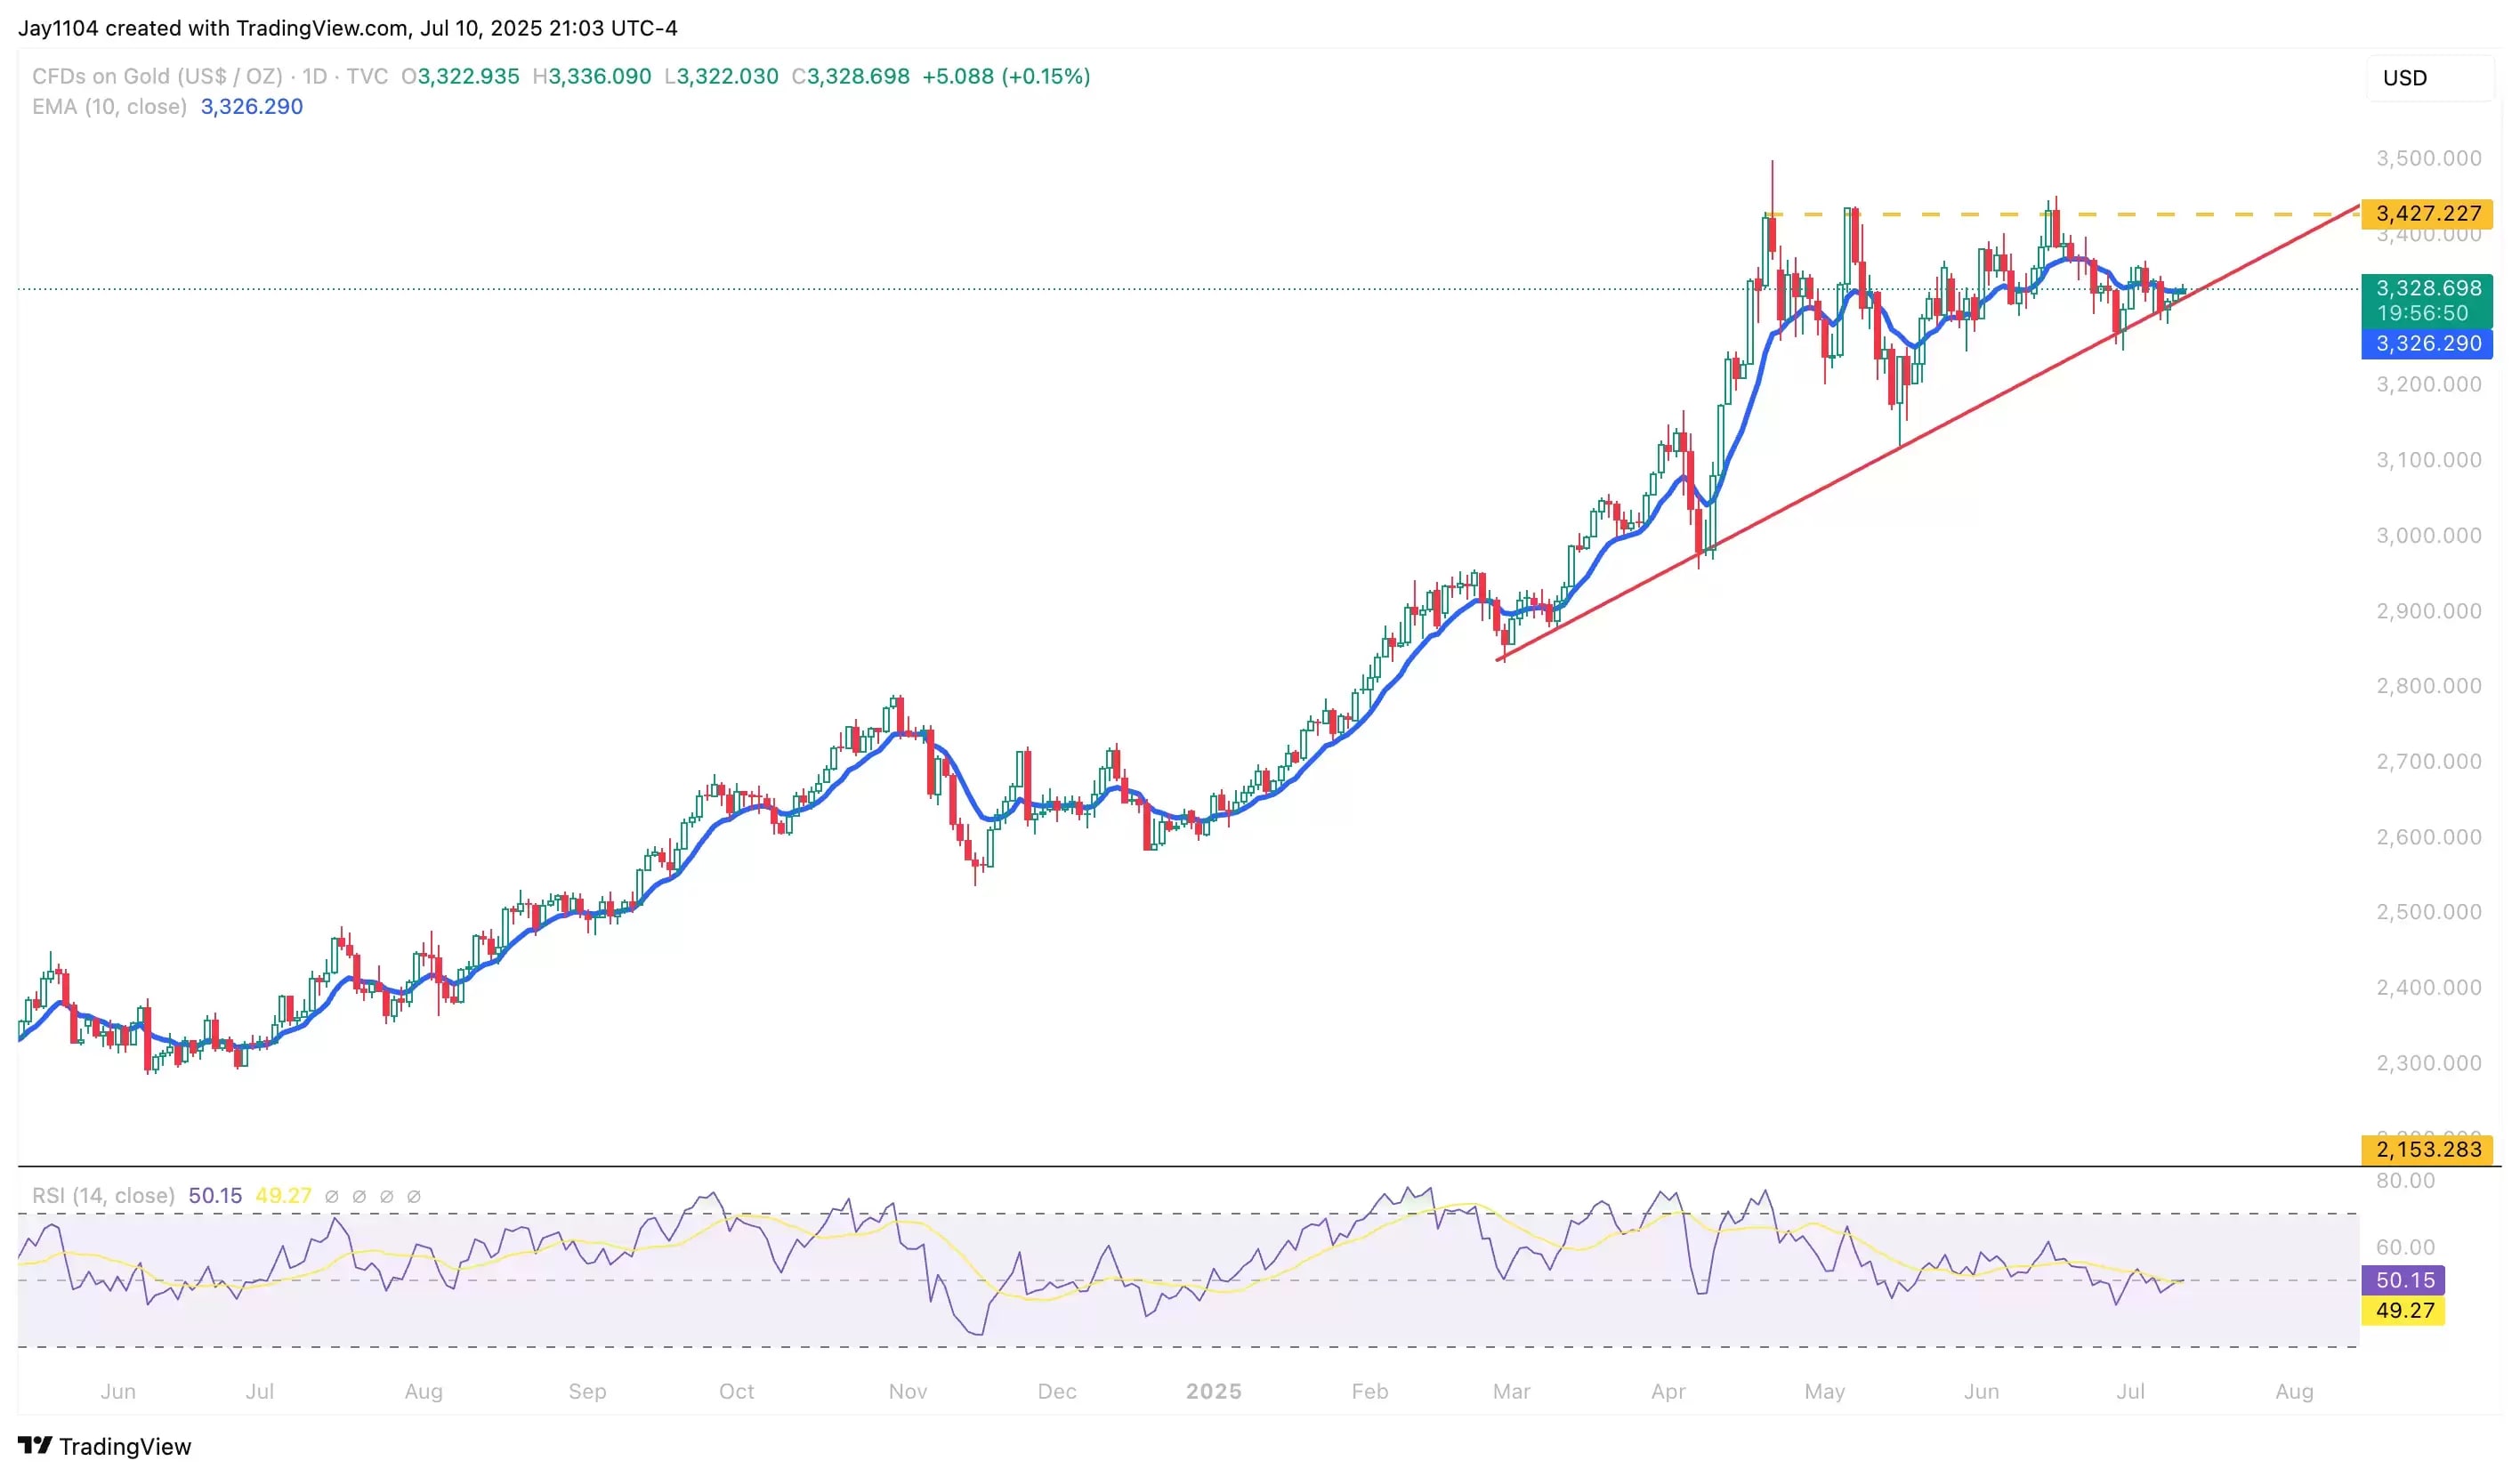
 A resurgence in the dollar would also be bearish for gold. Given that gold has experienced fading momentum over recent weeks and, importantly, is now testing an uptrend dating back to late February, it suggests that gold could also trend lower in the second half of 2025.
With tariff rates and timelines often being a moving target, it’s clear that timing their exact impact – or determining if they’ll have an impact at all – is challenging. One thing, however, is sure: tariffs have been a topic President Trump has discussed for decades. It appears they’re here to stay, and their effects are yet to be fully realised.
 Find your flow: four principles for trading in the zone
Learn about the four trading principles of preparation, psychology, strategy, and intuition, and gain key trading insights from some of the world’s top investors.
Disclaimer: CMC Markets is an execution-only service provider. The material (whether or not it states any opinions) is for general information purposes only, and does not take into account your personal circumstances or objectives. Nothing in this material is (or should be considered to be) financial, investment or other advice on which reliance should be placed. No opinion given in the material constitutes a recommendation by CMC Markets or the author that any particular investment, security, transaction or investment strategy is suitable for any specific person. The material has not been prepared in accordance with legal requirements designed to promote the independence of investment research. Although we are not specifically prevented from dealing before providing this material, we do not seek to take advantage of the material prior to its dissemination.

