Patient characteristics
The patient characteristics are summarized in a table (Table 1). Among the 132 patients included in this study, 79% were female and 21% were male, yielding a female-to-male ratio of approximately 3.8:1. The median age was 56 years. Regarding tumor location, the most common site was the medial incisura, accounting for 48 tumors (36%), followed by the posterior petrous (21 tumors) and anterior petrous (16 tumors) regions. Tumor location classification was performed as described in the Methods section, and interobserver agreement was excellent, with a kappa value of 0.897. Histological classification based on the 2021 WHO criteria revealed that the majority of tumors were WHO Grade 1, including meningothelial (n = 72, 55%), transitional (n = 29, 22%), fibrous (n = 22, 17%), psammomatous (n = 3, 2%), angiomatous (n = 1, 1%), and secretory (n = 1, 1%) subtypes. A smaller subset of tumors was classified as WHO Grade 2, comprising atypical (n = 3, 2%) and clear cell (n = 1, 1%). The distribution of pathological subtypes across molecular groups is summarized in a supplementary table (Extended Table 1). Meningothelial histology (n = 54, 76%) was predominant in Group A, while fibrous (n = 20, 44%) and transitional subtypes (n = 14, 31%) were enriched in Group B. In contrast, Group C exhibited a more heterogeneous distribution, including a relatively higher proportion of meningothelial (n = 8, 50%), transitional, and fibrous subtypes. Notably, the majority of Group C tumors (14 out of 16, 88%) were classified as WHO Grade 1, despite their molecular features being associated with poorer prognosis. Gross total resection (GTR) was achieved in 86 cases (65%). The median follow-up period was 3.1 years, during which 20 patients (15%) experienced tumor recurrence. We also examined the association between extent of resection, postoperative radiosurgery, and recurrence across the molecular groups (Extended Table 2). While there were no significant differences in the extent of resection or frequency of postoperative radiosurgery, recurrence was observed significantly more frequently in Group C tumors (p = 0.028).
Table 1 Patient characteristics of the cohortTable 2 Univariate and multivariable analyses of tumor recurrence in posterior fossa meningioma after gross total resectionGenetic profiles and anatomical distribution
The genetic profiles of the tumors are illustrated in a figure as an oncoplot (Fig. 2). Based on the grouping described in the Methods section, 71 tumors (54%) were classified as Group A, 45 tumors (34%) as Group B, and 16 tumors (12%) as Group C. In Group A, the most common mutation was TRAF7, identified in 27 cases (38%). Among these, KLF4 co-mutations were observed in 12 cases, AKT1 co-mutations in 10 cases, and PIK3CA co-mutations in 2 cases. POLR2A mutations were detected in 21 cases (30%). Notably, tumors in Groups A and B exhibited few, if any, high-risk copy number alterations (CNAs) including deletions and amplifications. Group C tumors showed frequent CNAs, with losses of chromosome 14q (10 tumors, 62.5%) and 1p (5 tumors, 31.2%) being the most common. Concurrent deletion of 1p and 22q was observed in 4 cases. No alterations in the TERT promoter or homozygous codeletion of CDKN2A/B were identified in this cohort.
Fig. 2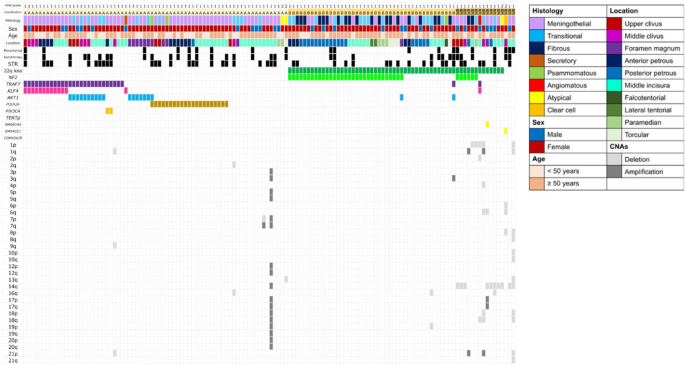
Baseline characteristics, driver mutations, and copy number alterations in posterior fossa meningiomas. Each column represents an individual meningioma patient (n = 132)
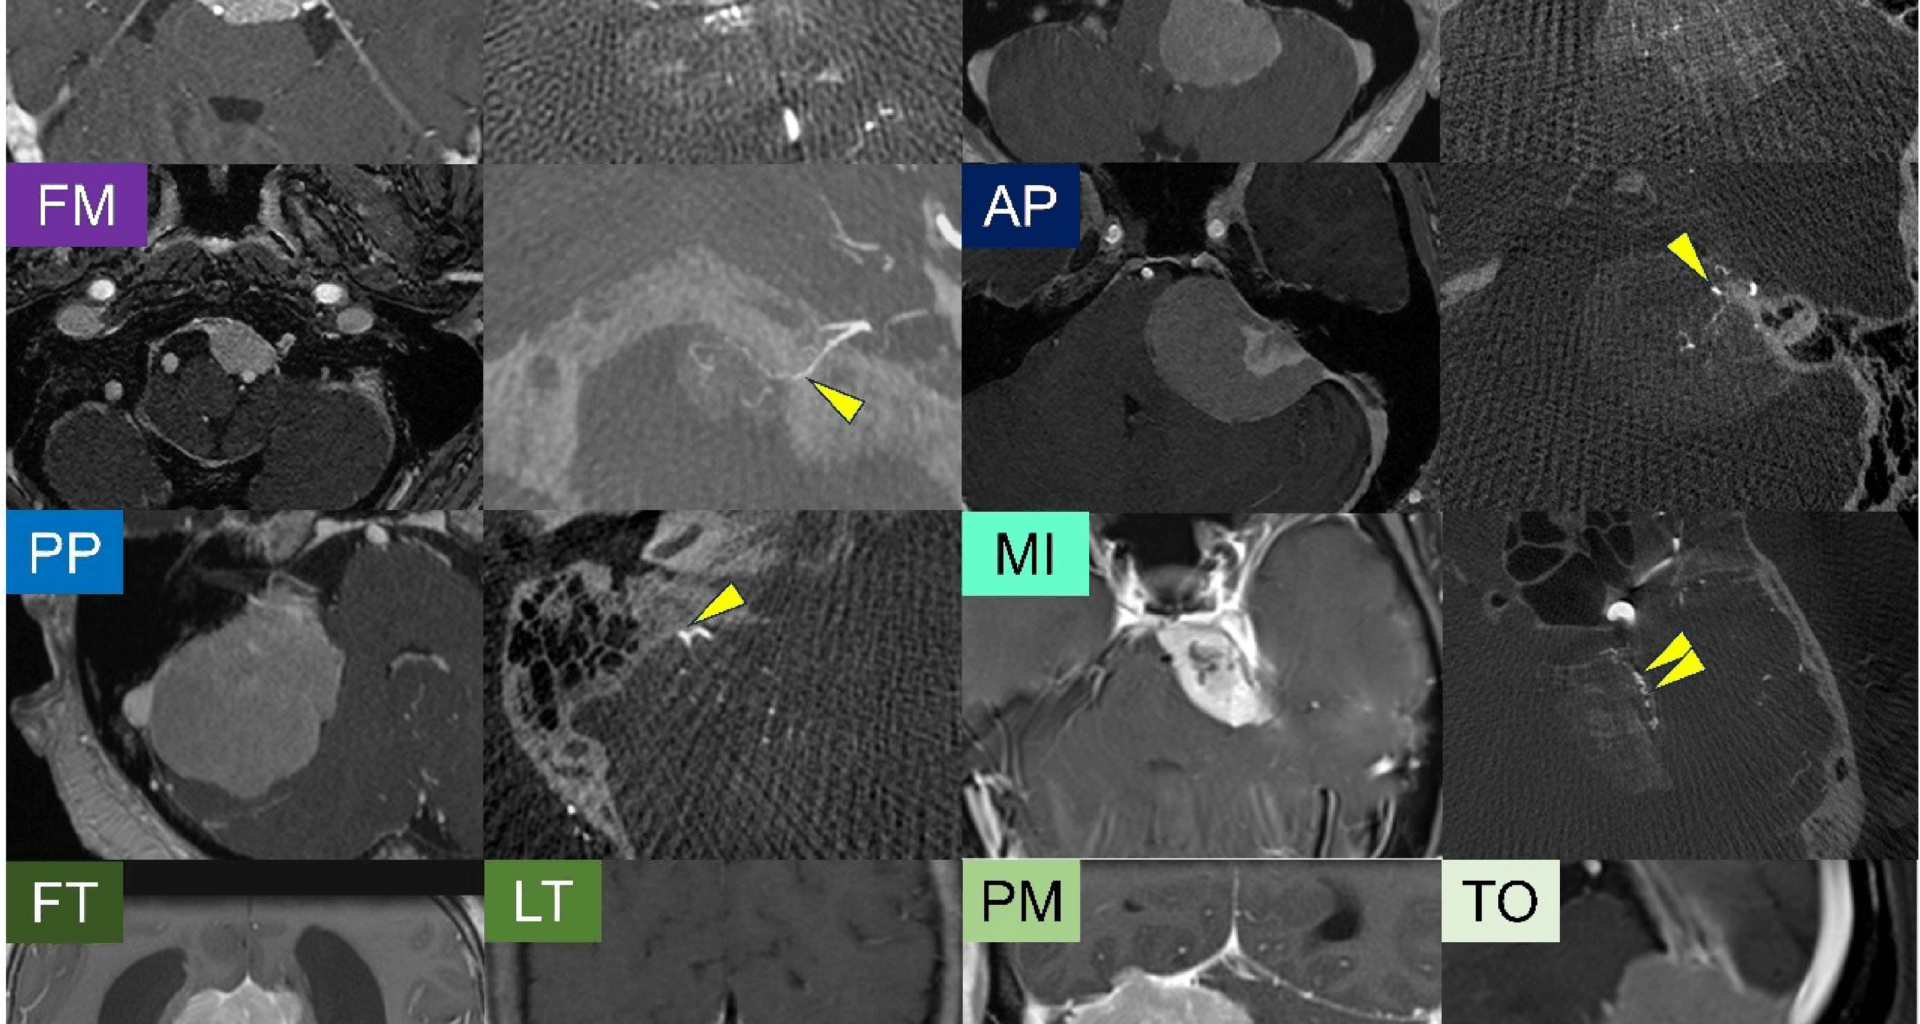
The anatomical distribution of meningiomas according to their molecular subtypes is depicted in a figure (Fig. 3), where each tumor is color-coded based on its driver mutations/CNAs and plotted along the skull base according to its anatomical origin. Group A tumors, primarily characterized by non-NF2 mutations such as TRAF7, KLF4, or POLR2A, tended to arise from regions relatively close to the midline. Group B tumors, defined by NF2 mutation/22q loss without high-risk CNAs, were predominantly located in the posterior petrous region and around the posterior or lateral tentorium. In contrast, Group C tumors, which harbor high-risk CNAs, showed a preference for midline structures, such as the clivus and medial tentorium. Further details on the molecular definitions of each anatomical group are provided in Extended Table 3.
Among the MI tumors, 65% fell into Group A, 21% into Group B, and 15% into Group C. For the UC/MC tumors, 67% were classified into Group A, 5% into Group B, and 29% into Group C (see Extended Table 4).
Fig. 3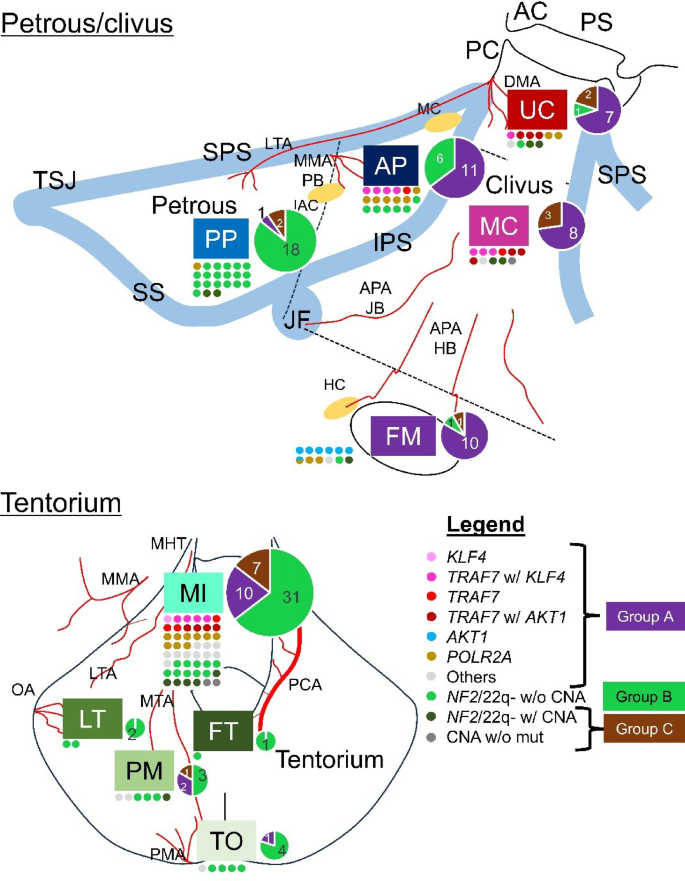
Anatomical distribution of meningioma molecular subtypes. Each molecular subtype, defined by characteristic driver mutations and copy number alterations, is color-coded. These subtypes are spatially mapped onto schematic illustrations of the skull to highlight the anatomical predilection of each subtype. Overlaid pie charts represent the relative abundance of subtypes within each location. AC: anterior clinoid, APA: ascending pharyngeal artery, DMA: dorsal meningeal artery, HB: hypoglossal branch, IAC: internal auditory canal, IPS: inferior petrosal sinus, JB: jugular branch, LTA: lateral tentorial artery, MC: Meckel’s cave, MHT: meningohypophyseal trunk, MMA: middle meningeal artery, MTA: middle tentorial artery, OA: occipital artery, PB: petrosal branch, PC: posterior clinoid, PCA: posterior cerebral artery, PMA: posterior meningeal artery, PS: planum sphenoidale, SPS: superior petrosal sinus, SS: sigmoid sinus, TSJ: transverse-sigmoid junction
To aid anatomical interpretation, a schematic diagram is provided in the figure, which summarizes the typical localization of each molecular subtype along the skull base (Fig. 4). NF2 mutation/22q loss meningiomas without additional CNAs tended to localize to the lateral and infratentorial regions, while clival and medial tentorial tumors are often associated with non-NF2 mutations or high-risk CNAs. Each colored region in the schematic represents the predominant anatomical site of origin for each subtype of posterior fossa meningioma. The left side of the figure corresponds to the tentorial surface, whereas the right side depicts the petrous and clival surfaces.
Fig. 4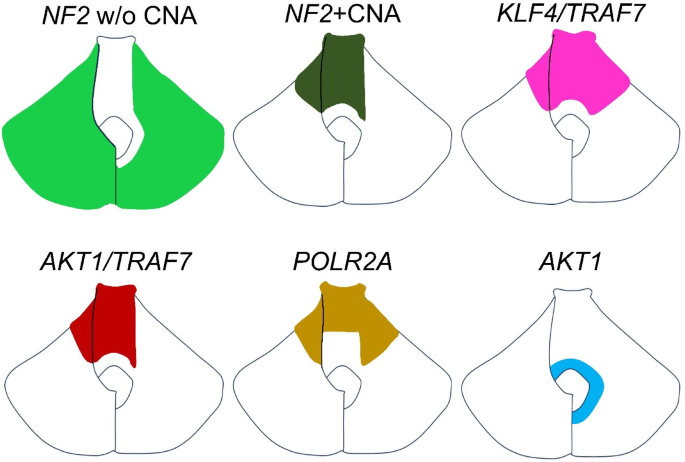
Anatomical mapping of meningioma molecular subtypes along the skull base. Each colored region represents the predominant anatomical origin for a given molecular subtype in posterior fossa meningiomas. The left side of the schematic corresponds to the tentorial surface, while the right side represents the petrous and clival surfaces
Prognostic factors for tumor recurrence
In the entire cohort, survival analysis based on both molecular group and extent of resection revealed that classification as Group C (P = 0.024; Fig. 5A) and undergoing STR (P = 0.009; Fig. 5B) were significantly associated with shorter PFS. Subsequently, we performed a progression-free survival analysis focusing on tumors in which GTR was achieved. Among 132 cases, GTR was accomplished in 86 cases as described above. Based on molecular classification, a significant difference in PFS was observed among the three groups both in the overall cohort (P = 0.037; Extended Fig. 1A) and in the subset of tumors located in the medial incisura or clivus (P = 0.001; Extended Fig. 1B). When comparing Group C tumors specifically to Groups A and B, Group C showed significantly shorter PFS (P = 0.023; Fig. 5C), with the difference remaining significant even when limited to tumors in the medial incisura or clivus (P = 0.0003; Fig. 5D). Results for tumors that underwent STR are provided in the supplementary materials (Extended Fig. 2). A similar trend toward shorter PFS was observed for Group C tumors among patients who underwent STR, although the difference did not reach statistical significance (P = 0.33). Univariate analysis for tumor recurrence after GTR in posterior fossa meningiomas identified Group C (P = 0.021, HR = 4.51, 95% CI: 1.26–16.1) and preoperative tumor volume > 10 cc (P = 0.040, HR = 9.28, 95% CI: 1.11–77.4) as significant poor prognostic factors. Both factors remained significant in the multivariable analysis (Group C: P = 0.020, HR = 6.60, 95% CI: 1.35–32.2; preoperative tumor volume > 10 cc: P = 0.044, HR = 9.41, 95% CI: 1.06–83.5) (Table 2).
Fig. 5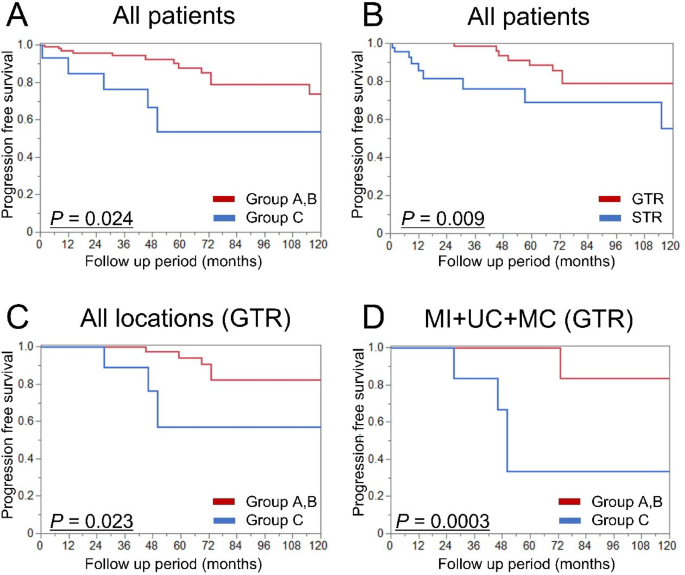
Kaplan–Meier curves for tumor recurrence in posterior fossa meningiomas. A: Progression-free survival stratified by molecular group in all patients. B: Progression-free survival stratified by extent of resection in all patients. C: Subgroup analysis of patients who underwent gross total resection, stratified by molecular group. D: Further subgroup analysis of gross total resection cases, limited to tumors arising from the medial tentorial incisura and clival regions. GTR: gross total resection, MC: middle clivus, MI: medial incisura, UC: upper clivus