General notes
All aqueous solutions were prepared with ultrapure water (18.2 MΩ cm, Veolia). Chemicals were purchased with an analytical grade containing
Fabrication of platinum foil electrodes
Polycrystalline platinum foil, measuring 50 mm × 50 mm with a thickness of 0.1 mm, was obtained from Goodfellow Cambridge with a purity grade exceeding 99.99+% and a polished surface. For electrode fabrication, the platinum sheets were cut into 10 mm × 10 mm pieces. A copper wire with a purity level exceeding 99.999% (Thermo Scientific) and a diameter of 0.127 mm was attached to the backside of one platinum piece using conductive silver epoxy adhesive (8331D, MG Chemicals). Electrodes were then cured for 2 h at 70 °C on hotplates, ensuring a stable electrical connection.
Subsequently, each platinum electrode was threaded through a Schott Duran glass tube (Gaßner Glastechnik), measuring 8 cm in length, 5 mm in diameter and 0.8 mm in thickness. The backside of the electrode was then encapsulated with a chemically resistant, two-component polyurethane resin (UR 5528, Electrolube). The epoxy was cured for 12 h at 90 °C.
Fabrication of platinum mesh electrodes
Platinum mesh (gauze) electrodes were obtained from ALS Japan (011498 SEC-C platinum gauze working electrode, 99.99% purity) with a total width of 7 mm, a height of 6 mm and a wire diameter of 0.08 mm. A copper wire was clamped to the end of the platinum wire to establish an electrical contact. The electrode was then threaded through a Schott Duran glass tube (Gaßner Glastechnik) with the same dimensions as above. To protect the connection between the platinum and copper wire, it was encapsulated with polytetrafluoroethylene (PTFE) tape. This tape also provided stability and orientation of the electrode. Hot glue sealed the end of the glass tube.
IrOx electrode fabrication
IrOx was electrodeposited onto gold electrodes following an adaptation of a previously published protocol36.
Gold electrode preparation
Gold foil (99.95%, 0.1 mm thick, Strem Chemicals) was cut into 10 mm × 10 mm pieces, sonicated for 5 min in ethanol and for 5 min in water, and then dried in a nitrogen stream (99.999% purity). Copper wire (≥99.9%, 1.0 mm diameter, Sigma-Aldrich) was glued to the back of the gold pieces with electrically conductive silver epoxy adhesive. Copper wire was threaded through a Schott Duran glass tube. Electrode back, edges and corners were covered with epoxy resin (ER2218, Electrolube). The gold electrodes were voltammetrically cycled in 0.5 M H2SO4 (aq.) (potential range, −0.21 V to +1.49 V versus Ag/AgCl, 3 M KCl (Dri-Ref 5, World Precision Instruments); counter-electrode, platinum coil (A-002234, BioLogic); scan rate, 100 mV s−1; cycles, 80), rinsed with water, dried in a nitrogen stream and stored in vacuum prior to IrOx deposition.
IrOx was deposited by chronoamperometry in an electrodeposition bath (at +0.6 V versus Ag/AgCl; counter-electrode, platinum coil (A-002234, BioLogic); duration, 1.15 h). The electrodeposition bath was prepared by dissolving 0.15 g iridium(IV) chloride monohydrate (IrCl4·H2O, ≥99.9%, Sigma-Aldrich) in 100 ml water and the solution was stirred for 30 min. Then, 1 ml hydrogen peroxide solution (H2O2:H2O, 30% (w/w), Sigma-Aldrich) was added and the solution was stirred for another 10 min. Finally, 0.5 g oxalic acid dihydrate ((COOH)2·2H2O, ≥99%, Sigma-Aldrich) was added, followed by another 10 min of stirring. The solution pH was adjusted to 10.5 by incremental addition of anhydrous potassium carbonate (K2CO3, ≥99%, Sigma-Aldrich). The solution was stirred for 3 days before IrOx deposition.
Electrochemically active surface area determination
The hydrogen underpotential deposition method was used to determine the electrochemically active surface area (ECSA) of the platinum mesh electrodes37. Electrodes were cleaned with piranha solution (H2SO4:H2O2, 3:1). Subsequent electrochemical surface cleaning was performed in 0.1 M HClO4 (aq.) solution saturated with argon (99.999% purity) using CV between +0.05 V to +1.1 V versus NHE at a scan rate of 50 mV s−1 for 50 cycles. A platinum coil served as the counter-electrode with an Ag/AgCl (3 M KCl, Dri-Ref 5, World Precision Instruments) reference electrode. Afterwards, the electrolyte was exchanged, saturated again with argon and another CV was recorded under identical conditions for ECSA evaluation. After subtracting the double-layer currents, the hydrogen underpotential deposition region (+0.03 V and +0.34 V versus NHE) was integrated in both anodic and cathodic scan directions, and averaged. The coulombic charge associated with the adsorption and desorption of submonolayers of hydrogen atoms on the mesh surface was converted to the ECSA by assuming a specific charge of polycrystalline platinum of 176 µC cm−2, resulting in a surface area of approximately 0.87 cm2.
The geometric areas of the IrOx and platinum foil electrodes were measured in triplicate from photographic images on millimetre paper using the ImageJ software (v.1.54g).
Fabrication of p-type InP-Rh photoelectrodes
Single-crystalline p-InP wafers (111 A orientation) were purchased from AXT-Tongmei with a zinc doping concentration of 5 × 10¹⁷ m−3. To fabricate an ohmic back contact, 4 nm gold, 80 nm zinc and 150 nm gold were evaporated on the backside of the wafer and tempered at 400 °C for 60 s. The 1-cm2 polished indium surface of p-InP was etched in a bromine/methanol solution (0.05% w/v) for 30 s, rinsed with ethanol and ultrapure water (18.2 MΩ cm, Veolia), and dried under a nitrogen flow. Furthermore, the p-InP surface was photoelectrochemically conditioned in 0.5 M HCl (aq.) by potentiodynamic cycling in a three-electrode set-up under illumination (100 mW cm−2) between −0.44 V and +0.31 V versus NHE at a scan rate of 50 mV s−1 while purging with argon (99.999% purity). A platinum coil (BioLogic, A-002234) was used as the counter-electrode and an Ag/AgCl (3 M KCl, Dri-Ref 5, World Precision Instruments) served as the reference electrode. Illumination was carried out through a quartz window of the borosilicate glass cell with an xenon arc lamp (300 W, Newport Spectra-Physics) using an AM 1.5 G filter. The light intensity of 100 mW cm−2 was adjusted with a calibrated silicon reference photodiode.
Shadow nanosphere lithography was used to produce hydrophilic rhodium nanostructures on the p-InP substrate. To create the required masks for the subsequent catalyst deposition process, monodisperse polystyrene beads with a diameter of 782 nm (microparticles GmbH) were used as supplied in their aqueous suspension at a concentration of 5% (w/v). For the final solution of 600 μl, 300 μl of the polystyrene bead dispersion was mixed with 300 μl of ethanol containing 1% (w/v) styrene and 0.1% sulfuric acid (v/v). The solution was applied to an air–water interface using a Pasteur pipette with a self-made curved tip. To increase the area of the single-crystalline structures, the Petri dish was carefully moved to create weak wave motions, transforming several smaller particle domains into larger ones. The solution was spread to cover ~80% of the water surface with a hexagonally closed-packed monolayer, leaving space for stress relaxation and avoiding the formation of cracks in the lattice during the subsequent preparation steps. Photoelectrochemically conditioned p-InP electrodes were placed under the floating, closed-packed polystyrene bead mask in the Petri dish. The remaining water was carefully removed by pumping and evaporation while the mask was deposited onto the electrode. After the surface had been dried with argon, rhodium was photoelectrochemically deposited through the polystyrene particles from an aqueous solution of 5 mM RhCl3, 0.5 M NaCl and 0.5 vol% 2-propanol for 5 s at a constant potential of Vdep = + 0.01 V versus NHE and a light intensity of 100 mW cm−2, using the same electrode configuration and illumination source as for the photoelectrochemical conditioning. The electrodeposition resulted in the formation of a nanostructured surface morphology that resembles a honeycomb structure caused by the inverse image of the overlying mask.
Polystyrene beads were removed from the surface by placing the electrodes for 20 min in a beaker of toluene with a magnetic stir bar. The electrodes were cleaned by rinsing with acetone and ethanol for 20 s each. To remove residual carbon traces, argon plasma cleaning (MiniFlecto, Plasma Technology) was carried out at 0.16 mbar, 65 W and a gas inflow of 1 sccm for 5 min.
Electrolyte preparation
Alongside previous HER experiments in microgravity, a 1 M HClO4 (aq.) solution was used as the electrolyte for all HER experiments with the addition of 1% (v/v) 2-propanol to reduce the surface tension and facilitate enhanced gas bubble detachment from the electrode32,33. For the OER, a 1 M HClO4 (aq.) solution was used as the electrolyte without any further additions. Freshly prepared electrolyte solutions were used for all terrestrial and microgravity experiments.
Electrochemical cleaning of platinum electrodes
Prior to each experiment, platinum electrodes underwent a thorough cleaning process to ensure optimal and reproducible electrochemical performance. The electrodes were initially rinsed with acetone, 2-propanol and ultrapure water for 10 s each and dried in an argon gas flow. Before the electrochemical measurement in the drop tower or terrestrially, the platinum surface was cleaned in the electrolyte used for the subsequent CV experiment between −0.5 V and +2 V versus Ag/AgCl (3 M KCl). Twenty cycles were run at a scan rate of 50 mV s−1 in a three-electrode set-up. A platinum coil served as the counter-electrode.
Microgravity facility
A microgravity environment was established at the Bremen Drop Tower at ZARM. The experimental set-up was installed in a drop capsule which was shot up ~120 m to the top of the tower by a hydraulically controlled pneumatic piston-cylinder catapult system before falling into a deceleration container containing millimetre-sized hard foam polystyrene beads. The total free-fall time was up to 9.3 s. During free fall, the minimum g-value was about 10−6g. Electrochemical data were stored on a Matrox 4Sight GPm integrated PC unit in the drop capsule. The drop capsule was also equipped with sensors to monitor acceleration, rotation, atmospheric pressure and temperature, and had a battery power supply. The drop sequence for all electrochemical measurements was automated and started prior to each drop, waiting for triggers at launch. The drop sequence was designed to start cameras and electrochemical measurements directly after immersing the working electrode in the electrolyte using a pneumatic system in time to reach microgravity conditions. This allowed electrochemical measurements to be carried out during free fall only. After the capsule was lifted from the deceleration container, the samples were retrieved from the experimental set-up, rinsed with ultrapure water and dried with argon.
Baseline set-upsThree-electrode cell arrangement
Electrochemical experiments were carried out in the drop tower and terrestrially in a custom-made, two-compartment electrochemical cell (filling volume, 250 ml) made of PEEK (Supplementary Fig. 1). Each cell consisted of two optical windows made of quartz glass (Suprasil 1, Aachener Quarzglas; diameter, 25 mm; thickness, 3 mm) through which the front and side of the working electrode surface could be observed through optical mirrors. Each cell could perform an electrochemical measurement independently. All experiments were carried out in a three-electrode arrangement with a platinum coil counter-electrode and an Ag/AgCl reference electrode under ambient pressure. All electrodes were separated by about 1 cm. Four cameras were installed to capture gas bubble evolution and movement inside each compartment. Two monochromatic near-infrared cameras (acA1300-60gm, Basler; Cams 3 and 4, Supplementary Fig. 1) with a resolution of 1,280 × 1,024 pixels at a capture rate of 60 frames per second were attached to each cell via optical mirrors equipped with Telecentric High-Resolution lenses (WD110 series, MML1-HR110). Two Photron MC-2 Fastcam high-speed cameras (Cams 1 and 2, Supplementary Fig. 1) equipped with 35-mm Kowa LM35HC 1-inch sensor F1.4 C-mount objectives were mounted in front of each compartment. The cameras operated at 500 frames per second with a resolution of 512 × 512 pixels. Cams 3 and 4 were installed on the sides of the cell, while the high-speed cameras (Cams 1 and 2) were positioned at the front. For the analysis of gas bubble movement, the front-facing cameras were used. Optical mirrors were used to adjust the camera heights, reducing space requirements and torque during rapid acceleration. This set-up made it possible to record a static view of the gas bubble evolution and the movement trajectories of the bubbles during the experimental sequence.
Tungsten–iodine lamps provided background illumination for the video recordings from the sides (Light, Supplementary Fig. 1). When electrochemical measurements with photoelectrodes were carried out, the tungsten–iodine lamps were used for sample illumination from the front at 89 mW cm−2, calibrated using a silicon photodiode.
For electrochemical experiments in the presence of a magnetic field, a cylindrical N52 neodymium magnet (NdFeB, 19.05 mm length, 25.4 mm diameter, K&J Magnetics) was placed ~4 mm below the working electrode (Supplementary Fig. 1). A protective sleeve was fabricated from acidic-resistant polyoxymethylene to shield the neodymium magnet from the electrolyte. To secure the sleeves and magnets at the bottom of the cell during rapid capsule acceleration (up to 40g), a cylinder of the same polyoxymethylene material was constructed to precisely fit the magnet at the bottom of each compartment.
All measurements were carried out in the absence of electrolyte stirring if not indicated otherwise and were repeated three times for statistical evaluation. Analysis focused on the time period of 8 s after the onset of microgravitation to exclude differences in the deceleration onset of the drop tower capsule. The chosen time interval falls within the minimum microgravity period by a significant margin, thus ensuring the consistency and accuracy of the measurements. Terrestrial comparison experiments were carried out in the same set-up using the same experimental conditions.
Magnetic environment
MP and MHD forces were induced by the axially magnetized, cylindrical N52 neodymium magnet. The magnetic field generated by the magnet was computed as the superposition of the individual magnetic fields induced by N = 40 equivalent circular loops located at the side wall of the cylinder, which features discontinuous tangent residual magnetization components. Each loop has a current Iloop = Mrhmagnet/N, with Mr being the residual magnetization of the magnet and hmagnet its height, resulting in an analogous magnetic system with an analytical solution. Further details on the virtual currents method can be found in ref. 38.
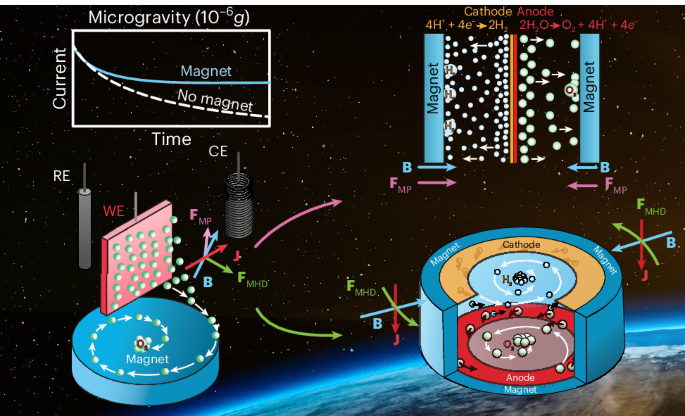
Supplementary Fig. 2 characterizes the magnetic environment of the system in the plane defined by the working electrode and the counter-electrode. The magnetic flux density distribution, shown in Supplementary Fig. 2a, reaches ~0.6 T over the surface of the magnet. The diamagnetic bubble terminal velocity is depicted in Supplementary Fig. 2d and ranges between 0.1 and 2 mm s−1 over the surface of the electrode for a 0.5-mm-radius bubble. Diamagnetic accelerations between 10 and 100 mm s−2 act on the electrolyte at the same locations, but the Lorentz acceleration can be significantly larger depending on the current density value. For instance, at a current density of 200 mA cm−2, the average acceleration from the Lorentz force is approximately 0.5 m s−2, one order of magnitude higher than the diamagnetic effect. Since the mean electric current density vector J is contained in the plane of the electrode, the Lorentz force pushes the liquid in the circumferential direction.
Mechanical stirring
To investigate the impact of improved convection with a magnet in microgravity further, a mechanical stirrer was added to the electrochemical cell without a magnet (Supplementary Fig. 5). Supplementary Fig. 6 shows that mechanical stirring decreases the current density decay in microgravity comparably, supporting the hypothesis that by improving gas bubble detachment and movement from the electrode surface, the magnetically induced convection prevents the formation of a gas bubble froth layer and the blocking of catalytically active sites on the platinum electrode. This, in turn, it enhances proton interaction with the electrode surface and improves the hydrogen evolution rate.
For the mechanical stirring experiments, a motor (RH158-12-15 d.c. motor, MicroMotors; 39.6 mm, with a 15:1 gearbox, 12 V, 100 N mm) was attached to a rod, circumventing the magnetic field generated by commercially available magnetic stirrers (Supplementary Fig. 5). The rod was 120 mm in length and 6 mm in diameter. The end of the rod was attached to a thin plate, 1 mm in thickness, 30 mm in width and 10 mm in height, acting as a paddle to stir the solution. The paddle was attached to the rod by snapping it into sawed-off slots. The entire stirring rod was attached to the axis of the motor’s gearbox using grub screws. The stirring rod was placed 1.5 cm off-centre from where the working electrode was positioned. The paddles rotated below the working electrode. The voltages in Supplementary Fig. 6 were chosen in all scenarios to result in matching current densities. An Ag/AgCl electrode (3 M KCl, Dri-Ref 5, World Precision Instruments) was used as the reference and a platinum coil as the counter-electrode (A-002234, BioLogic) for all experiments.
It should be noted that during stirring, the solution was pushed towards the outer walls of the cell, forming a vortex in the centre. To maintain the pressure at 1 atm, it was necessary to keep the gas volume as low as possible. When producing hydrogen gas through the HER, the electrochemical cell was filled with 175 ml of 1 M HClO4 (aq.) + 1% isopropanol, leaving 20 ml unfilled. The stirring rod’s volume, including the three electrodes, occupied an additional 5 ml. The total gas volume for the stirring experiments was thus 15 ml.
Because the solution was in constant rotary motion—pushing the liquid to the outer walls—the resulting gas bubbles formed an elongated shape. Due to the off-centre placement of the stirrer and the position of the other electrodes in solution, the electrolyte flow became turbulent, causing the bubbles to pulsate in microgravity (Supplementary Video 6).
The rotation speed was determined using high-speed cameras that recorded the stirrer in motion under the same conditions as the experiments. The stirrer rotated with a period of 203 ms per rotation, resulting in an angular velocity ω ≈ 31 rad s−1. With a stirrer radius of 1.5 cm, the tangential velocity of the fluid was v ≈ 46.5 cm s−1.
Statistical analysis
Error propagation was evaluated for a sample size of n = 3. The standard deviation for three individual electrochemical experiments was calculated by computing the deviation of each value from their mean, then squaring these deviations to emphasize larger differences. The average of these squared deviations was calculated and the square root was taken to obtain the standard deviation, σ.
The shaded area around the mean lines of the same colour in Fig. 1a–c represent ±1σ to indicate the range where approximately 68% of the data points are expected to be found for normally distributed data populations. The error bars in the bar charts shown in Fig. 1d–f represent the s.e.m. The s.e.m. was calculated by dividing the standard deviation by the square root of the sample size (n = 3) to indicate how the sample mean varies from the true population mean. This provides a quantitative understanding of the precision of the experimental results.
Prototype PEM deviceFabrication
A PEM model electrolyser cell with a platinum-coated PEM (Catalyst-Coated Nafion Membrane (CCM) N117, Ion Power; loading, 0.3 mg Pt cm−2; active area, 2.0 cm × 2.0 cm; overall area, 3.0 cm × 4.0 cm) was constructed according to Supplementary Fig. 9: the platinum-coated membrane was contacted with two platinum meshes (A-002250, Biologic) on both the anodic and cathodic sites. These meshes, originally 4 cm × 3 cm, were halved along the long side to create two 2 cm × 3 cm contact areas which were then pushed between two PEEK frames (2 cm × 1.9 cm) with holes for bubble removal. Additional platinum wires, 0.1 mm thick, were used to electrically contact the meshes from outside. The electrochemical cell was equipped with two cylindrical N52 neodymium permanent magnets (NdFeB, K&J Magnetics; length, 19.05 mm; diameter, 25.4 mm), each positioned at the anodic and cathodic site of the cell and aligned along the same axis with a separation distance of 22 mm. The resulting magnetic field is shown in Supplementary Fig. 11. The set-up included a PEEK electrolyser chamber with an acrylic glass cover for visual observation.
Electrochemical test
Chronopotentiometric experiments were carried out with the PEM electrolyser model at a constant current of 200 mA in ultrapure water (18.2 MΩ cm) while changes in the potential difference between the anode and cathode were measured over time U(t). To ensure valuable comparisons with terrestrial measurements, the electrolyser was operated for an additional 9.2 s after the capsule decelerated in the Bremen Drop Tower in a continuous experiment. Data were normalized by dividing the potential difference by the mean value of a selected time range during the microgravity phase. Specifically, for the microgravitation period, the normalization range was set to 5.5 s t ≤ 8.5 s which reflects the time period between U(t) saturation and the onset of experiment deceleration. The maximum voltages recorded during U(t) measurements ranged from 5.3 V to 5.7 V. The deceleration shock caused a quick rise in potential that quickly returned to former values achieved in microgravity. The normalization was used to mitigate the influence of any potential offsets or differences in absolute values, allowing for a more direct observation and analysis of the relative changes in the potential difference.
Bubble velocity measurements
Video analysis of PEM microgravity experiments was conducted in MATLAB using the Image Processing Toolbox. A pixel-to-millimetre conversion was established using a known dimension, and exclusion boundaries were set to ignore bubbles that accumulated on the magnet casing. The algorithm captures centre locations and bubble radii at each frame, which were then sequenced into discrete bubble trajectories via proximity and velocity filters (Supplementary Fig. 10). The final collection was selected from this candidate pool based on gas bubbles that transit across the gap without becoming obscured by another bubble. In total, 41 hydrogen and 33 oxygen gas bubbles are shown in Supplementary Fig. 10a,b. Velocities were computed using a first-order finite-difference scheme, and data were smoothed with a moving-average filter over 0.3 s (Supplementary Fig. 10b). The average Reynolds numbers for hydrogen and oxygen bubbles were 0.88 (σ = 0.29) and 0.80 (σ = 0.29), respectively. The average number of frames included in the velocity analysis for each bubble was 116 (σ = 34.5). After nucleation, bubbles separated from the platinum mesh and were accelerated towards the magnets, where they accumulated in a stationary froth layer and sometimes coalesced into larger bubbles. Note that some bubbles approached the computed terminal velocity for a 1-mm bubble as shown in Supplementary Fig. 10b, which aligns with equation (9) in ref. 25 because terminal velocity scales with R2 in the Stokes regime. A similar bubble-analysis algorithm is described in detail in ref. 25. The maximum horizontal velocity reached by a tracked bubble was on average 2.77 mm s−1 (σ = 0.68) for hydrogen and 2.91 mm s−1 (σ = 0.65) for oxygen (Supplementary Fig. 11). The maximum velocity of 4.36 mm s−1 across all bubbles is slightly below the terminal velocity predicted by the quasistatic bubble balances in equations (9) and (10) in ref. 26 and computed in Supplementary Fig. 12 for creeping flows26. This is a consequence of the unsteady nature of the experiment, which prevents bubbles from reaching their terminal velocities before they are collected.
Prototype MHD driveFabrication
A prototype for the MHD drive cell was constructed from three components: a main body, fabricated from PEEK that formed the central cavity for the platinum electrodes and the 1 M HClO4 (aq.) electrolyte plus a bottom and lid made from acrylic glass (Fig. 4a,b and Supplementary Fig. 12). Acrylic glass was chosen to ensure video recordings of the gas bubble flow during the experiment. The main body of the cell measured 21.1 mm in height and 80 mm in both width and depth. Around the body, a circular, thin cavity was carved out to accommodate eight N52 neodymium arc magnets supplied by K&J Magnetics. These eight segments formed a circular magnet with an internal diameter of 5.08 cm, a radial thickness of 3.175 mm and a height of 19.05 mm. To protect the magnets from corrosion during long-term electrolyte exposure, the cavity was encapsulated with the same black epoxy used for fabricating the other electrodes (UR 5528, Electrolube) and cured for 24 h.
To ensure air bubbles were not trapped inside the cell, a pump was used to evacuate the device prior to filling it with 26 ml electrolyte.
Two platinum rings were fabricated for the MHD drive system from a polycrystalline platinum foil (50 mm × 50 mm; thickness, 0.1 mm; purity grade, >99.99+%; polished surface; Goodfellow Cambridge) with an outer diameter of 47.1 mm and an inner diameter of 29.9 mm. The platinum foil rings were positioned in the cell using cylindrical fixtures to maintain equidistance between the rings (Fig. 4a,b). This positioning was crucial to ensure their proper placement in the middle of the magnetic field. Platinum wires encased in PTFE sleeves were used to establish an electrical contact with the platinum foil rings.
The magnetic field generated by the permanent magnet used in the MHD drive was computed as the superposition of the individual magnetic fields induced by N = 20 equivalent circular loops located at the top and bottom walls, which feature discontinuous tangent residual magnetization components. Each loop has a current Iloop = Mr(Rmagnet e − Rmagnet i)/N, with Rmagnet e and Rmagnet i being the outer and inner radii of the MHD drive, respectively, resulting in an analogous magnetic system with an analytical solution. The magnetic flux density field is represented in Fig. 4c. Further details on the virtual currents method can be found in ref. 36.
Angular velocity and bubble measurements
The angular velocity of the aqueous electrolyte inside the MHD drive was measured using bubbles as a visual reference. The angular velocity is approximately constant across all radii for a certain current intensity, making the electrolyte rotate as a solid cylinder except for localized regions such as the small liquid volume above the electrodes. Supplementary Fig. 14a depicts this behaviour for individual bubbles, while Fig. 5a shows an average of the observed angular velocity of 3–6 bubbles for each experiment. Steady-state angular velocities were computed by limiting bubble tracking to the last seconds of each drop or initiating the MHD drive operation slightly before the drop. For the chronopotentiometric measurements at 21, 42 and 63 mA cm−2, the angular velocity was lower, and the experiments started from a static state.
The bubble terminal velocity was obtained by manually tracking the radial position of 1- to 1.2-mm-diameter gas bubbles over time. The radial velocity of bubbles decreased with the radial position, but bubble–bubble interactions and the electrode wires shown in Fig. 4a,d induced transient flow dynamics that are not representative of the overall flow behaviour of the MHD drive. Isolated gas bubbles were selected at the 21, 42 and 63 mA cm−2 current levels shown in Supplementary Fig. 14b. For the gas bubble at a current density of 105 mA cm−2, however, the effect of transient interactions on the radial velocity was mitigated because the tracking was carried out along a wide range of angular positions. The bubble interacts with the wire for radial positions between 1.3 and 1 cm, where the radial velocity notably fluctuates.
Electrochemical tests
Chronopotentiometric experiments were carried out for 9.2 s at 1,000 mA in a two-electrode set-up, measuring the potential difference between the two platinum electrodes inside the MHD drive cell. All data were recorded by a capsule computer (National Instruments). The experimental sequence was adapted from previous electrochemical experiments with minor adjustments.
Microgravity experiments started with the trigger of the microgravity switch. Unlike the angular velocity measurement, and to capture the initial transient behaviour, the electrochemical characterization was performed by starting the rotation of the system at the beginning of the drop. After the capsule landed again in the deceleration container, a brief pause of 10 s ensured capsule stabilization before another experiment with the same CP settings was carried out terrestrially for an additional 9.2 s. This repetition under terrestrial conditions served as a reference point for further analyses (Fig. 5c).