
Sep 4, 2025
IndexBox has just published a new report: U.S. – Bridges, Bridge Sections, Towers And Lattice Masts (Of Iron Or Steel) – Market Analysis, Forecast, Size, Trends and Insights.
The market for bridges, bridge sections, towers, and lattice masts in the United States is expected to see continued growth in both volume (CAGR of +0.4%) and value (CAGR of +1.7%) from 2024 to 2035. This upward trend is driven by the need for infrastructure development and construction projects across the country.
Market Forecast
Driven by increasing demand for bridges, bridge sections, towers and lattice masts (of iron or steel) in the United States, the market is expected to continue an upward consumption trend over the next decade. Market performance is forecast to retain its current trend pattern, expanding with an anticipated CAGR of +0.4% for the period from 2024 to 2035, which is projected to bring the market volume to 1.3M tons by the end of 2035.
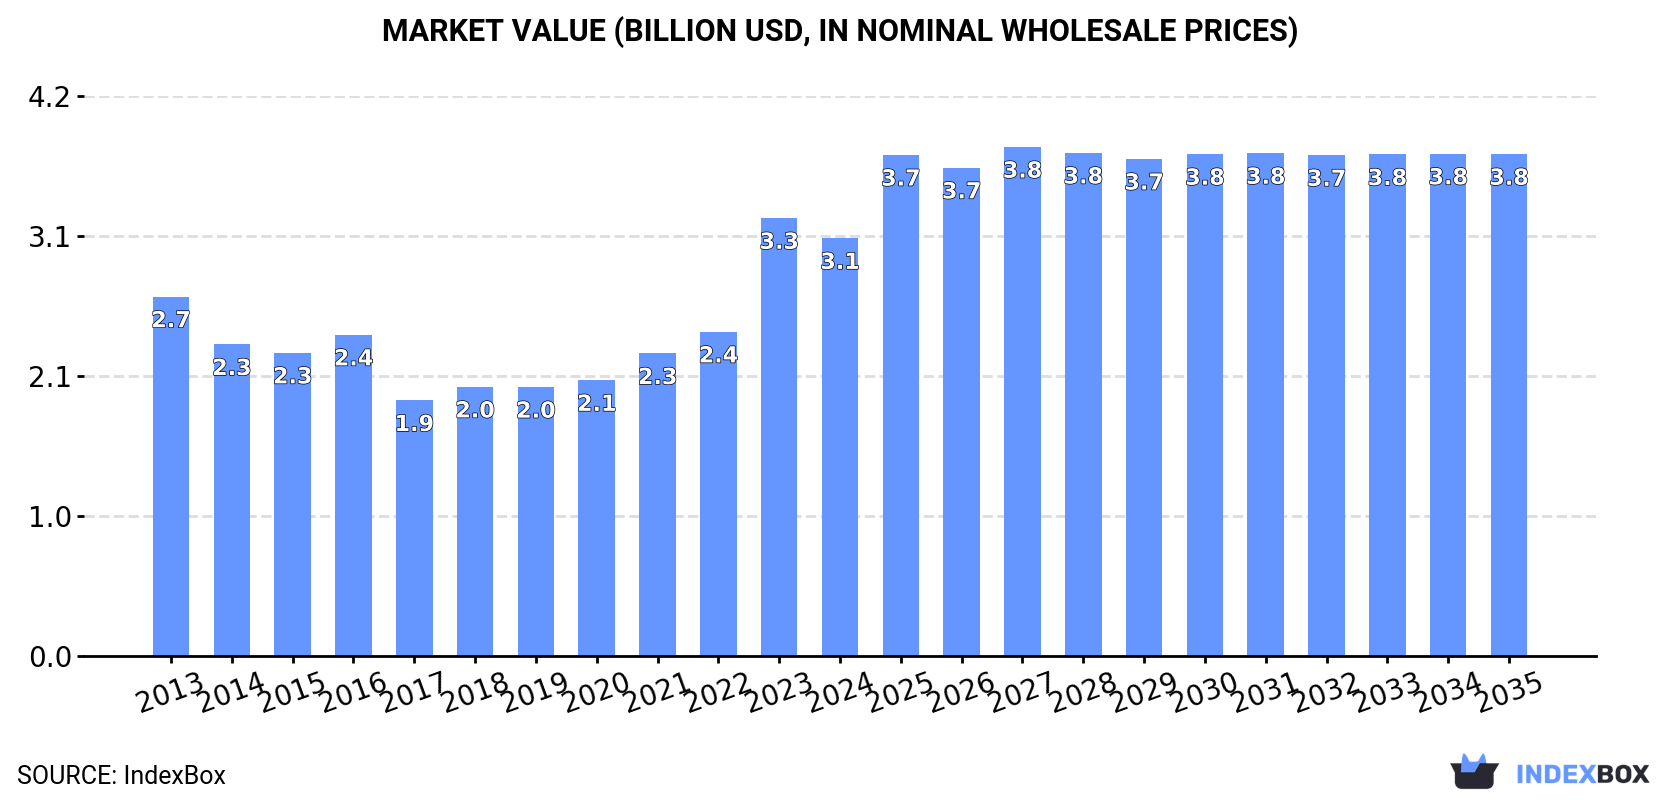
In value terms, the market is forecast to increase with an anticipated CAGR of +1.7% for the period from 2024 to 2035, which is projected to bring the market value to $3.8B (in nominal wholesale prices) by the end of 2035.
 ConsumptionUnited States’s Consumption of Bridges, Bridge Sections, Towers And Lattice Masts (Of Iron Or Steel)
For the fourth consecutive year, the United States recorded growth in consumption of bridges, bridge sections, towers and lattice masts (of iron or steel), which increased by 4.1% to 1.3M tons in 2024. In general, consumption recorded a relatively flat trend pattern. As a result, consumption attained the peak volume and is likely to continue growth in the immediate term.
The size of the bridge market in the United States dropped slightly to $3.1B in 2024, declining by -4.6% against the previous year. This figure reflects the total revenues of producers and importers (excluding logistics costs, retail marketing costs, and retailers’ margins, which will be included in the final consumer price). Overall, the total consumption indicated a slight expansion from 2013 to 2024: its value increased at an average annual rate of +1.4% over the last eleven-year period. The trend pattern, however, indicated some noticeable fluctuations being recorded throughout the analyzed period. Based on 2024 figures, consumption increased by +63.4% against 2017 indices. As a result, consumption attained the peak level of $3.3B, and then contracted slightly in the following year.
ProductionUnited States’s Production of Bridges, Bridge Sections, Towers And Lattice Masts (Of Iron Or Steel)
In 2024, production of bridges, bridge sections, towers and lattice masts (of iron or steel) decreased by -13.3% to 913K tons for the first time since 2020, thus ending a three-year rising trend. Over the period under review, production saw a pronounced shrinkage. The most prominent rate of growth was recorded in 2021 when the production volume increased by 29% against the previous year. Bridge production peaked at 1.1M tons in 2013; however, from 2014 to 2024, production failed to regain momentum.
In value terms, bridge production dropped to $3.9B in 2024. The total output value increased at an average annual rate of +1.1% over the period from 2013 to 2024; however, the trend pattern indicated some noticeable fluctuations being recorded throughout the analyzed period. The most prominent rate of growth was recorded in 2021 with an increase of 29%. Over the period under review, production hit record highs at $4.2B in 2022; however, from 2023 to 2024, production failed to regain momentum.
ImportsUnited States’s Imports of Bridges, Bridge Sections, Towers And Lattice Masts (Of Iron Or Steel)
In 2024, purchases abroad of bridges, bridge sections, towers and lattice masts (of iron or steel) increased by 99% to 366K tons, rising for the second year in a row after two years of decline. Overall, imports recorded a strong expansion. Over the period under review, imports attained the peak figure at 485K tons in 2020; however, from 2021 to 2024, imports failed to regain momentum.
In value terms, bridge imports skyrocketed to $1B in 2024. Over the period under review, imports recorded a resilient increase. As a result, imports reached the peak and are likely to continue growth in the immediate term.
Imports By Country
In 2024, Germany (180K tons) constituted the largest supplier of bridge to the United States, accounting for a 49% share of total imports. Moreover, bridge imports from Germany exceeded the figures recorded by the second-largest supplier, South Korea (41K tons), fourfold. The third position in this ranking was held by Denmark (38K tons), with a 10% share.
From 2013 to 2024, the average annual rate of growth in terms of volume from Germany amounted to +86.1%. The remaining supplying countries recorded the following average annual rates of imports growth: South Korea (+5.5% per year) and Denmark (+90.2% per year).
In value terms, Germany ($516M) constituted the largest supplier of bridges, bridge sections, towers and lattice masts (of iron or steel) to the United States, comprising 50% of total imports. The second position in the ranking was taken by Denmark ($103M), with a 10% share of total imports. It was followed by Canada, with a 7.8% share.
From 2013 to 2024, the average annual growth rate of value from Germany stood at +48.4%. The remaining supplying countries recorded the following average annual rates of imports growth: Denmark (+95.0% per year) and Canada (+6.9% per year).
Imports By Type
In 2024, iron or steel towers and lattice masts (355K tons) was the main type of bridges, bridge sections, towers and lattice masts (of iron or steel) supplied to the United States, accounting for a 97% share of total imports. It was followed by iron or steel bridges and bridge-sections (11K tons), with a 2.9% share of total imports.
From 2013 to 2024, the average annual growth rate of the volume of iron or steel towers and lattice masts imports stood at +15.3%.
In value terms, iron or steel towers and lattice masts ($971M) constituted the largest type of bridges, bridge sections, towers and lattice masts (of iron or steel) supplied to the United States, comprising 95% of total imports. The second position in the ranking was held by iron or steel bridges and bridge-sections ($53M), with a 5.2% share of total imports.
From 2013 to 2024, the average annual rate of growth in terms of the value of iron or steel towers and lattice masts imports amounted to +16.0%.
Import Prices By Type
The average bridge import price stood at $2,800 per ton in 2024, rising by 4.8% against the previous year. Overall, the import price recorded a relatively flat trend pattern. The pace of growth appeared the most rapid in 2022 an increase of 18% against the previous year. The import price peaked in 2024 and is likely to see gradual growth in years to come.
Prices varied noticeably by the product type; the product with the highest price was iron or steel bridges and bridge-sections ($4,962 per ton), while the price for iron or steel towers and lattice masts amounted to $2,735 per ton.
From 2013 to 2024, the most notable rate of growth in terms of prices was attained by iron or steel bridges (+1.2%).
Import Prices By Country
In 2024, the average bridge import price amounted to $2,800 per ton, growing by 4.8% against the previous year. Over the period under review, the import price recorded a relatively flat trend pattern. The growth pace was the most rapid in 2022 when the average import price increased by 18% against the previous year. Over the period under review, average import prices hit record highs in 2024 and is expected to retain growth in the immediate term.
There were significant differences in the average prices amongst the major supplying countries. In 2024, amid the top importers, the country with the highest price was Malaysia ($38,750 per ton), while the price for India ($1,807 per ton) was amongst the lowest.
From 2013 to 2024, the most notable rate of growth in terms of prices was attained by Malaysia (+25.4%), while the prices for the other major suppliers experienced more modest paces of growth.
ExportsUnited States’s Exports of Bridges, Bridge Sections, Towers And Lattice Masts (Of Iron Or Steel)
In 2024, shipments abroad of bridges, bridge sections, towers and lattice masts (of iron or steel) decreased by -26.5% to 22K tons for the first time since 2021, thus ending a two-year rising trend. Over the period under review, exports continue to indicate a deep downturn. The pace of growth was the most pronounced in 2022 when exports increased by 59% against the previous year. The exports peaked at 70K tons in 2013; however, from 2014 to 2024, the exports remained at a lower figure.
In value terms, bridge exports shrank notably to $94M in 2024. Overall, exports saw a abrupt shrinkage. The pace of growth was the most pronounced in 2022 when exports increased by 77%. The exports peaked at $212M in 2013; however, from 2014 to 2024, the exports remained at a lower figure.
Exports By Country
Canada (14K tons) was the main destination for bridge exports from the United States, accounting for a 61% share of total exports. Moreover, bridge exports to Canada exceeded the volume sent to the second major destination, Colombia (2K tons), sevenfold. The third position in this ranking was held by New Zealand (888 tons), with a 4% share.
From 2013 to 2024, the average annual rate of growth in terms of volume to Canada totaled -8.1%. Exports to the other major destinations recorded the following average annual rates of exports growth: Colombia (+22.4% per year) and New Zealand (+49.7% per year).
In value terms, Canada ($46M) remains the key foreign market for bridges, bridge sections, towers and lattice masts (of iron or steel) exports from the United States, comprising 49% of total exports. The second position in the ranking was held by Colombia ($13M), with a 14% share of total exports. It was followed by New Zealand, with a 6.2% share.
From 2013 to 2024, the average annual growth rate of value to Canada stood at -6.0%. Exports to the other major destinations recorded the following average annual rates of exports growth: Colombia (+30.2% per year) and New Zealand (+70.7% per year).
Exports By Type
Iron or steel bridges and bridge-sections (11K tons) and iron or steel towers and lattice masts (11K tons) were the main products of bridge exports from the United States.
From 2013 to 2024, the most notable rate of growth in terms of shipments, amongst the major product types, was attained by iron or steel bridges and bridge-sections (with a CAGR of -6.6%).
In value terms, bridges, bridge sections, towers and lattice masts (of iron or steel) with the largest exports in the United States were iron or steel bridges and bridge-sections ($56M) and iron or steel towers and lattice masts ($38M).
In terms of the main product categories, iron or steel bridges and bridge-sections, with a CAGR of -2.6%, saw the highest growth rate of the value of exports, over the period under review.
Export Prices By Type
The average bridge export price stood at $4,253 per ton in 2024, with an increase of 9.3% against the previous year. Over the last eleven years, it increased at an average annual rate of +3.2%. The pace of growth was the most pronounced in 2015 an increase of 30% against the previous year. As a result, the export price reached the peak level of $4,312 per ton. From 2016 to 2024, the average export prices remained at a lower figure.
Average prices varied somewhat for the major types of exported product. In 2024, the product with the highest price was iron or steel bridges and bridge-sections ($4,947 per ton), while the average price for exports of iron or steel towers and lattice masts amounted to $3,524 per ton.
From 2013 to 2024, the most notable rate of growth in terms of prices was recorded for the following types: iron or steel bridges (+4.2%).
Export Prices By Country
The average bridge export price stood at $4,253 per ton in 2024, surging by 9.3% against the previous year. Over the period from 2013 to 2024, it increased at an average annual rate of +3.2%. The most prominent rate of growth was recorded in 2015 when the average export price increased by 30%. As a result, the export price attained the peak level of $4,312 per ton. From 2016 to 2024, the average export prices remained at a lower figure.
Prices varied noticeably by country of destination: amid the top suppliers, the country with the highest price was Uruguay ($19,424 per ton), while the average price for exports to Bahamas ($3,233 per ton) was amongst the lowest.
From 2013 to 2024, the most notable rate of growth in terms of prices was recorded for supplies to Uruguay (+22.4%), while the prices for the other major destinations experienced more modest paces of growth.
Source: IndexBox Market Intelligence Platform