
Sep 7, 2025
IndexBox has just published a new report: EU – Plastic Baths, Wash-Basins, Lavatory Pans And Covers And Similar Sanitary Ware – Market Analysis, Forecast, Size, Trends and Insights.
The European Union’s market for plastic sanitary ware (baths, wash-basins, lavatory pans, covers) is on a sustained upward trajectory, forecast to accelerate over the next decade. Driven by increasing demand, market volume is projected to grow at a Compound Annual Growth Rate (CAGR) of +1.6% from 2024 to 2035, reaching 398 million units. In value terms (nominal wholesale prices), growth is anticipated to be stronger at a +2.9% CAGR, bringing the market to $11.4 billion by 2035. In 2024, consumption saw a significant rebound, skyrocketing to 332 million units (a 22% increase) with a market value of $8.3 billion (a 40% increase), though both figures remain below the 2022 peaks. Austria is the dominant consumer, accounting for 29% of total volume (98M units) and nearly half of the total market value ($3.9B). Germany and Italy are distant second and third consumers. Slovenia, Austria, and Portugal lead in per capita consumption. The product landscape is dominated by ‘plastics bidets, lavatory pans and flushing cisterns,’ which constitute 75% of consumption volume (250M units) and 71% of value ($5.9B). Production in the EU also surged in 2024 to 326 million units, valued at $6.1B. Austria, Germany, and Slovenia are the top producing countries, together accounting for 61% of output. The EU is a major trading hub for these goods. Imports reached 171M units ($2.6B) in 2024, led by Germany, France, and Italy. Exports reached 165M units ($3.0B), with Germany being the largest exporter by far (57M units, 34% share), followed by Bulgaria, Poland, and Italy. Spain commands the highest export prices at $31 per unit.
Key Findings
- EU demand for plastic sanitary ware is rising and expected to grow for the next decade
- Market volume is projected to reach 398 million units by 2035
- Market value is forecast to grow to $11.4 billion (nominal prices) by 2035
- Volume growth is anticipated at a CAGR of +1.6% from 2024 to 2035
- Value growth is forecast at a higher CAGR of +2.9% for the same period
Market Forecast
Driven by increasing demand for plastic baths, wash-basins, lavatory pans and covers and similar sanitary ware in the European Union, the market is expected to continue an upward consumption trend over the next decade. Market performance is forecast to accelerate, expanding with an anticipated CAGR of +1.6% for the period from 2024 to 2035, which is projected to bring the market volume to 398M units by the end of 2035.
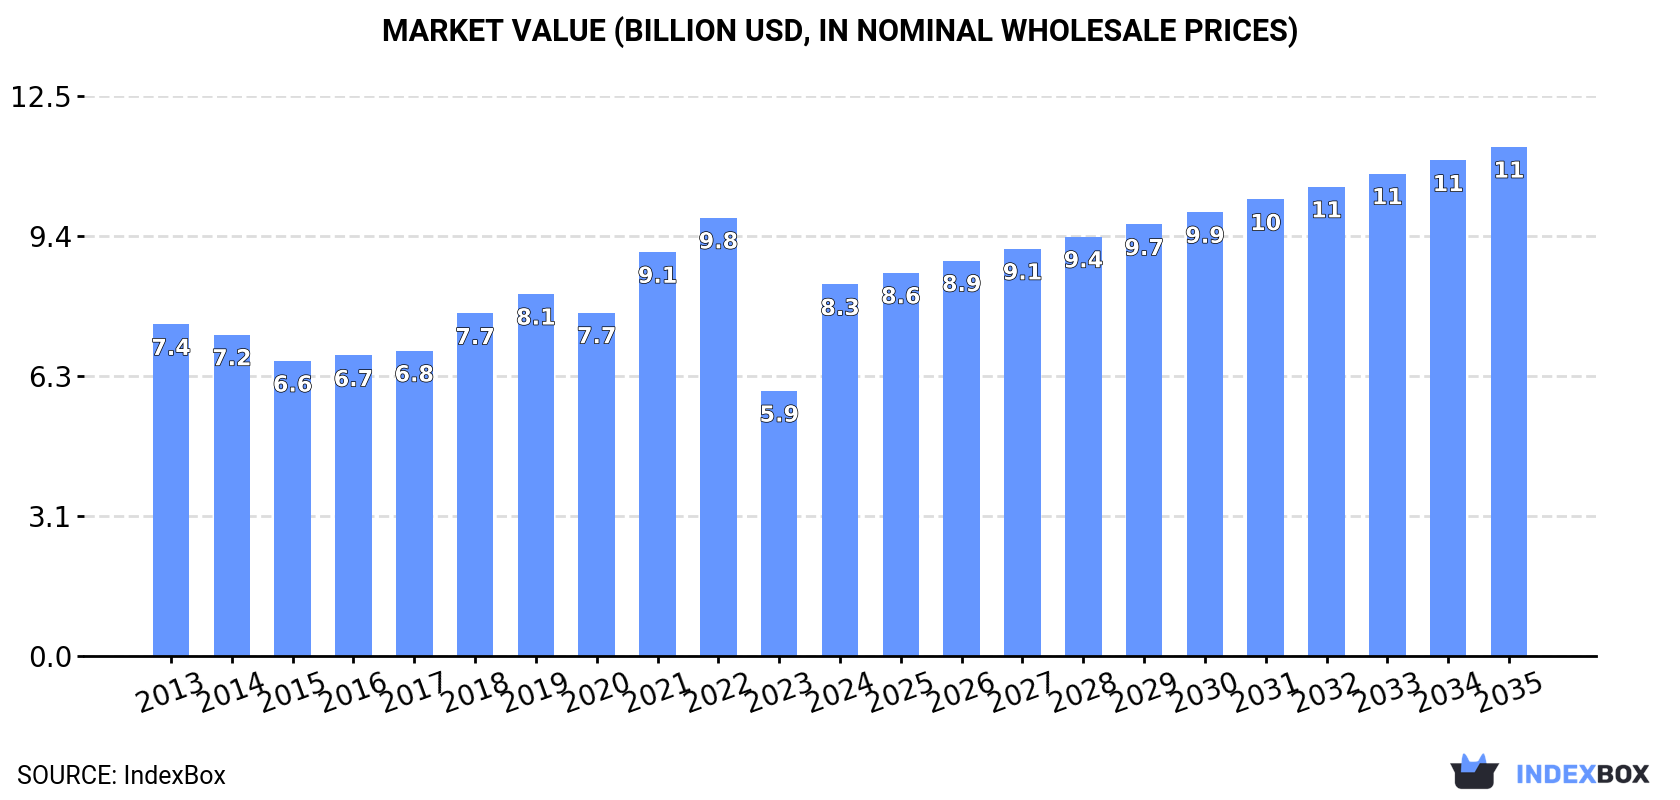
In value terms, the market is forecast to increase with an anticipated CAGR of +2.9% for the period from 2024 to 2035, which is projected to bring the market value to $11.4B (in nominal wholesale prices) by the end of 2035.
 ConsumptionEuropean Union’s Consumption of Plastic Baths, Wash-Basins, Lavatory Pans And Covers And Similar Sanitary Ware
In 2024, plastic sanitary ware consumption in the European Union skyrocketed to 332M units, increasing by 22% compared with the previous year’s figure. In general, consumption continues to indicate a relatively flat trend pattern. The volume of consumption peaked at 405M units in 2022; however, from 2023 to 2024, consumption failed to regain momentum.
The value of the plastic sanitary ware market in the European Union soared to $8.3B in 2024, rising by 40% against the previous year. This figure reflects the total revenues of producers and importers (excluding logistics costs, retail marketing costs, and retailers’ margins, which will be included in the final consumer price). The market value increased at an average annual rate of +1.0% from 2013 to 2024; however, the trend pattern indicated some noticeable fluctuations being recorded in certain years. The level of consumption peaked at $9.8B in 2022; however, from 2023 to 2024, consumption remained at a lower figure.
Consumption By Country
Austria (98M units) constituted the country with the largest volume of plastic sanitary ware consumption, accounting for 29% of total volume. Moreover, plastic sanitary ware consumption in Austria exceeded the figures recorded by the second-largest consumer, Germany (46M units), twofold. The third position in this ranking was held by Italy (34M units), with a 10% share.
From 2013 to 2024, the average annual rate of growth in terms of volume in Austria totaled -3.1%. The remaining consuming countries recorded the following average annual rates of consumption growth: Germany (-0.1% per year) and Italy (+1.1% per year).
In value terms, Austria ($3.9B) led the market, alone. The second position in the ranking was taken by Germany ($908M). It was followed by Italy.
In Austria, the plastic sanitary ware market remained relatively stable over the period from 2013-2024. In the other countries, the average annual rates were as follows: Germany (+1.0% per year) and Italy (+0.1% per year).
The countries with the highest levels of plastic sanitary ware per capita consumption in 2024 were Slovenia (14 units per person), Austria (11 units per person) and Portugal (0.9 units per person).
From 2013 to 2024, the biggest increases were recorded for Slovenia (with a CAGR of +15.0%), while consumption for the other leaders experienced more modest paces of growth.
Consumption By Type
Plastics bidets, lavatory pans and flushing cisterns (250M units) constituted the product with the largest volume of consumption, comprising approx. 75% of total volume. Moreover, plastics bidets, lavatory pans and flushing cisterns exceeded the figures recorded for the second-largest type, plastic lavatory seats and covers (66M units), fourfold.
For plastics bidets, lavatory pans and flushing cisterns, consumption remained relatively stable over the period from 2013-2024. With regard to the other consumed products, the following average annual rates of growth were recorded: plastic lavatory seats and covers (+0.9% per year) and plastic baths, shower-baths, sinks and wash-basins (+3.0% per year).
In value terms, plastics bidets, lavatory pans and flushing cisterns ($5.9B) led the market, alone. The second position in the ranking was held by plastic baths, shower-baths, sinks and wash-basins ($2.1B).
For plastics bidets, lavatory pans and flushing cisterns, market remained relatively stable over the period from 2013-2024. For the other products, the average annual rates were as follows: plastic baths, shower-baths, sinks and wash-basins (+3.3% per year) and plastic lavatory seats and covers (-1.0% per year).
ProductionEuropean Union’s Production of Plastic Baths, Wash-Basins, Lavatory Pans And Covers And Similar Sanitary Ware
In 2024, production of plastic baths, wash-basins, lavatory pans and covers and similar sanitary ware in the European Union surged to 326M units, with an increase of 22% on 2023. In general, production, however, continues to indicate a relatively flat trend pattern. The volume of production peaked at 397M units in 2022; however, from 2023 to 2024, production remained at a lower figure.
In value terms, plastic sanitary ware production skyrocketed to $6.1B in 2024 estimated in export price. Over the period under review, production recorded a relatively flat trend pattern. Over the period under review, production hit record highs at $6.6B in 2022; however, from 2023 to 2024, production stood at a somewhat lower figure.
Production By Country
The countries with the highest volumes of production in 2024 were Austria (97M units), Germany (69M units) and Slovenia (32M units), with a combined 61% share of total production.
From 2013 to 2024, the most notable rate of growth in terms of production, amongst the main producing countries, was attained by Slovenia (with a CAGR of +12.7%), while production for the other leaders experienced more modest paces of growth.
Production By Type
Plastics bidets, lavatory pans and flushing cisterns (271M units) constituted the product with the largest volume of production, accounting for 83% of total volume. Moreover, plastics bidets, lavatory pans and flushing cisterns exceeded the figures recorded for the second-largest type, plastic lavatory seats and covers (40M units), sevenfold.
For plastics bidets, lavatory pans and flushing cisterns, production remained relatively stable over the period from 2013-2024. For the other products, the average annual rates were as follows: plastic lavatory seats and covers (-2.8% per year) and plastic baths, shower-baths, sinks and wash-basins (+4.1% per year).
In value terms, plastics bidets, lavatory pans and flushing cisterns ($6.4B) led the market, alone. The second position in the ranking was held by plastic baths, shower-baths, sinks and wash-basins ($2.1B).
For plastics bidets, lavatory pans and flushing cisterns, production increased at an average annual rate of +1.1% over the period from 2013-2024. With regard to the other produced products, the following average annual rates of growth were recorded: plastic baths, shower-baths, sinks and wash-basins (+3.5% per year) and plastic lavatory seats and covers (-2.6% per year).
ImportsEuropean Union’s Imports of Plastic Baths, Wash-Basins, Lavatory Pans And Covers And Similar Sanitary Ware
After two years of decline, supplies from abroad of plastic baths, wash-basins, lavatory pans and covers and similar sanitary ware increased by 2.9% to 171M units in 2024. The total import volume increased at an average annual rate of +3.4% over the period from 2013 to 2024; however, the trend pattern indicated some noticeable fluctuations being recorded in certain years. The most prominent rate of growth was recorded in 2021 with an increase of 17%. As a result, imports attained the peak of 203M units. From 2022 to 2024, the growth of imports failed to regain momentum.
In value terms, plastic sanitary ware imports expanded to $2.6B in 2024. Total imports indicated a perceptible increase from 2013 to 2024: its value increased at an average annual rate of +4.1% over the last eleven years. The trend pattern, however, indicated some noticeable fluctuations being recorded throughout the analyzed period. Based on 2024 figures, imports decreased by -10.0% against 2021 indices. The pace of growth was the most pronounced in 2021 when imports increased by 29% against the previous year. As a result, imports reached the peak of $2.9B. From 2022 to 2024, the growth of imports remained at a somewhat lower figure.
Imports By Country
In 2024, Germany (34M units), distantly followed by France (21M units), Italy (19M units), the Netherlands (13M units), Belgium (11M units), Poland (11M units) and Spain (8.5M units) represented the major importers of plastic baths, wash-basins, lavatory pans and covers and similar sanitary ware, together achieving 69% of total imports. The following importers – the Czech Republic (6.4M units), Romania (6.2M units) and Austria (5.3M units) – together made up 10% of total imports.
From 2013 to 2024, the most notable rate of growth in terms of purchases, amongst the main importing countries, was attained by Italy (with a CAGR of +8.9%), while imports for the other leaders experienced more modest paces of growth.
In value terms, Germany ($440M), France ($402M) and Italy ($269M) constituted the countries with the highest levels of imports in 2024, with a combined 42% share of total imports. The Netherlands, Belgium, Poland, Spain, Austria, the Czech Republic and Romania lagged somewhat behind, together accounting for a further 38%.
Among the main importing countries, Romania, with a CAGR of +7.8%, saw the highest rates of growth with regard to the value of imports, over the period under review, while purchases for the other leaders experienced more modest paces of growth.
Imports By Type
Plastic lavatory seats and covers (87M units) and plastics bidets, lavatory pans and flushing cisterns (75M units) dominates imports structure, together making up 95% of total imports. It was distantly followed by plastic baths, shower-baths, sinks and wash-basins (9.4M units), comprising a 5.5% share of total imports.
From 2013 to 2024, the most notable rate of growth in terms of purchases, amongst the key imported products, was attained by plastic baths, shower-baths, sinks and wash-basins (with a CAGR of +5.0%), while imports for the other products experienced more modest paces of growth.
In value terms, plastic baths, shower-baths, sinks and wash-basins ($1.2B), plastics bidets, lavatory pans and flushing cisterns ($1B) and plastic lavatory seats and covers ($451M) appeared to be the products with the highest levels of imports in 2024, with a combined 99.9% share of total imports.
In terms of the main imported products, plastic baths, shower-baths, sinks and wash-basins, with a CAGR of +5.7%, saw the highest rates of growth with regard to the value of imports, over the period under review, while purchases for the other products experienced more modest paces of growth.
Import Prices By Type
In 2024, the import price in the European Union amounted to $15 per unit, remaining relatively unchanged against the previous year. Over the period under review, the import price showed a relatively flat trend pattern. The most prominent rate of growth was recorded in 2021 an increase of 11% against the previous year. The level of import peaked in 2024 and is likely to continue growth in the near future.
There were significant differences in the average prices amongst the major imported products. In 2024, the product with the highest price was plastic baths, shower-baths, sinks and wash-basins ($123 per unit), while the price for plastic lavatory seats and covers ($5.2 per unit) was amongst the lowest.
From 2013 to 2024, the most notable rate of growth in terms of prices was attained by plastic bath or sink (+0.7%), while the other products experienced mixed trends in the import price figures.
Import Prices By Country
The import price in the European Union stood at $15 per unit in 2024, standing approx. at the previous year. Overall, the import price continues to indicate a relatively flat trend pattern. The growth pace was the most rapid in 2021 when the import price increased by 11%. Over the period under review, import prices reached the maximum in 2024 and is likely to see steady growth in the immediate term.
There were significant differences in the average prices amongst the major importing countries. In 2024, amid the top importers, the country with the highest price was Austria ($22 per unit), while Romania ($12 per unit) was amongst the lowest.
From 2013 to 2024, the most notable rate of growth in terms of prices was attained by Poland (+2.9%), while the other leaders experienced more modest paces of growth.
ExportsEuropean Union’s Exports of Plastic Baths, Wash-Basins, Lavatory Pans And Covers And Similar Sanitary Ware
In 2024, overseas shipments of plastic baths, wash-basins, lavatory pans and covers and similar sanitary ware were finally on the rise to reach 165M units after two years of decline. The total export volume increased at an average annual rate of +2.9% over the period from 2013 to 2024; however, the trend pattern indicated some noticeable fluctuations being recorded in certain years. The most prominent rate of growth was recorded in 2021 with an increase of 14%. As a result, the exports reached the peak of 191M units. From 2022 to 2024, the growth of the exports remained at a lower figure.
In value terms, plastic sanitary ware exports expanded slightly to $3B in 2024. Total exports indicated notable growth from 2013 to 2024: its value increased at an average annual rate of +4.6% over the last eleven years. The trend pattern, however, indicated some noticeable fluctuations being recorded throughout the analyzed period. Based on 2024 figures, exports increased by +4.0% against 2021 indices. The pace of growth was the most pronounced in 2021 with an increase of 26%. The level of export peaked in 2024 and is expected to retain growth in years to come.
Exports By Country
Germany was the main exporter of plastic baths, wash-basins, lavatory pans and covers and similar sanitary ware in the European Union, with the volume of exports recording 57M units, which was near 34% of total exports in 2024. Bulgaria (19M units) held the second position in the ranking, followed by Poland (15M units), Italy (10M units) and Spain (9.2M units). All these countries together took approx. 32% share of total exports. The Netherlands (7.1M units), the Czech Republic (7M units), Portugal (6.9M units), Slovenia (5.7M units) and France (5M units) followed a long way behind the leaders.
From 2013 to 2024, average annual rates of growth with regard to plastic sanitary ware exports from Germany stood at +3.1%. At the same time, the Czech Republic (+8.7%), Poland (+8.1%), Spain (+4.6%), Slovenia (+4.4%), Portugal (+3.8%), the Netherlands (+2.7%) and Bulgaria (+2.1%) displayed positive paces of growth. Moreover, the Czech Republic emerged as the fastest-growing exporter exported in the European Union, with a CAGR of +8.7% from 2013-2024. Italy experienced a relatively flat trend pattern. By contrast, France (-1.9%) illustrated a downward trend over the same period. Poland (+3.9 p.p.) and the Czech Republic (+1.9 p.p.) significantly strengthened its position in terms of the total exports, while Italy and France saw its share reduced by -2% and -2% from 2013 to 2024, respectively. The shares of the other countries remained relatively stable throughout the analyzed period.
In value terms, Germany ($972M) remains the largest plastic sanitary ware supplier in the European Union, comprising 32% of total exports. The second position in the ranking was held by Spain ($288M), with a 9.5% share of total exports. It was followed by Poland, with a 9.1% share.
In Germany, plastic sanitary ware exports increased at an average annual rate of +3.1% over the period from 2013-2024. The remaining exporting countries recorded the following average annual rates of exports growth: Spain (+11.1% per year) and Poland (+9.0% per year).
Exports By Type
Plastics bidets, lavatory pans and flushing cisterns was the largest exported product with an export of about 96M units, which finished at 58% of total exports. It was distantly followed by plastic lavatory seats and covers (62M units) and plastic baths, shower-baths, sinks and wash-basins (8M units), together comprising a 42% share of total exports.
From 2013 to 2024, the biggest increases were recorded for plastic baths, shower-baths, sinks and wash-basins (with a CAGR of +8.2%), while shipments for the other products experienced more modest paces of growth.
In value terms, plastics bidets, lavatory pans and flushing cisterns ($1.5B), plastic baths, shower-baths, sinks and wash-basins ($1.1B) and plastic lavatory seats and covers ($439M) constituted the products with the highest levels of exports in 2024.
Plastic baths, shower-baths, sinks and wash-basins, with a CAGR of +6.3%, recorded the highest growth rate of the value of exports, among the main exported products over the period under review, while shipments for the other products experienced more modest paces of growth.
Export Prices By Type
In 2024, the export price in the European Union amounted to $18 per unit, increasing by 2.2% against the previous year. Over the period from 2013 to 2024, it increased at an average annual rate of +1.7%. The most prominent rate of growth was recorded in 2023 when the export price increased by 18%. The level of export peaked in 2024 and is expected to retain growth in the immediate term.
Prices varied noticeably by the product type; the product with the highest price was plastic baths, shower-baths, sinks and wash-basins ($141 per unit), while the average price for exports of plastic lavatory seats and covers ($7.1 per unit) was amongst the lowest.
From 2013 to 2024, the most notable rate of growth in terms of prices was attained by plastic lavatory seat (+0.7%), while the other products experienced mixed trends in the export price figures.
Export Prices By Country
In 2024, the export price in the European Union amounted to $18 per unit, surging by 2.2% against the previous year. Over the period from 2013 to 2024, it increased at an average annual rate of +1.7%. The most prominent rate of growth was recorded in 2023 when the export price increased by 18% against the previous year. Over the period under review, the export prices reached the maximum in 2024 and is likely to see gradual growth in years to come.
There were significant differences in the average prices amongst the major exporting countries. In 2024, amid the top suppliers, the country with the highest price was Spain ($31 per unit), while Bulgaria ($6 per unit) was amongst the lowest.
From 2013 to 2024, the most notable rate of growth in terms of prices was attained by Spain (+6.2%), while the other leaders experienced more modest paces of growth.
Source: IndexBox Market Intelligence Platform