K-proportion and gene homeostasis Z-Index identify regulatory genes
As cells of the same type and in the same microenvironment are likely to receive similar stimuli, leading to similar molecular profiles, we can leverage the statistical properties of cell clusters in single-cell genomics data to differentiate between homeostatic and regulatory genes. The expression of homeostatic genes—even those with high variability across cells—should follow a negative binomial distribution. Conversely, regulatory genes should have a pattern of expression that deviates from the negative binomial distribution (i.e., low variability across most cells, with expression in a few cells having an outsized effect on the mean expression).
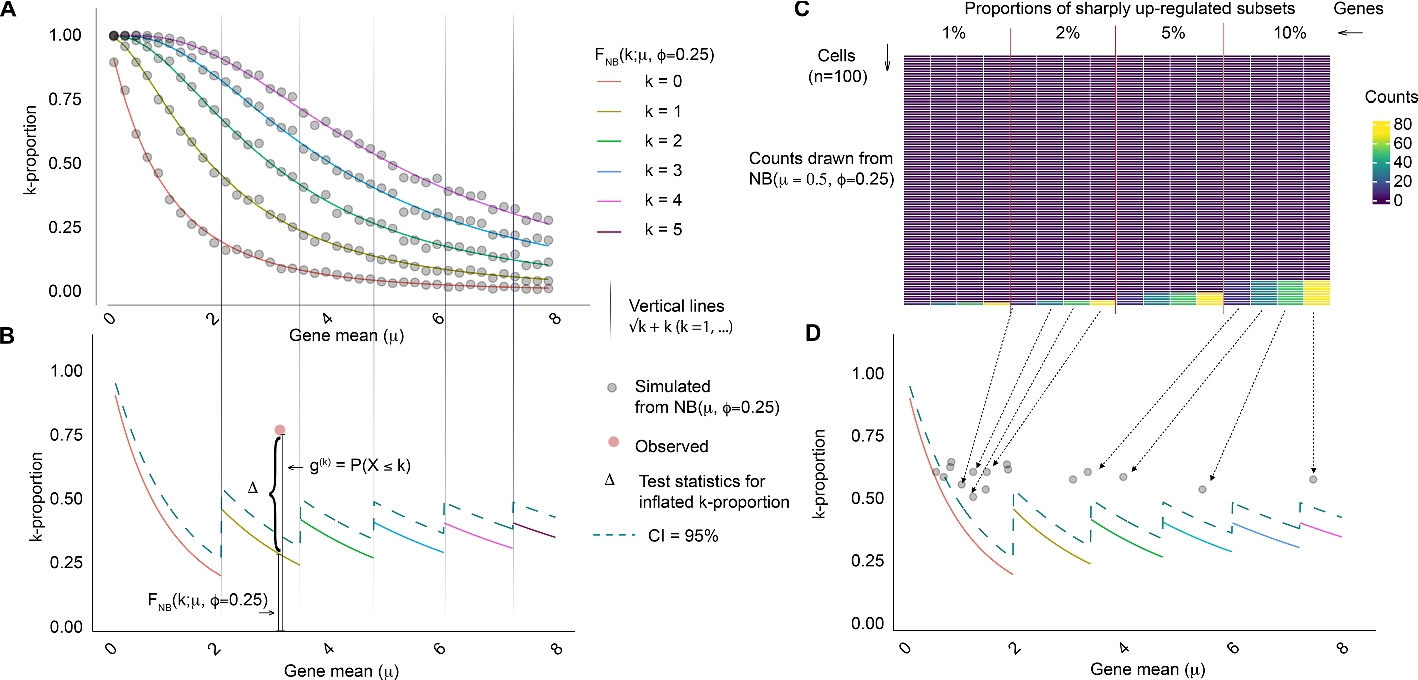
To better distinguish between homeostatic and regulatory genes, we introduce a gene-specific statistic, “k-proportion,” which represents the percentage of cells with expression levels below an integer value (k) determined by the mean gene expression count (Fig. 1, see Methods for details). Under equivalent mean expressions, regulatory genes display significantly higher k-proportions compared to their homeostatic counterparts. Because the extreme expression levels exhibited by a regulatory gene in a limited subset of cells skew the mean expression upward, the k-proportion—the number of cells with considerably lower expression than the mean—will be higher than if the variation in expression were due to noise.
Fig. 1
Illustration of k-proportion inflation test and the wave plot. k-proportion is defined as the proportion of counts no greater than k. In A, we show k-proportions as a function of gene mean expected from a negative binomial distribution (curves) and from simulated data (dots), for k = 0, …, 4. For each gene, only one k is tested. The choice of k depends on the gene mean (vertical lines). In the test statistic \({\widehat{\Delta }}_{i} ={\widehat{g}}_{i}^{(k)}-{ F}_{NB}\left(k;{\overline{X} }_{i},\widehat{\phi }\right)\), \({\widehat{g}}_{i}^{(k)}={\sum }_{j=1}^{N}{1}_{{X}_{ij}\le k}/N\) is essentially a nonparametric estimate of the true proportion, robust to the underlying distribution; \({F}_{NB}\left({\overline{X} }_{i},\widehat{\phi }\right)\) is a parametric estimate of the proportion under the assumption of a negative binomial model. The test statistic compares the difference between a nonparametric and a parametric estimate (B, CI = confidence intervals). If the difference is significant, it suggests that negative binomial is not a good fit. Since we test for observed k-proportion being strictly larger, the rejected hypothesis indicates existence of highly expressed outliers, i.e., the gene expression in upregulated in a subset of cells. In a toy example (C, D), we show how regulatory genes expressed in subsets of cells appear in a wave plot, where k-proportion is displayed as a function of gene mean. Regulatory genes surface as anomalies, appearing as distinct outliers above the general trend
The relationship between k-proportion and the mean expression can be illustrated on a “wave plot.” In this visualization, regulatory genes surface as anomalies, appearing as distinct outliers above the general trend, akin to water droplets cast airborne from a wave (Fig. 1). By quantifying the extent of deviation from the homeostatic gene population, we offer a new avenue for characterizing gene regulation directly from single-cell data. We propose a k-proportion inflation test that compares the observed k-proportion with the expected value from a set of negative binomial distributions with a shared dispersion parameter, which is estimated empirically assuming a majority of genes are homeostatic. Due to the asymptotic normality of the proposed test under the null hypothesis, we can obtain a Z-score for each gene, which we term the gene homeostasis Z-index, to serve as a relative measure of gene expression instability; a higher gene homeostasis Z-index indicates more active regulation or compensatory activity (i.e., low stability).
Simulations show Z-index matches or outperforms variability-based methods
Extensive efforts have been made to evaluate variability metrics comprehensively. For example, Zheng et al. [8] critically examined 14 metrics for their ability to capture cell-to-cell variability, identifying scran as particularly effective for this purpose. Building on these findings, we conducted benchmarking analyses using scran alongside alternative metrics such as Seurat VST and Seurat MVP. We excluded CV from the comparison due to its numerical instability in the simulations.
We first simulated data under the null hypothesis, examining various scenarios with different means and dispersion levels. For each scenario, we generated 10 datasets from a negative binomial model, each with 1000 independent genes from 200 cells. We subsequently derived a Z-index for each gene using the k-proportion inflation test.
In analyzing the distribution of method parameters, we found that the distribution of these Z-index values closely approximates a normal distribution with a mean of 0 and a standard deviation of 1, suggesting that the Z-index distribution adheres to a normal distribution asymptotically. Consequently, we find that the type I errors for the k-proportion inflation tests are well-calibrated (Additional file 1: Figure S1). In contrast, the distribution of other variance or dispersion parameters is not obvious. One can only propose arbitrary cut-offs to identify significant discoveries, making type I error challenging to control.
We next assessed the sensitivity and specificity of the k-proportion inflation test under varying conditions. Using a fixed cell number (n = 200), we generated baseline expression data for 5000 genes following a negative binomial distribution with dispersion parameters of 0.5 and a mean expression of 0.25, both empirical estimates based on real data. We introduced 200 inflated genes with outliers with varying magnitude and percentage. We ran nine scenarios varying the expression values for the inflated genes (2, 4, or 8) and the percentage of cells exhibiting upregulation (2%, 5%, or 10%) (Fig. 2). We show the k-proportion statistic captures information beyond the second moment (variance) and is highly correlated with skewness and kurtosis (Additional file 1: Figure S2). Since SCRAN, Seurat MVP, and Seurat VST are not necessarily testing procedures, we used receiver operating characteristic (ROC) curves to assess the overall performance of each method. Specifically, we converted the estimates from values to quantiles and then compared them with true labels of inflated vs. non-inflated genes to obtain sensitivity and specificity measures. A better performing method has an ROC curve closer to the top-left corner, indicating higher sensitivity for a given specificity.
Fig. 2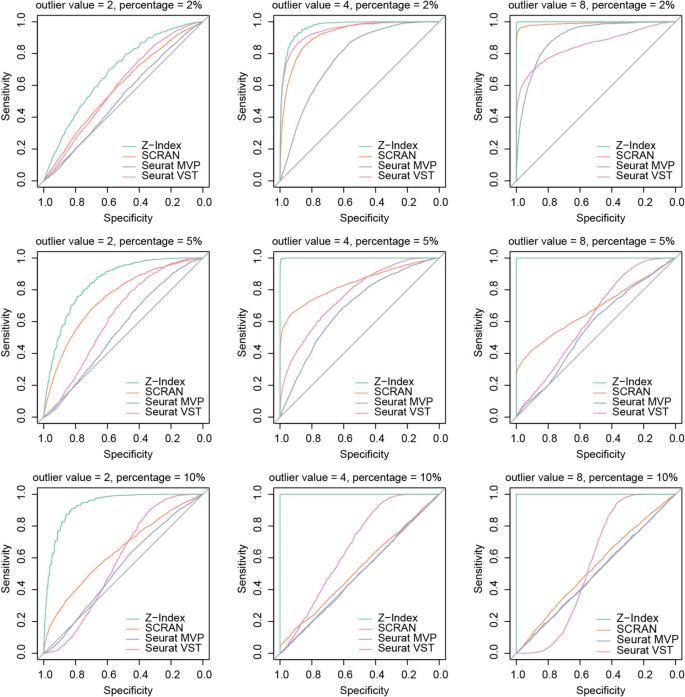
Simulation studies comparing Z-index with state-of-the-art variability metrics. Receiver Operating Characteristic (ROC) curves comparing the performance of stability (Z-index) and variance indices (scran, Seurat MVP, and Seurat VST) under varying conditions of outlier values (2, 4, 8) and percentages (2%, 5%, 10%). Each subplot shows the sensitivity versus specificity for each method, highlighting the impact of outlier magnitude and frequency on stability assessment accuracy
We found that when the outlier expression is low, the Z-index typically performs on par with Seurat MVP and SCRAN but surpasses Seurat VST in certain sensitivity ranges. As the expression of outlier increases (i.e., regulation becomes sharper), the performance of the Z-index remains stable, while other methods degrade or shift. The Z-index curve remains consistently higher across all thresholds, reflecting a general advantage. At lower percentages of cells with upregulated genes, the performance differences between Z-index and others are subtle. As the percentage of cells with upregulated genes increases, the differences between the methods are starker—Z-index curves closer to the top-left corner than others—suggesting Z-index has better resilience against increasing biases.
Overall, these results demonstrate that the Z-index exhibits competitive or superior performance across a range of conditions, particularly in scenarios with higher noise levels or larger proportions of cells with upregulated genes. Its robustness and consistency across varying thresholds underscore its utility as a reliable tool for detecting regulatory shifts.
Gene expression stability captures information beyond variability
We next examined the distribution of k-proportions in a dataset of CD34 + cells (Fig. 3) [12]. Through k-means clustering on principal component space, we identified three distinct subgroups within the CD34 + cell population. Based on the subgroup-specific markers, the three subgroups may correspond to megakaryocyte progenitors, antigen-presenting cell progenitors, and early T cell progenitors (Additional file 1: Figure S3-4). We generated wave plots for each subgroup separately and all subgroups combined. As hypothesized, we observed that the empirical distribution of k-proportions in homeostatic genes (most genes) closely aligns with those from negative binomial distributions with the same dispersion level. In relatively homogeneous cell populations, the resulting distribution approximates a Poisson distribution, as evidenced by the dispersion level of 0.163 in subgroup 3. However, as heterogeneity increases, so does the dispersion level. Subgroup 2 has the highest dispersion level (0.526) of the three subgroups, indicating increased variability in gene expression. When considering all subgroups together, the dispersion level is 1.4.
Fig. 3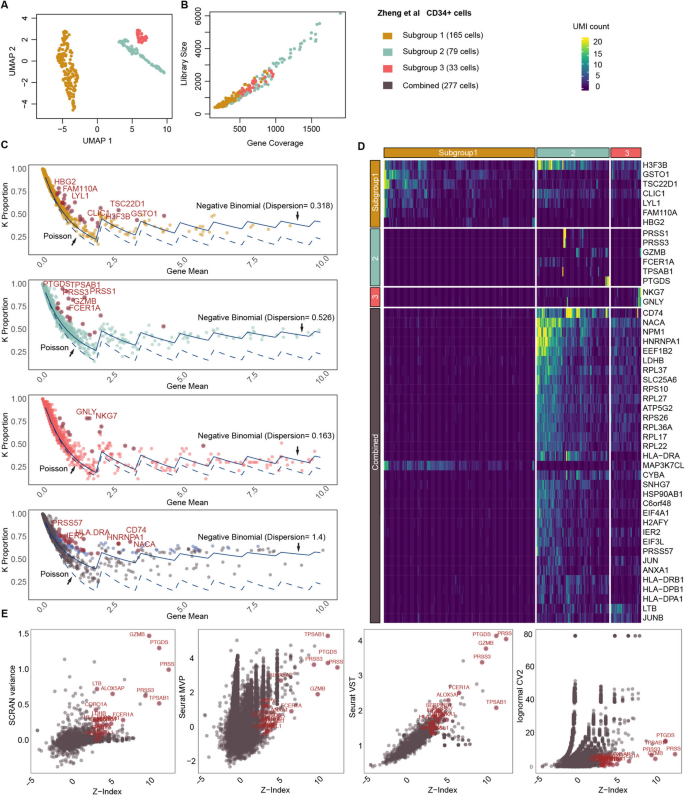
Gene expression stability analysis on Zheng et al. CD34 + cells. A UMAP show three subgroups in the CD34 + cells. B Library size vs gene coverage for each individual cell. C Wave plots of observed k-proportion vs gene mean for subgroups 1, 2, 3, and all subgroups combined. Genes with top significant Z-index are labeled by their names. The k-proportion vs gene mean from a Poisson distribution and from the fitted negative binomial are shown. D Heatmap visualization of selected regulatory genes for cells from different subgroups. EComparison of Z-index with variability metrics across CD34 + subgroup 2 cells: SCRAN variance, Seurat MVP, Seurat VST, and CV (lognormal CV2.)
In all the scenarios, we consistently observed “droplets,” which signify genes undergoing active regulation (Fig. 3C). Figure 3D displays selected genes for each cell population that have a significant Z-index after adjusting for multiple comparisons using false discovery rate. In subgroup 1, H3F3B, GSTO1, TSC22D1, CLIC1, LYL1, and FAM110A are under regulation in a subset of cells, indicating cellular oxidant detoxification activities. In subgroup 2, PRSS1 and PRSS3 are upregulated in a small portion of cells, revealing digestive activities. In subgroup 3, genes associated with cell-killing activities, NKG7 and GNLY, are upregulated. Such patterns are not observed in normalized data (Additional file 1: Figure S5).
When considering genes significantly upregulated in the combined analysis, we observed active regulation of HLA and RPL families occurring exclusively in subgroup 2, indicating cytoplasmic translation and processing of exogenous peptide antigen activities. Additionally, MAP3K7CL is upregulated in subgroup 1, suggesting this cell population might transmit signals downstream in response to extracellular stimuli through the MAPK signaling pathway. Overall, we show Z-index can be applied to both homogeneous and heterogenous cell groups to identify sharply upregulated genes.
We further compared Z-index estimates with four different variability metrics (scran, Seurat MVP, Seurat VST, and CV/lognormal CV2) across CD34 + subgroup 2 cells (Fig. 3E). There is a positive relationship between Z-index and variability for most genes. As Z-index increases and stability decreases, variability tends to increase; however, the strength and shape of this correlation differ across methods. SCRAN variance shows a wide range of variability values across Z-index values. Seurat MVP exhibits a compressed range of variability compared to SCRAN, with a moderate correlation between variability and Z-index. Seurat MVP is conservative in its variability estimates, emphasizing stability more than dynamic fluctuations. Seurat VST increases linearly as Z-index increases, with a more systematic gradient compared to SCRAN. Outliers with high variability are still prominent, but moderate variability patterns are less scattered. CV displays the weakest correlation between variability and Z-index. Variability values are heavily suppressed, particularly for genes with higher Z-index. Overall, cases with extreme Z-index values are consistently identified by SCRAN variance and Seurat VST, making them reliable for detecting outliers. However, these methods face power issues for capturing variability in the rest of the gene set, particularly for moderately variable genes or those not classified as highly unstable. The presence of genes with high variability but not high stability underscores the need for complementary methods to fully capture the complexity of gene expression dynamics. This approach is critical for identifying both outliers and genes involved in subtle, but biologically significant, processes.
As SCRAN variance, Seurat MVP, and Seurat VST all perform different types of transformation and normalization, we further investigated the differences between stability and variability quantified from UMI counts directly, using 1011 β cells from an islet donor. After correcting for multiple comparisons, we identified 372 genes out of 18,513 coding genes that have a significant homeostasis Z-index and with a k-proportion inflated over 10%. In genes like SYT16, RBP4, PCDH7, and IAPP, “droplets” show leading inflated k-proportions on a wave plot and exhibit moderate variance and CV2 (Fig. 4). Interestingly, genes with lower stability can have higher variance under the same mean expression level, while genes with high variability can remain relatively stable across the entire cell population. Among the genes with top variance but relative stability are LRRTM4, G6PC2, NRG3, CNTN4, and CNTN5 (Additional file 1: Figure S6). We also investigated the relationship between Z-index, variance, and CV. Interestingly, we find no monotonic relationship across all genes, indicating that these metrics depict different properties. However, for genes with a fixed mean expression, those with a high Z-index exhibit greater variance. Upon a detailed examination of the expression patterns and distributions of the top inflated genes across cells (Fig. 4C, D), we observed significant variations in both the proportions and expression levels of upregulated genes. This observation underscores the flexibility of the Z-index, as it can capture a broad spectrum of expression patterns originating from localized upregulation, without any prerequisite assumption of the underlying distribution.
Fig. 4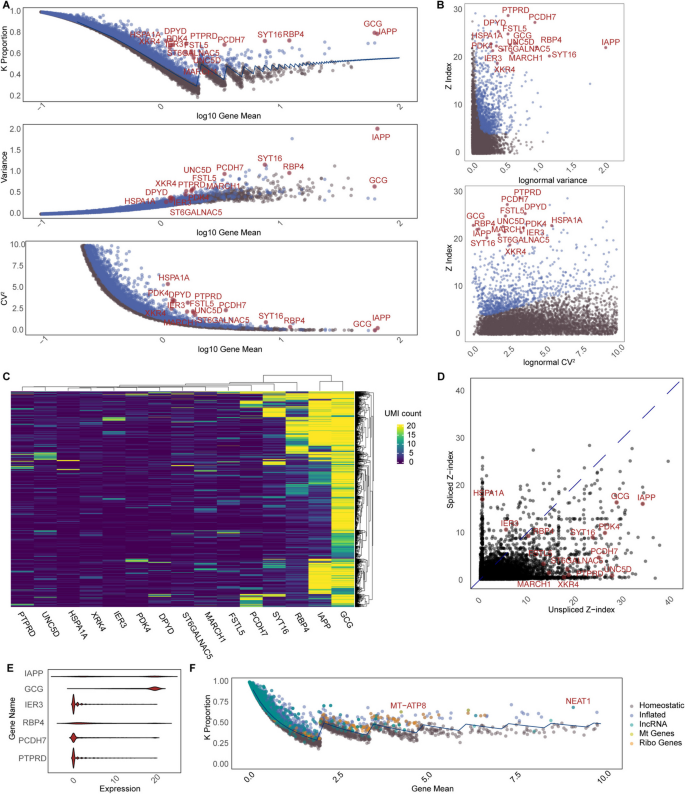
Gene expression stability analysis on pancreatic β cells from one islet donor. Top 15 genes from the inflation test are denoted in red in all plots. A K-proportion, variance, and CV2 as a function of gene mean (log 10 scale). B Scatterplots of Z-index vs. variance and Z-index vs. CV2. C Heatmap of UMI counts for top 15 inflated genes across all cells. D Z-index values derived from separate tests on spliced UMI count and unspliced UMI counts. E Violin plot shows the heterogeneity of count distribution across the top 6 inflated genes. F Wave plot shows k-proportions derived from long non-coding RNAs (lincRNA), mitochondrial genes’ RNAs, and ribosomal genes’ RNAs, which all can be fitted with the same negative binomial distribution as the coding genes
Velocity analysis has gained popularity for studying gene expression dynamics by distinguishing between nascent (i.e., unspliced) and mature (i.e., spliced) RNA molecules [13]. This inspired us to assess the Z-index for spliced and unspliced counts (Fig. 4D). Intriguingly, the k-proportions for these counts each adhere to a distinct group of negative binomial distributions, both maintaining the same dispersion level (Additional file 1: Figure S7). Furthermore, we find that upregulation of gene expression can be achieved through different avenues: some genes amplify their spliced counts, others their unspliced counts, and yet others both. For instance, among the top 15 genes, HSPA1A and IER3 only show inflated spliced counts in specific cell subsets. Conversely, UNC5C, UNC5D, and MARCH1 primarily demonstrate an increase in unspliced counts. Genes like GCG, IAPP, SYT16, RBP4, and PDK4 exhibit elevations across the board. These findings emphasize the nuanced nature of gene expression upregulation, suggesting influences beyond mere transcriptional boosts, possibly involving independent mechanisms like accelerated splicing or reduced degradation.
It is noteworthy that k-proportions derived from long non-coding RNAs (lincRNA), mitochondrial genes’ RNAs, and ribosomal genes’ RNAs all can be fitted with the same set of negative binomial distributions as the coding genes in the nucleus (Fig. 4F). The shared distribution may hint at underlying biological or biochemical processes that govern RNA production or stability across diverse RNA types.
Gene homeostasis Z-index helps identify regulatory gene modules
K-proportion is a non-parametric statistic that is highly sensitive to outliers. As shown in Fig. 4, both IAPP and GCG are identified as outliers relative to the baseline negative binomial distribution. However, their gene expression patterns differ. Specifically, IAPP and GCG both exhibit high expression levels in a limited subset of cells, but these subsets are distinct. This suggests that the Z-index is effective in identifying anomalies, but further multi-gene analyses are needed downstream to better understand the underlying patterns.
In this dataset, we examined whether the upregulation of genes occurred within the same group of cells by analyzing their correlations (Fig. 5). The results reveal distinct gene modules with strong associations, each linked to specific biological functions. One module comprising neuregulins, ROBO, and ROR1 is involved in beta-cell communication, structural organization, and survival. This module supports islet integrity and adaptive responses to cellular stress. Another module, encompassing genes such as INS, IAPP, HSP90, HLAs, and granins, integrates core beta-cell functions, including insulin secretion, amyloid management, stress protection, and immune interactions, reflecting the central role of beta cells in glucose metabolism and immune recognition. A separate cluster, dominated by JUN and several heat-shock proteins (HSPs), functions as a stress-response module. This module plays a critical role in protecting beta cells from damage by regulating inflammation, mitigating oxidative stress, and promoting protein stability under metabolic overload. Additionally, REGs and IL32 collectively form another highly correlated gene module that balances regeneration and inflammation. REGs contribute to beta-cell repair, while IL32 highlights its dual role in amplifying immune responses and potentially causing cell damage. These findings indicate that individual beta-cell subsets may adopt specialized roles influenced by their unique microenvironments. Collectively, these gene modules define critical aspects of islet beta-cell biology, ranging from structural integrity and metabolic regulation to stress adaptation and immune modulation.
Fig. 5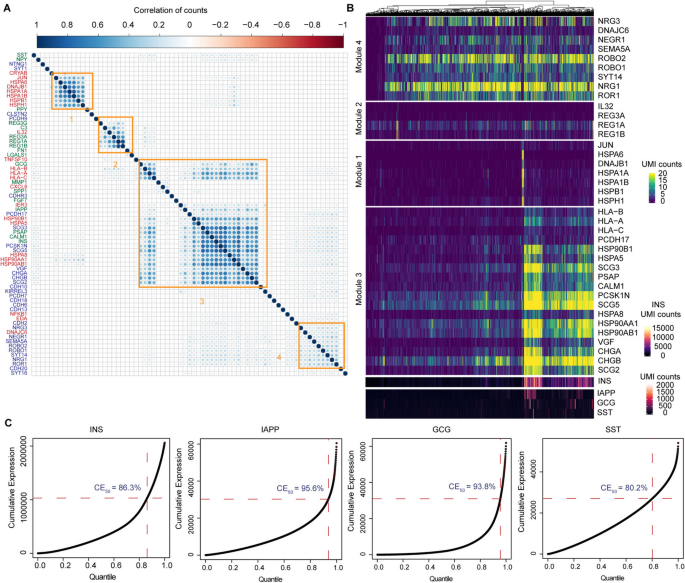
Characterization of selected regulatory genes in β cells from one donor. A Correlation of UMI counts of selected genes across all cells. Genes are grouped into modules by their correlations (orange squares). B Heatmap visualization of gene modules identified from A. C Example genes that exhibit extreme values. This deviation from a homogeneous distribution underscores a potential flaw in the current analytical methodologies that heavily rely on mean values
Notably, INS expression is upregulated, albeit within a specific subset of cells, in tandem with the upregulation of HSP90s and granins. Instead of following a negative binomial distribution, the INS expression pattern exhibits numerous extreme values. To illustrate, 50% of the total INS expression is from 13.7% of cells, while another 25% of expression is attributable to a mere 5% of cells (Fig. 5C). This skewed contribution to the mean expression underscores a potential flaw in the current analytical methodologies that heavily rely on mean values. Our observation suggests there may be a baseline expression of INS across beta cells—indicating a latent potential for insulin production. The rapid synthesis in response to external stimuli, such as glucose levels or nervous system signals, seems to be a specialized function of cell subsets. The regulatory patterns observed for other important endocrine factors, IAPP, SST, and GCG, mirror this principle, where localized extreme values significantly contribute to their overall high expression in β cells.
Gene homeostasis Z-index as a portable self-normalizing metric for differential stability analysis
Variability metrics such as SCRAN Variance, Seurat MVP, Seurat VST, and CV do not have well-characterized asymptotic distributions. This limitation arises because these metrics often depend on data-specific transformations and empirical estimates that vary across samples and datasets. Without a known asymptotic distribution, statistical testing for significance is challenging because it requires assumptions about the underlying variability distribution, which may not hold. The lack of rigorous probabilistic foundations forces the use of arbitrary cut-offs (e.g., top 5% most variable genes) to classify genes as high- or low-variability. As a consequence, the reliance on hard cut-offs can lead to poor control of Type I errors, i.e., falsely identifying genes as highly variable due to noise or extreme cases. This compromises the reproducibility and statistical rigor of variability analyses, particularly in scenarios with high noise or heterogeneous data. In contrast, the stability Z-index leverages a standardized normal distribution, enabling robust hypothesis testing and controlled Type I error rates. In this section, we showcase how to utilize the Z-index to perform differential stability analysis across multiple-sample single-cell studies.
Here we provide a specific example focusing on β cells from a dataset derived from pancreatic islets of 29 individuals, including type 2 diabetic (T2D) and non-diabetic (ND) cases, where data integration and cell-type identification have already been completed. For β cells in each individual sample, we applied the proposed k-proportion inflation test to compute the Z-index for each gene. We calculated the Z-index using the expression data of all genes from β cells of that individual as the baseline, effectively normalizing gene expression relative to the individual’s overall gene expression profile. This normalization accounts for biological or technical factors influencing overall expression levels or variability within a sample. Genes with Z-scores significantly deviating from the baseline are hypothesized to be under active regulation. The Z-index thus serves as a quantitative measure of active regulation for each gene within a specific cell type of an individual sample. Because Z-index values asymptotically follow a standard normal distribution, differential stability analysis between T2D and ND samples can be performed using a t-test.
We performed differential stability analysis within 35,551 cells, by comparing T2D (n = 10) with ND (n = 19) cases. Notably, genes in the T2D-affected β cells showed a tendency for decreased stability, as indicated by smaller Z-index values compared to ND cases. Many of these genes are linked to neuronal activities, including PDE4B, NCAM2, SEMA3A, DPP10, CHODL, UNC5C, PTH2R, and EPB41L4A, constituting a list of 116 genes with Z-index differences greater than 5. To identify key master regulators of these 116 genes, we employed ChEA3 [14], a transcript factor enrichment analysis tool that integrates multiple omics data. The top 10 transcription factors identified were NPAS3, ZNF385B, DBX2, ZNF385D, MEIS2, RORB, PURG, ZNF804A, TBX18, and PRRX1. Notably, NPAS3, DBX2, and MEIS2 are known to regulate genes involved in neural development [15,16,17]. Importantly, chromosomal abnormalities affecting the coding potential of these genes have been associated with conditions such as schizophrenia, cognitive disability, and obesity. Notably, few of these TFs are documented in the JASPER database. They can be overlooked if using a motif-based approach, even with paired ATAC-seq data.
Across 13,103 genes, the results after applying a 5% FDR threshold revealed 1,302 significant differentially stable (DS) genes, 207 significant DE genes, and 34 genes that were significant in both analyses (Fig. 6A). The larger number of significant DS genes highlights the sensitivity of DS analysis in detecting subtle differences in gene regulation across subsets of cells. By contrast, DE analysis primarily captures differences in average gene expression levels. The distinction between these methods underscores their complementary roles, as they probe fundamentally different aspects of gene behavior.
Fig. 6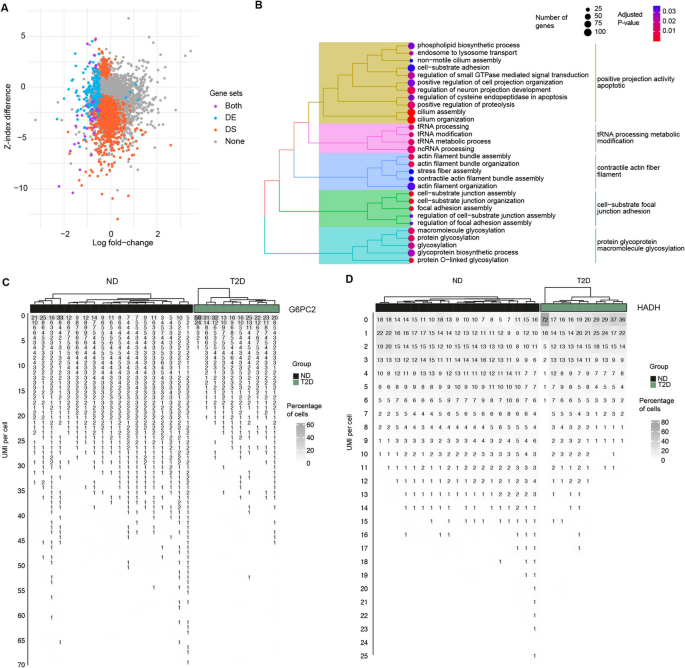
Gene expression stability analysis on pancreatic beta cells from T2D and ND donors. A Scatterplot comparing differential expression analysis using gene mean vs. differential stability analysis using Z-index (log fold-change vs. differences in Z-index). Differential stability hits are shown in red, differential expression hits are shown in green, and double hits are shown in purple. B GO Enrichment plots for top biological process categories for DS and DE genes. C Waterfall plots for G6PC2 and PDE4B. The x-axis represents individual donors, while the y-axis reflects the expression of the gene measured in UMIs. The plot uses color intensity to denote the percentage of cells within each donor expressing the gene at a given UMI count
To broaden the scope of functional insights, we reduced the significance threshold to a p-value of 5%, thereby increasing the number of genes included in the enrichment analysis (3763 vs 2610 genes). This revealed marked differences in the biological pathways associated with DS and DE genes (Fig. 6B). Genes identified by DE analysis are primarily enriched in neuronal functions, including axon development, cell growth, and synapse organization. On the other hand, DS genes are enriched in pathways related to glucose metabolism, such as glycoprotein biosynthetic processes, glycosylation, and the regulation of small GTPase-mediated signal transduction. These findings emphasize that DS and DE analyses capture distinct aspects of gene function and regulation, providing complementary insights into β-cell biology.
Among the DS genes, those upregulated in ND include GRAMD2B, HADH, CNTN4, MLXIPL, HS6ST3, CASR, STX1A, RASGRF1, and others. These genes show higher Z-index values and greater stability in ND, suggesting impaired regulation in T2D under pathological conditions. These genes are expressed in fewer cells and at lower levels in T2D samples compared to ND samples, consistent with disrupted functionality. Many of these genes have notable associations with glucose metabolism. For example, MLXIPL, also known as ChREBP (Carbohydrate-Responsive Element-Binding Protein), is a transcription factor that regulates the expression of genes involved in glycolysis and lipogenesis in response to glucose levels. HADH, an enzyme essential for the β-oxidation pathway of fatty acid metabolism, plays a critical role in glucose metabolism. Similarly, STX1A encodes a protein involved in the fusion of insulin-containing granules with the plasma membrane in pancreatic β-cells, a key step in insulin secretion. The impaired regulation of these genes in T2D suggests they may play critical roles in maintaining normal glucose homeostasis, which is disrupted under disease conditions.
In contrast, DS genes upregulated in T2D include PDE4B, SAMD5, AGMO, MSR1, ZPLD1, ALOX12B, SEMA3A, and NCAM2. These genes exhibit lower stability in T2D, indicating perturbed regulation within subsets of cells under pathological stress. The lower stability of these genes reflects increased regulatory heterogeneity, which could be a compensatory mechanism or a consequence of cellular stress in T2D.
Overall, the findings from DS and DE analyses illustrate their complementary nature. While DE analysis identifies genes with significant changes in average expression, DS analysis uncovers genes with regulatory disruptions, even when average expression levels remain relatively stable.
To enhance the analysis of gene expression stability, we introduce a waterfall plot that effectively visualizes differences in stability across individual samples. As shown in the example of Fig. 6C, this plot highlights the expression levels of G6PC2 across individual donors, categorized into ND and T2D groups. The cascading structure of the waterfall plot provides an intuitive representation of gene stability across donors and conditions. T2D samples are depicted by shorter cascades, indicating fewer cells reach high expression. In contrast, ND samples are characterized by longer tails and outlier values, which reflect sharp regulatory shifts and greater variability in the percentage of cells expressing G6PC2 at specific UMI levels. Biologically, G6PC2 is a critical gene that modulates the sensitivity of β-cells to glucose by influencing their response to fasting glucose concentrations. Its expression affects the threshold for insulin secretion, making it a key player in glucose homeostasis. G6PC2 is ranked at the 6th DS gene that shows lower stability in T2D vs. ND. However, it was not detected in DE after FDR control. Similarly, we observed PDE4B with increased regulation in T2D vs. ND, ranked at 1 st in DS genes. However, we did not detect it in DE. PDE4B is an enzyme that degrades cyclic adenosine monophosphate (cAMP), a second messenger that mediates various cellular responses, including the regulation of glucose metabolism in pancreatic β-cells. Excessive PDE4B activity could reduce cAMP levels too much, impairing insulin secretion and contributing to glucose intolerance or insulin resistance—key features of metabolic disorders such as T2D.
When a gene is markedly upregulated, it can often be detected by both DE and DS analyses. However, genes significant in DS may not always be identified through DE due to differences in statistical power. For instance, in this dataset, HADH is significant in DS but does not pass the FDR threshold in DE analysis (Fig. 6D). HADH plays a critical role as a key enzyme in the mitochondrial β-oxidation pathway, breaking down fatty acids into acetyl-CoA. This pathway is particularly vital during fasting or periods of low glucose availability, where HADH activity facilitates energy production by enhancing fatty acid oxidation. By reducing the body’s reliance on glucose, HADH helps maintain stable blood glucose levels. Dysfunction or deficiency in HADH can impair fatty acid oxidation, forcing a greater dependence on glucose as the primary energy source, which may contribute to hypoglycemia.