Entropic force in a diatomic molecule
To illustrate the concept of entropic force, we begin with a simple example: how entropy influences the bond length of a diatomic molecule (Fig. 1a). Consider a bond governed by a harmonic potential: \(E/{k}_{B}T={k}_{{\rm{spr}}}{\left(r-{l}_{b}\right)}^{2}/2\), where \({k}_{{\rm{spr}}}\) is the spring constant. The bond length \(r={l}_{b}\) corresponds to the minimum energy. However, the most probable bond length \({r}^{ * }\) deviates from \({l}_{b}\) due to entropic effects. The bond length follows the Boltzmann distribution: \(P\left(r\right)\sim \exp \left(-E/{k}_{B}T\right)\times 4\pi {r}^{2}\), where \(4\pi {r}^{2}\) considers the entropic contribution of the configuration space. It means that with the first atom at the origin, the possible positions of the second atom lie within a spherical shell of volume \(4\pi {r}^{2}{\rm{d}}r\), when the bond length is within \([r,r+{\rm{d}}r]\). Maximizing \({\mathrm{ln}} \, P(r)\) by solving \(\partial \, {\mathrm{ln}} \, P/\partial \, r=0\) yields the most probable bond length \({r}^{ * }={l}_{b}/2+\sqrt{{l}_{b}^{2}/4+2/{k}_{{\rm{spr}}}}\). This result implies an entropic bond stretch: \(\Delta l=\sqrt{{l}_{b}^{2}/4+2/{k}_{{\rm{spr}}}}-{l}_{b}/2\). For the case where \({l}_{b}^{2}/4\gg 2/{k}_{{\rm{spr}}}\), the equation simplifies to \(\Delta l\approx 2/({l}_{b}{k}_{{\rm{spr}}})\). The resulting restoring force, arising from the entropic displacement, is:
$${f}_{{\rm{entropy}}}={k}_{{\rm{spr}}}\Delta l\,{k}_{B}T\approx 2{k}_{{\rm{B}}}T/{l}_{b}.$$
(1)
Fig. 1: Entropic pulling effects in many systems.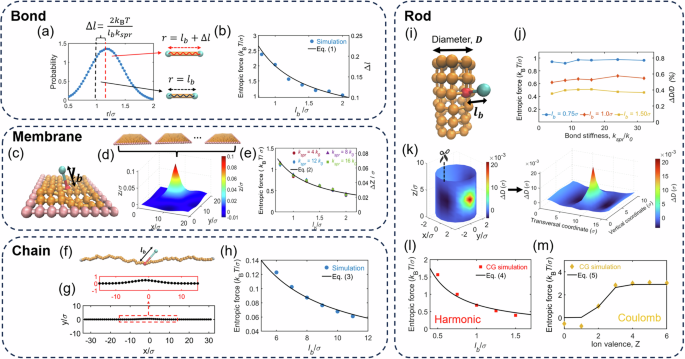
a Bond-length distribution for a harmonic bond. The peak location, \({l}_{b}+\Delta l\), is larger than the spring equilibrium length, \({l}_{b}\). b Entropic force and \(\Delta l\). c Simulation snapshot of a membrane with a bound particle. d The average z-position of different beads on the membrane. The peak is located at the anchor. e Entropic force and deformation at the anchor. f Snapshot of a chain with particle binding in a 2D simulation. g Average chain conformation shows a hump at the anchor for \({l}_{b}=8\sigma\). h Entropic pulling force at the anchor. i Simulation snapshot of a rod with particle binding. j Entropic force and deformation at the anchor. k Deformations of different beads on the rod. For better viewing, the deformations on a rod are transformed to the deformations on a flat surface. The peak is located at the anchor. l, m Entropic force at the anchor when a harmonic or Coulomb potential is applied for the binding at the anchor.
This force pulls the atoms together and originates purely from entropic effects—hence the term entropic force.
Entropic pulling effect on a membrane
Next, we examine the entropic pulling force generated by a particle bound to a membrane (Fig. 1c). The bound particle tends to move away from the membrane to maximize its configurational entropy, producing an effective entropic force that lifts the membrane. To validate this effect, we performed Langevin dynamics simulations using the LAMMPS package11, modeling the membrane as a 9 × 9 square mesh of beads with the 32 peripheral beads fixed at \(z=0\). The membrane’s elasticity, characterized by a modulus \({k}_{{\rm{mem}}}=50{k}_{B}T/{\sigma }^{2}\) (where \(\sigma\) is the bead diameter, our unit length), was calibrated by applying a vertical force \({f}_{{\rm{pull}}}\) to the central bead and measuring its displacement \(\Delta z\), yielding \({k}_{{\rm{mem}}}\equiv {f}_{{\rm{pull}}}/\Delta z\). A bound particle was attached to the central anchor point via a harmonic potential \(E/{k}_{B}T={k}_{{\rm{spr}}}{\left(r-{l}_{b}\right)}^{2}/2\), where \(r\) is the particle-anchor distance. The bound particle also interacted with membrane beads via a purely repulsive Lennard-Jones potential, i.e., the WCA potential12.
Simulations revealed that the bound particle induces an upward displacement of the anchor point (Fig. 1d), consistent with entropic pulling, alongside a localized downward force on nearby beads. This dual effect arises from thermal motion: as the particle drifts away to maximize entropy, it pulls the anchor upward, while collisions with neighboring beads transfer downward momentum to them. The net force on the membrane remains zero, but the spatial force distribution deforms the membrane. We quantified the entropic pulling force as \({f}_{{\rm{entropy}}}={k}_{{\rm{mem}}}\Delta z\), finding it insensitive to \({k}_{{\rm{spr}}}\) but inversely proportional to \({l}_{b}\). A fit to the data yields:
$${f}_{{\rm{entropy}}}=2{\alpha }_{{\rm{mem}}}{k}_{B}T/{l}_{b}{\rm{with}}{\alpha }_{{\rm{mem}}}=0.45$$
(2)
The prefactor \({\alpha }_{{\rm{mem}}}=0.45\) is determined by the fit of the theoretical equation to simulation data. In the following parts of this manuscript, we have several \(\alpha\) values, which are the prefactors determined by the fit of the theoretical equation to simulation or experimental data. One likely reason why \({\alpha }_{{\rm{mem}}} is that the push-down effect near the anchor partially offsets the pull-up force.
Entropic pulling effect on a chain
We now consider the entropic pulling effect for a particle bound to a chain. To be consistent with the macroscopic experiments presented below, we conducted Langevin dynamics simulations of a chain and a bound particle in two dimensions (Fig. 1f). Our simulations show that the bound particle pulls up the anchor point and pushes down nearby beads (Fig. 1g). Figure 1h shows the fit to the entropic pulling force in the simulations:
$${f}_{{\rm{entropy}}}={\alpha }_{{\rm{chain}}}{k}_{B}T/{l}_{b}{\rm{with}} \, {\alpha }_{{\rm{chain}}}=0.7$$
(3)
The prefactor \({\alpha }_{{\rm{chain}}}=0.7\) is determined by the fit of the theoretical equation to simulation data. Note that when switching from three dimensions to two dimensions, the configuration space of the bound particle changes from \(4\pi {r}^{2}\) to \(2\pi r\). Consequently, the coefficient 2 in Eqs. (1) and (2) reduce to 1 in Eq. (3). The fitting coefficient \({\alpha }_{{\rm{chain}}}\) accounts for approximations in the theoretical derivation.
Entropic pulling effect on a rod
Next, we consider the entropic pulling effect on a rod to understand our DNA experiments presented below. We performed Langevin dynamics simulations of a rod consisting of six layers of beads (Fig. 1i). We set the bond stiffness and angle stiffness among beads such that the rod diameter has an elasticity of \({k}_{{\rm{rod}}}\equiv {f}_{D}/\Delta D=233\,{k}_{{\rm{B}}}T/{\sigma }^{2}\). The elasticity was determined by manually applying a force \({f}_{D}\) and measuring the increase in rod diameter at the anchor point, \(\Delta D\). Then, we attached a particle to a rod bead (anchor point) using a spring with the spring constant \({k}_{{\rm{spr}}}\) and spring length \({l}_{b}\). Figure 1k shows the bound particle induces an entropic pull-up at the anchor point and an entropic push-down in the adjacent region, similar to the membrane case. To clearly view the pull-up and push-down, Fig. 1k transforms the deformation on a rod surface to the deformation on a flat surface.
Based on \(\Delta D\) at the anchor point induced by the bound particle, we calculated the entropic pulling force, \({f}_{{\rm{entropy}}}={k}_{{\rm{rod}}}\Delta D\). Figure 1l shows the entropic force increases for a shorter \({l}_{b}\), as expected. The fit to the simulation results in Fig. 1l yields:
$${f}_{{\rm{entropy}}}=2{\alpha }_{{\rm{rod}}}{k}_{B}T/{l}_{b}{\rm{with}} \, {\alpha }_{{\rm{rod}}}=0.35.$$
(4)
The prefactor \({\alpha }_{{\rm{rod}}}=0.35\) is determined by the fit of theoretical equation to simulation data. It is interesting to point out that for a rod with particles binding inside the rod, we predict the entropic pulling effect reduces the rod diameter, which was validated by our CG simulations (see SI Sec 1).
To further mimic our experiments of DNA deformations by ions, we assigned a negative charge (-\({Ze}\)) to the anchor point and a positive charge (+\({Ze}\)) to the bound particle, where \(Z\) is the ion valance. In such a setting, the Coulomb attraction between the anchor and bound particle replaces the spring. The Coulomb binding is not permanent and may break during simulation. Accordingly, we change the theoretically predicted entropic force to:
$${f}_{{\rm{entropy}}}=2{\alpha }_{{\rm{rod}}}{\gamma }_{{\rm{ion}}}{k}_{B}T/{l}_{b}$$
(5)
where \({\gamma }_{{\rm{ion}}}\) is the fraction of ion-rod binding conformations among all conformations. We numerically obtained \({\gamma }_{{\rm{ion}}}\) for different \(Z\) from simulations. After considering \({\gamma }_{{\rm{ion}}}\), Eq. (5) agrees with the simulation results for \(Z\ge 2\). For \(Z , the ion particle decreases the rod diameter through producing an osmotic pressure to the rod (Fig. 1m).
Entropic pulling in macroscopic experiments
To validate the entropic pulling, we performed macroscopic experiments of a chain on a vibration table (Fig. 2a). Here, vibration was used to mimic thermal noise in microscopic systems, which has been applied in previous studies13,14,15,16 and supported by the agreement of chain conformation-size distributions in macroscopic and microscopic cases (see SI Sec S3). Our idea is to examine whether a bound particle can pull the anchoring point of a chain through the entropic effect, resembling Fig. 1g.
Fig. 2: Entropic pulling on a macroscopic chain.
a A chain was placed on a vibrating table and monitored by a camera on top. b Experimental snapshot of the chain. A particle was bound to the chain via a spring, and it can hit the chain during vibration. The positions of chain beads were recognized by OpenCV. c Average chain conformation with a bound particle shows a distinct hump at the anchor. The sidechain length is \({l}_{b}=4\) cm. d Comparison of average main-chain conformations with upside binding (y > 0) and downside binding (y e Comparison of average main-chain conformations with three sidechain lengths: \({l}_{b}=\mathrm{3,4}\) and \(5\) cm. The sidechains are always upward. The solid line is from our simulation. f Time evolution of the anchor position in the y-direction. g Distributions of the anchor and reference-bead positions: \(\Omega ({Y}_{{\rm{anchor}}})\) and \(\Omega ({Y}_{{\rm{ref}}})\). The binding is upside. The reference beads are labeled in (b) and located 5 beads away from the anchor point. The bottom panel shows the corresponding potential-of-mean-force (PMF). h The differences in PMFs between the anchor point and reference beads for \({l}_{b}=\mathrm{3,4}{\rm{and}}5\) cm. The dash lines are linear fits.
The chain consisted of 70 hollow iron beads connected by an iron rod. Each bead had a diameter of 0.35 cm, and the chain contour length was 37 cm. We attached a particle to the center of the main chain using a spring. To facilitate the attachment, the bound particle was constructed of two beads (blue) and a short link (\({l}_{b}=\) 3, 4, or 5 cm. The four beads at the chain ends were securely fastened to the vibration table using black adhesive tapes, leaving 66 beads for vibration. The end-to-end distance was fixed as 30 cm to optimize the magnitude of chain conformational fluctuation (see SI Sec 2.2 for additional experiments with other end-to-end distances). The electromagnetic vibration table operated with a linear bearing to ensure vertical vibrations, with a frequency of 40 Hz and an amplitude of 0.09 cm. This amplitude enables sufficient chain motion and reduces the flipping of the bound particle between the two sides of the main chain. During vibration, the bound particle swings as shown by two example configurations in Fig. 2b. In each experiment, the vibration lasted for more than 10 minutes, and we recorded the video at a frame rate of 100 per second for analysis.
We identified the position of each bead in every video frame using OpenCV17 (Fig. 2b). Figure 2c shows the average main-chain conformation with the bound particle, after subtracting the y-coordinate of each bead in the absence of the bound particle. A hump at the anchor point demonstrates the entropic pulling effect. The hump is surrounded by two shallow depression regions, indicating the entropic pulling-down effect. To confirm the hump was caused by the bound particle, we switched the bound particle from the upside to the downside of the main chain (Fig. 2d) and observed the switch of the hump direction as expected. It is worth noting that if the hump is caused by the gravity of the bound particle on an inclined platform, the hump direction would remain unchanged for both binding directions, because the pulling direction by the gravity of the bound particle is not affected by the binding side. So, the switch of hump direction in Fig. 2d excludes the possibility that the hump is caused by the gravitational pulling on an inclined platform.
Figure 2e compares the humps for three different sidechain lengths. As predicted by Eq. (5), a shorter sidechain induces a larger entropic force, validated by experimental results in Fig. 2e.
Next, we performed a free-energy analysis. Figure 2f shows the evolution of the y-coordinator of the anchor, \({Y}_{{\rm{anchor}}}\), during vibration. From it, we calculated the distribution, \(\Omega ({Y}_{{\rm{anchor}}})\) (Fig. 2g) and the potential of mean force (PMF): \({F}_{{\rm{anchor}}}/({k}_{B}{T})^{ * }=- {\mathrm{ln}} [\Omega \left({Y}_{{\rm{anchor}}}\right)]\). We added a star symbol in \(({k}_{B}{T})^{ * }\) to represent an effective Boltzmann energy in the macroscopic experiments. We will see soon that \(({k}_{B}{T})^{ * }\) can be canceled out. To isolate the effect of the bound particle on the PMF, we need to know the PMF in the absence of the bound particle. To avoid the difference between different experiments, we used the PMF of some reference beads, \({F}_{{\rm{ref}}}\), in the same experiments with the bound particle. These reference beads were selected 5-beads aways from the anchor point such that they are not affected by the entropic pulling and also locate in the middle of the chain, resembling the anchor point (see SI Sec 2.3 for analysis of another reference bead). Then, we calculated the difference: \(\Delta F={F}_{{\rm{anchor}}}-{F}_{{\rm{ref}}}\), which corresponds to the effect of the bound particle. The results of \(\Delta F\) are presented in Fig. 2h. Linear fits to \(\Delta F\) give the equations: \(\partial \Delta F/\partial {Y}_{{\rm{anchor}}}\,\)= 0.24, 0.2, and 0.15 \(({k}_{{\rm{B}}}{T})^{ * }\)/cm for \({l}_{b}\,\)= 3, 4, and 5 cm, respectively. This linear behavior agrees with the theoretical prediction in Eq. (3): \({f}_{{\rm{entropy}}}={\alpha }_{{\rm{chain}}}{\left({k}_{B}T\right)}^{ * }/{l}_{b}\). Experimental results correspond to the coefficient \({\alpha }_{{\rm{chain}}}\) of 0.72, 0.8, and 0.75 for \({l}_{b}\,\)= 3, 4, and 5 cm, respectively. Note that \({\left({k}_{B}T\right)}^{ * }\) shows up in both the experimental result of \(\Delta F\) and the theoretical prediction \({f}_{{\rm{entropy}}}\), allowing for comparison without needing the explicit value of \({\left({k}_{B}T\right)}^{ * }\). The effective Boltzmann energy \({\left({k}_{{\rm{B}}}T\right)}^{ * }\) cancels out because the pulling force induced by binding is an entropic force, proportional to \({\left({k}_{{\rm{B}}}T\right)}^{ * }\), and the spring constant of the entropic elasticity for the chain deformation is also proportional to \({\left({k}_{{\rm{B}}}T\right)}^{ * }\). The ratio of these two terms is the chain deformation magnitude, independent of \({\left({k}_{{\rm{B}}}T\right)}^{ * }\). See more discussion in SI Sec 2.4.
Entropic pulling causes DNA deformation
Then, we present our DNA experiments, aiming to validate the entropic pulling force induced by multivalent ion binding, as shown in Fig. 1m. We employed single-molecule magnetic-tweezers (MT) experiments to measure DNA deformations induced by multivalent ions (Fig. 3a).
Fig. 3: Measurement of DNA twist changes induced by salt.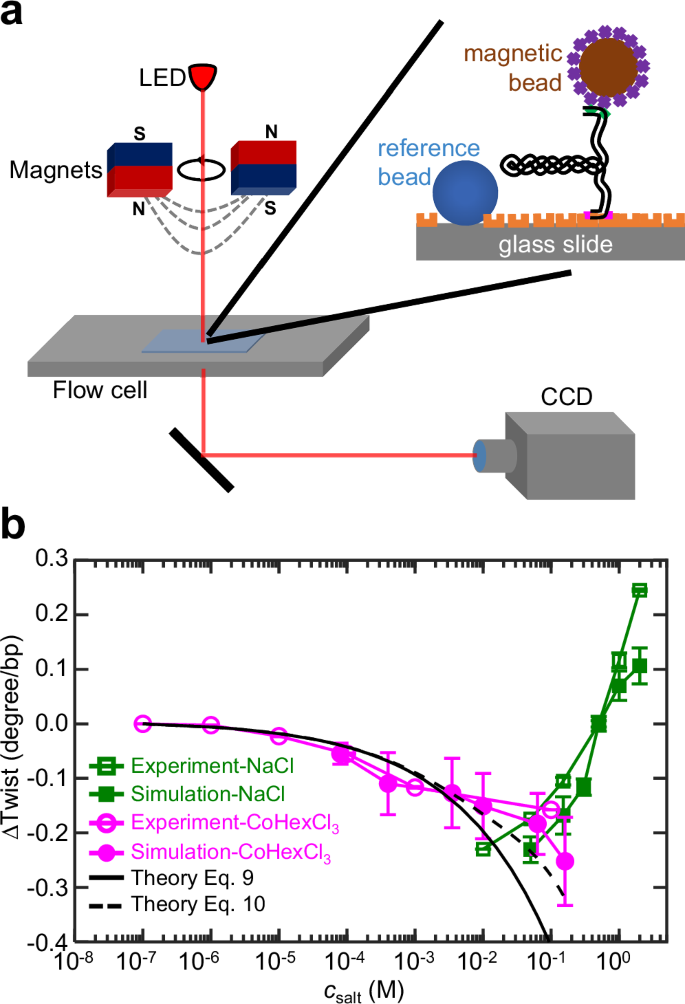
a Setup of magnetic-tweezer experiment. A torsion-constrained DNA was anchored between a glass slide and a superparamagnetic microbead. DNA twist changes can be detected through microbead rotation. b DNA twist changes induced by monovalent and multivalent ions: Na+ and CoHex3+. The data for Na+ are replicated from our previous study19.
MT experiments cannot directly measure DNA diameter. Alternatively, we adopted an approach: measuring twist change and then inferring DNA diameter change based on negative twist-diameter coupling. The approach was developed by Bustamante et al. 18 and extensively investigated in our recent studies to investigate DNA deformations induced by salt, temperature, and force19,20. The approach achieves precise measurement of DNA twist change by leveraging the twist accumulation along DNA: a tiny twist change, such as 0.01 degrees per base pair, can accumulate over 13596 bp DNA in our experiments and lead to 136 degrees of rotation of DNA ends, which can be detected by MT.
DNA twist and diameter are negatively coupled19, which has been pointed out by Bustamante et al. 18 and other studies21. The mechanism can be described as follows. DNA backbone length per base pair can be expressed as \(s=\sqrt{{\left(D\omega \right)}^{2}+{h}^{2}}\), where D is DNA diameter, \(\omega\) is DNA twist angle per bp, and \(h\) is the rise of two adjacent base pairs. The restraint of s causes a negative coupling between \(D\) and \(\omega\).
Figure 3b shows that increasing CoHex3+ from 0.1 μM to 0.1 M causes the decrease in the DNA twist of 0.16 degree/bp, which suggests the enlarging of DNA diameter based on negative twist-diameter coupling. The increase of DNA diameter by CoHex3+ agrees with the entropic pulling effect by on a rod (Fig. 1m).
Note that adding monovalent ions, e.g., Na+, induces an increase in DNA twist (Fig. 3b), an opposite trend with respect to the effect of trivalent ions, CoHex3+. The increase of DNA twist by monovalent ions has been measured and reported in our previous study19. We added these existing results of monovalent ions to Fig. 3b in order to show the surprising opposite trends induced by monovalent and trivalent ions.
Such opposite trends are predicted by Fig. 1m because the monovalent ion-DNA binding is weak and the ion-binding fraction \({\gamma }_{{\rm{ion}}}\) in Eq. (5) is small, which deactivates the entropic pulling effect. Instead, the electrostatic screening effect dominates. Monovalent ions screen DNA inter-strand repulsion, which reduces DNA diameter and then increases DNA twist through twist-diameter coupling. The different mechanisms for monovalent and multivalent ions are illustrated in Fig. 4a, b. One might think the opposite effect of CoHex3+ on DNA twist is caused by DNA overcharging with multivalent cations. However, this explanation is unlikely because DNA overcharging occurs only when CoHex3+ concentration exceeds a threshold ( ~ 1 mM)22, while our experimental result in Fig. 3b shows the same trend at very low concentrations of CoHex3+ down to 0.1 μM, where DNA overcharging has not yet occurred.
Fig. 4: Mechanisms for DNA diameter and twist changes.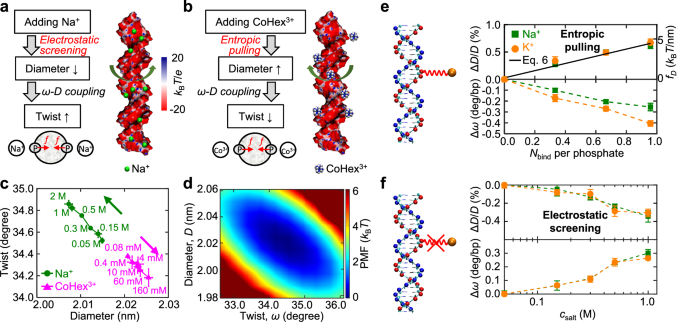
a, b Illustration of two mechanisms: electrostatic screening and entropic pulling. Surface electrostatic potentials were calculated by the APBS solver34. c DNA twist versus diameter at different ion concentrations. d The two-dimensional potential of mean force from the simulation results at 0.08 mM CoHex3+. e Connecting Na+ or K+ ions with DNA phosphate groups by artificial springs, and the corresponding changes in DNA diameter and twist. f Simulation results when turning off the artificial springs.
To confirm the above mechanism for DNA deformations induced by ions, we performed all-atom molecular dynamics (MD) simulations of a 25 bp dsDNA using the sequence CGACTCTACGGAAGGGCATCTGCGC23. See SI Sec 5.2 for simulation results of different DNA lengths. We used the GROMACS program24 with AMBER OL15 force field25. For each concentration of NaCl or CoHexCl3, we ran a simulation for 600 ns. Our simulations provide several results. First, they reproduce two experimental trends: adding Na+ increases DNA twist, while adding CoHex3+ decreases DNA twist (Fig. 3b). Second, they reveal that Na+ decreases DNA diameter, whereas CoHex3+ increases DNA diameter, as predicted. Third, our simulations observed the negative twist-diameter coupling for DNA with CoHex3+, similar to the case of DNA with Na+19 as shown in Fig. 4c. We quantify this coupling by the two-dimensional potential of mean force (PMF) with respect to DNA twist and diameter (Fig. 4d). Fitting the PMF19 by \(F={k}_{\omega }{\left(\Delta \omega \right)}^{2}+{k}_{D}{\left(\Delta D\right)}^{2}+{k}_{\omega D}\Delta \omega \Delta D\) yields the coupling constant kωD≈5.46 ± 0.56 kBT/deg.nm. This coupling constant is insensitive to \({c}_{{\rm{salt}}}\) (Supplementary Table S1).
To further validate the entropic pulling effect, we performed additional simulations: adding artificial springs between Na+ ions (or K+ ions) and phosphate groups on DNA (Fig. 4e and SI Sec S5.3). These artificial springs are used to make strong Na+-DNA binding, like CoHex3+. As expected, these artificially bound Na+ or K+ ions enlarge the DNA diameter, like CoHex3+. For comparison, the normal MD simulation results without artificial springs are shown in Fig. 4f. Since twist-diameter coupling is always effective, reversing the direction of diameter change causes the reversal of the direction for twist change (Fig. 4e, f).
Then, we validate the theoretically predicted entropic pulling force induced by ions. The predicted and measured pulling forces follow:
$$\begin{array}{c}{f}_{{\rm{entropy}}}^{{\rm{predicted}}}=2{\alpha }_{{dna}}{k}_{{\rm{B}}}T/{l}_{b},\\ {f}_{{\rm{entropy}}}^{{\rm{measured}}}={k}_{D}\Delta D\end{array}$$
(6)
where \({l}_{b}\) = 0.3 nm is the average distance between bound cations and DNA phosphate groups, \({k}_{D}\approx 275\,{k}_{{\rm{B}}}T/{\rm{n}}{{\rm{m}}}^{2}\) is the elasticity of DNA diameter19, and \(\Delta D\) is DNA diameter variation induced by ion binding and can be measured in simulations. By matching \({f}_{{\rm{entropy}}}^{{\rm{predicted}}}\) and \({f}_{{\rm{entropy}}}^{{\rm{measured}}}\), we obtain \({\alpha }_{{dna}}\approx 0.56\), which is close to \({\alpha }_{{\rm{rod}}}=0.35\) in Eq. (4). The relationship between measured and predicted forces can be found in SI Sec 1.5.
Lastly, we apply the entropic pulling effect to calculate the DNA twist change induced by CoHex3+. First, we need to know the number of CoHex3+ ions binding on each DNA phosphate group, \({N}_{{\rm{Co}}}^{{\rm{phos}}}\), for a given \({c}_{{\rm{salt}}}\). We calculated \({N}_{{\rm{Co}}}^{{\rm{phos}}}\) from our all-atom MD simulations (SI Sec S5.4) and obtained the empirical equation:
$${N}_{{\rm{Co}}}^{{\rm{phos}}}={\left({c}_{{\rm{salt}}}/{c}_{0}\right)}^{0.3}.$$
(7)
where \({c}_{0}=4.1\,{\rm{M}}\). Then, the entropic pulling force on each base pair is
$${f}_{D}=2{N}_{{\rm{Co}}}^{{\rm{phos}}}{f}_{1}=2{\left(\frac{{c}_{{\rm{salt}}}}{4.1}{\rm{M}}\right)}^{0.3}\times 2\times 0.56\times \frac{{k}_{{\rm{B}}}T}{0.3\times {10}^{-9}}$$
(8)
The first coefficient 2 is added because each base pair contains two phosphate groups. Our previous study19 has derived DNA twist change induced by the force that enlarges DNA diameter:
$$\Delta \omega=-\frac{{f}_{D}{k}_{\omega D}}{\left[{k}_{\omega }{k}_{D}-{\left({k}_{\omega D}\right)}^{2}\right]}$$
(9)
where \({k}_{\omega }\) is the twist stiffness. As shown by the solid black line in Fig. 3b, our theory roughly agrees with our experimental and simulation results.
The above calculations using Eq. (9) only consider the entropic pulling effect caused by the strong binding of CoHex3+, but ignores the electrostatic screening of inter-strand repulsion provided by CoHex3+ ions. In principle, both effects should exist. After considering the electrostatic screening effect of CoHex3+ ions and the background NaCl, the effective force to change DNA diameter is the combination of entropic pulling force and electrostatic repulsion force, \({f}_{{\rm{e}}{\rm{lec}}}\):
$${f}_{D}^{{\prime} }={f}_{D}+{f}_{{\rm{elec}}}.$$
(10)
The derivation of \({f}_{{\rm{elec}}}\) can be found in our previous work and SI Sec. S5.6 based on Manning’s theory19,26. Substituting \({f}_{D}\) by \({f}_{D}^{{\prime} }\), our theoretical calculations achieve better agreement with experimental and simulation results, as shown in Fig. 3(b). See Fig. S21 for more details.
Biological relevance of the entropic pulling force
Cells generate force in multiple ways to accomplish different tasks. Recent studies have found that entropic force can be generated in many proteins, especially heat shock proteins (Hsps)2 and intrinsically disordered proteins27. These proteins are often bound to or restricted by other objects. Some fragments of these proteins tend to escape to gain more entropy, which produce entropic pulling force.
Recent studies have found that Hsp70, one type of Hsp protein, utilizes entropic force to perform critical biological functions2, such as unfolding misfolded proteins1,28,29 and disassembling protein aggregates3. Protein aggregation is a key reason for neurodegenerative diseases such as Alzheimer’s disease and Parkinson’s disease, and hence controlling the entropic force can help to develop new therapeutic approaches for neurodegenerative diseases4,30.
Entropic force is also produced and utilized by intrinsically disordered proteins for various cellular tasks, including facilitating membrane-curvature sensing31,32,33 and transporting peptides across membranes5. For some partially disordered proteins, the disorder segments of the protein can produce an entropic force to tune biological functions of the ordered segments of the protein6.
Compared with these previous studies, our work presents experimental, analytical, and simulation results for the entropic force in a series of systems. Integration of these results provides a simple yet comprehensive understanding of the physical mechanism underlying this entropic force.