
Phil Radford explores trade after Brexit and argues that more influential factors than just Brexit explain the UK’s poor economic performance.
Brexit’s impact on trade is topical again as Rachel Reeves seeks to explain what most observers expect to be significant tax rises. Doppelganger models have been the principal tool by which economists have gauged Brexit’s impact on UK trade. They involve creating a counterfactual model for UK trade had it not left the EU, based on how similar exporting economies have performed. The difference between the UK’s actual performance and the counterfactual is the ‘verdict’.
In response to my earlier analysis that the impact of Brexit on UK trade has been exaggerated, John Springford responded that his doppelganger, which shows UK export performance falling behind since Brexit, was a more robust method.
I am grateful to Springford for correcting one of his charts that showed the UK automotive sector drastically underperforming his doppelganger.
Nevertheless, two key issues remain. First, his analysis does not accurately reflect UK export sectors. Second, sectoral export performance varies between countries, but for non-Brexit reasons.
An appreciation of UK aerospace is essential to any thorough appraisal of post-Brexit UK trade. According to ONS data it is typically our second largest export industry. It has also suffered the biggest recent damage. In 2020 and 2021, exports dropped £9–10bn on 2019 levels. In percentage terms, this surpassed even the auto sector’s downturn.
The cause was the pandemic-related collapse in commercial aerospace. Airliner deliveries from Boeing/Airbus halved from 2018 to 2020, from 1,606 to just 723. That duopoly is where the bulk of UK civil aerospace exports end up. Recovery has been slow.
The problem is how to incorporate this sectoral hit into a doppelganger cohort. Very few countries have a commercial aerospace sector to rival the UK’s. Moreover, our exports are skewed towards wide-body aircraft, where demand slumped. Thus UK exports were affected asymmetrically.
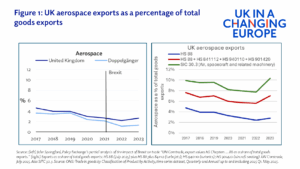
At first sight, Springford appears to have done this well. His aerospace chart (reproduced above left) captures a rapid decline in exports, and the UK’s performance tracks the doppelganger. But his UK data begins in 2017 with aerospace accounting for just 5% of UK goods exports, when it should be 10%.
The problem is methodological. According to UN Comtrade data many of the UK’s most valuable aerospace engineering exports fall outside the HS 88 grouping that Springford categorised as ‘aerospace’. The exports he omitted include Rolls Royce jet engines (HS 841112), navigational avionics (HS 901420) and aircraft seating (HS 940110) (see red line, above right).
Thus, UK’s aerospace exports comprise a far higher share of UK exports than Springford claims (10% in 2023 – see the green line – versus just over 1% for the doppelganger).
Secondly, just because UK exports have diverged from other countries since 2020, it doesn’t automatically mean Brexit is the cause.
Consider the role of energy. In his critique, Springford revealed the basic composition of his doppelganger. He gave Norway pole position with a 23% share, and the US second place with a 19% share. Both countries are huge energy producers, and both have enjoyed a post-2016 export boom in energy. Meanwhile, the UK is on a whole different trajectory and for reasons unconnected with Brexit.
Naturally, this divergence feeds into exports. The chart below tracks the swift divergence in energy exports between Norway, the UK and the US over the Brexit period.
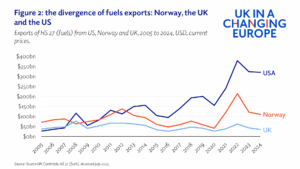
No-one would claim this divergence has anything to do with Brexit. But can energy alone sway total goods exports for the US and Norway, and thereby impact country-to-country comparisons? Apparently, it can.
Figure 3. The role of fuel in post-2016 export growth for Norway and the US
(US $)
Source: UN Comtrade, accessed July 2025. Data is for HS 27 (fuels). Current prices. Excludes precious metals ( HS71).
From 2016 to 2024, Norway’s goods exports soared by 88% (in nominal terms), with fuels accounting for 80% of that rise. US exports also rose strongly, with 38% of that due to fuels. So how does that impact the doppelganger?
It is impossible to say without Springford’s methodology, but he allotted 42% of his doppelganger cohort to Norway and the US alone. According to my own, back-of-the-envelope calculation (see table 1), more than half the weighted export growth for Norway, the US, Germany and France (70% of Springford’s doppelganger) disappears if you remove increases in fuel exports. But only Springford can answer that point.
Table 1: The impact of fuel (HS 27) on doppelganger country growth rates, 2016 to 2024 (HS 71 excluded from all calculations)
increase
increase in exports
without HS27
increase
Source: UN Comtrade, accessed August 2025
A: Each country’s share of John Springford’s doppelganger, according to his critique
B: Their relative share if the doppelganger were restricted to just Norway, the US, Germany and France
D: Calculated as C multiplied by B. Thus, Norway nominally accounts for more growth in the Springford doppelganger than the other three countries combined, if fuels are included.
F: Calculated as E multiplied by B.
The core issue, however, is that a divergence in export performance has occurred for reasons unconnected with Brexit. And energy is not the only instance.
For example, German and US pharmaceuticals exports jumped by US$36bn and US$29bn (respectively, current prices) from 2019 to 2022, thanks to covid-19 vaccine production. These are big numbers; either would have transformed UK aggregate export values. Yet they were due to a one-off factor.
Or consider chemicals. As of last year, the single biggest post-Brexit ‘drag’ on UK exports is chemicals. Exports were down £3.8bn in EU markets compared to 2019 (2019 prices), and £3bn in non-EU markets. According to industry sources, Brexit is just one factor among many causes, which include high energy costs, weak demand and high labour costs.
As well as the compositional challenge, there’s also a strategic issue. Doppelgangers worked well when the international trading system was stable. But how are they supposed to be useful tools of comparison – let along diagnostics – when multiple disruptions occur simultaneously? Can they isolate causation when domestic policy settings force a wind-down of what used to be major export industries, specifically energy and chemicals?
Back in 2018, the OBR specifically qualified its endorsement of doppelgangers as an analytical tool in tracking the effect Brexit on UK economic growth. It cautioned that doppelgangers “…will probably become less reliable over time as the growth [sic] in countries used to produce the synthetic UK are more likely to diverge for reasons other than Brexit.” The same applies to trade – and there has been a deluge of such reasons since 2020.
To date, doppelgangers have given a convincing account of UK trade – and the cause of poor performance. But peer below the surface of individual sectors and a complex picture emerges. Big export ‘losses’ in autos and aerospace are primarily due to global downturns. Comparative failures in energy, chemicals and pharma can be traced to domestic policy choices. Brexit is a convenient scapegoat, but our future prosperity depends on analysts making a correct diagnosis of the UK’s recent trading performance.
By Phil Radford, author of ‘The Quiet Triumph of British Engineering: Competitive advantage in premium cars, civil aerospace and power machinery.’