TH Faraday rotation in monolayer WS2
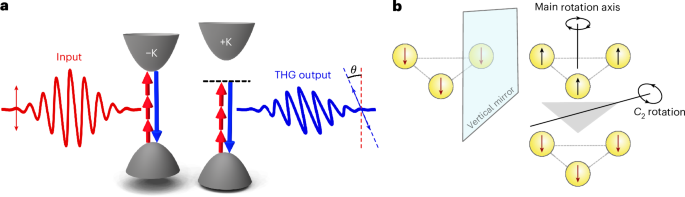
First, we study the non-centrosymmetric WS2 monolayer. The excitation of TMD monolayers with circularly polarized light is both spin and valley selective41. By contrast, linearly polarized light interacts equally with both valleys. Thus, when the FB is linearly polarized and TRS is preserved, the emitted TH signal is linearly polarized and parallel to the input FB (Fig. 2c). The situation changes when an elliptically polarized pulse interacts with the sample, which can be interpreted as a superposition of linearly and circularly polarized light. Although the linearly polarized part has no effect on TRS, the circularly polarized component of the FB creates a valley imbalance by breaking TRS via the valley-selective OS and BS effects26,41 (Fig. 2f). In this new configuration, the symmetry of the monolayer is reduced to \(\bar{6}{m}^{{\prime} }{2}^{{\prime} }\), as discussed above and depicted in Fig. 2e. This symmetry reduction is equivalent to a modification of the χ(3) tensor. In addition to the time-invariant so-called intrinsic \({\chi }_{{\rm{int}}}^{(3)}\) elements, corresponding to the unperturbed \(\bar{6}m2\) point group, time-non-invariant \({\chi }_{{\rm{TRS}}}^{(3)}\) elements induced by the broken TRS appear. As we show in detail in Supplementary Section 4, the presence of these additional elements leads to a rotation θ of the TH polarization compared with the unperturbed case, when assuming normal incidence of the electromagnetic field on the sample and within the electric dipole approximation, according to
$$\tan 2\theta =2\,\frac{\,\text{Re}\,\left({\;\chi }_{{\rm{int}}}^{(3)}{\chi }_{{\rm{TRS}}}^{(3)* }\right)}{{\left|{\;\chi }_{{\rm{TRS}}}^{(3)}\right| }^{2}-{\left|{\;\chi }_{{\rm{int}}}^{(3)}\right| }^{2}}\approx -2\,\frac{\,\text{Im}\,\left({\;\chi }_{{\rm{TRS}}}^{(3)}\right)}{\,\text{Im}\,\left({\;\chi }_{{\rm{int}}}^{(3)}\right)},$$
(1)
where * denotes the complex conjugate. Here we have assumed \(| {\chi }_{{\rm{TRS}}}^{(3)}| \ll | {\chi }_{{\rm{int}}}^{(3)}|\) and \(\,\text{Re}\,({\chi }_{{\rm{int}}}^{(3)})=\,\text{Re}\,({\chi }_{{\rm{TRS}}}^{(3)})=0\) at resonance (Supplementary Sections 4 and 5).
To gain a deeper understanding of the microscopic mechanisms of TRS breaking, we use analytical expressions for \({\chi }_{{\rm{int}}}^{(3)}\) and \({\chi }_{{\rm{TRS}}}^{(3)}\) derived from the semiconductor Bloch equations41,42,43. The expressions depend on the band structure and dipole matrix elements, which we obtain from a two-band TMD monolayer Hamiltonian including the OS and BS shift that break TRS41. The final analytical expressions for \({\chi }_{{\rm{int}}}^{(3)}\) and \({\chi }_{{\rm{TRS}}}^{(3)}\) are given in Supplementary Section 6, and we use them to evaluate the TH rotation θ from equation (1) as
$$\tan 2\theta =-\,\frac{2}{1+{(2\varDelta -3\hslash \omega )}^{2}/{(\hslash /{T}_{2})}^{2}}\,\frac{{\mathrm{\Delta }}E}{\hslash /{T}_{2}}$$
(2)
$$=-\,\frac{3}{16}\,\sin 2\alpha \,\frac{1}{1+{(2\varDelta -3\hslash \omega )}^{2}/{(\hslash /{T}_{2})}^{2}}\,\frac{{{\mathcal{E}}}^{2}{d}^{2}}{\hslash \varDelta /{T}_{2}}\,.$$
(3)
Here Δ is the onsite energy (2Δ is the optical gap), α is the ellipticity angle of the polarization ellipse of the FB, T2 is the dephasing time, ω is the frequency of the beam and ΔE is the difference of the OS and BS shifts between the two valleys (Fig. 2). ΔE is proportional to the square of field strength \({\mathcal{E}}\) and the absolute value of the transition dipole moment (d), which is identical in the two valleys.
We can now compare our theoretical model with experimental results for monolayer WS2 (Fig. 3). The WS2 sample (Methods) shown in Fig. 3a (inset) consists of a mono-/bilayer region (marked in yellow/orange). Since the breaking of TRS is expected to mainly manifest at optical resonances41 (see equation (3): 2Δ = 3ℏω), we first perform PL and TH wavelength dependence to identify these resonances. For the TH wavelength dependence, the FB is linearly polarized. We find the A1s excitonic resonance at 615 nm (Fig. 3a), where we notice a slight blueshift of the TH resonance compared with the PL emission. This can be ascribed to a valley-symmetric bandgap opening in the case of excitation with linearly polarized light44,45, which modulates the bandgap without breaking TRS. In all the following experiments (Methods), the TH rotation angle is measured by rotating a polarizer in front of the detector to obtain a polarization-dependent pattern for the TH signal, as shown in Fig. 3b (inset) for two example ellipticity angles of 0° (linearly polarized) and –20° (elliptically polarized). Further examples of polarization patterns are provided in Supplementary Section 7. The polarization-dependent TH patterns are fitted with a \({\cos }^{2}\) function, from which we obtain the rotation angle θ and the error of the numerical fitting. We fix the wavelength of the FB at 1,830 nm to work close to the A1s resonance, and perform two different sets of experiments: (1) we fix the input pulse energy and tune the ellipticity of the input FB by rotating a quarter-wave plate in front of the sample (Fig. 3b); (2) we fix the ellipticity and tune the input pulse energy (Fig. 3c). In addition, we scan the wavelength across the A1s resonance with fixed pulse energy and ellipticity (Fig. 3d).
Fig. 3: PL and TH rotation measurements for different ellipticities and pulse energies in monolayer WS2.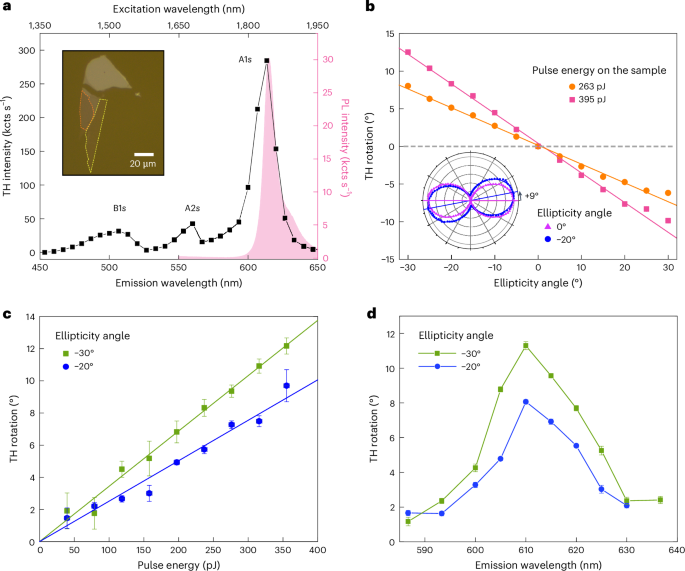
a, Comparison of the total emitted TH intensity for linear fundamental polarization (black squares, left axis) as a function of FB wavelength and the emitted PL (pink line, right axis). The inset shows an optical microscopy image of the used WS2 sample with the mono- and bilayer regions marked by dotted yellow and orange lines, respectively. b, TH rotation angle as a function of the FB ellipticity angle and for an excitation pulse energy of 263 pJ (orange circles) and 395 pJ (pink squares). The solid lines are linear fits to the data. The inset shows the elliptical polarization pattern of the emitted TH for linear (violet triangles) and elliptical (blue circles) input polarization. c, Pulse energy dependence of the TH rotation for –20° (blue circles) and −30° (green squares). The solid lines are linear fits to the data with a fixed intercept of 0° rotation at 0 pJ. d, Wavelength dependence of the TH rotation angle for an input pulse energy of 395 pJ for ellipticity angles of −20° (blue circles) and −30° (green squares). Data in b–d are presented as mean values ± regression standard error.
For the first type of experiments (Fig. 3b), we observe a clear rotation of the main axis of the polarization ellipse, which can be explained by the new elements of the NLO susceptibility due to broken TRS, as discussed above. The TH rotation angle scales linearly with FB ellipticity: a larger circular component of the FB enhances the effect of TRS breaking. We note that circular THG is forbidden by angular momentum conservation46, and the total TH intensity scales with the \({\cos }^{2}\) of ellipticity. Thus, since the TH intensity decreases drastically for increasing ellipticity of the FB beam, we investigate the TH rotation only up to an ellipticity angle of ±30°.
In the second set of experiments, we fix the ellipticity angle to −30° and –20° and scan the input pulse energy in the range from 40 pJ to 355 pJ. The results are shown in Fig. 3c, where we observe a close-to-linear dependence of the TH rotation angle with respect to the input pulse energy, as expected for TRS breaking due to OS and BS shifts41. We highlight that in the fitting shown in Fig. 3c, we fixed the intercept to zero, because the TH rotation must be zero for an unperturbed sample. Finally, we measure the wavelength dependence of the TH rotation angle close to exciton resonance for two different ellipticity angles of −20° and –30° and a fixed input pulse energy of 395 pJ on the sample (Fig. 3d). We observe the largest TH rotation for excitation at the A1s resonance, whereas the rotation angle decreases for off-resonant wavelengths. We further note that even though the TH intensity close to resonances can be affected by bandgap modulations that preserve TRS (for example, excitation with linearly polarized light44,45), the TH Faraday rotation only measures those changes in the bandgap that effectively break TRS.
Next, we quantitatively compare the experimental results with the analytical equation (3) in Fig. 4. According to equation (3), the TH rotation θ depends on the ellipticity angle α, frequency ω and field strength \({\mathcal{E}}\) of the FB. Furthermore, θ also depends on the material parameters: optical gap 2Δ, dipole element d and dephasing time T2. To determine 2Δ and T2, we focus on the peak of θ(ω) in equation (3) at the TH resonance, where 3ω = 2Δ. From the peak position of ~615 nm in the wavelength scan (Fig. 4a), we extract 2Δ = 2.1 eV and from the linewidth of the peak, we obtain T2 = 28 fs. We note that the theoretical model only includes dephasing mechanisms such as electron–electron and electron–phonon scattering, leading to a homogeneous broadening. However, the experiments are sensitive to any homogeneous and inhomogeneous broadening mechanism, including space-local bandgap modulations caused by defects and strain47. Our extracted value of T2 = 28 fs effectively includes all of these broadening mechanisms.
Fig. 4: Comparison of analytical model and experimental results for monolayer WS2.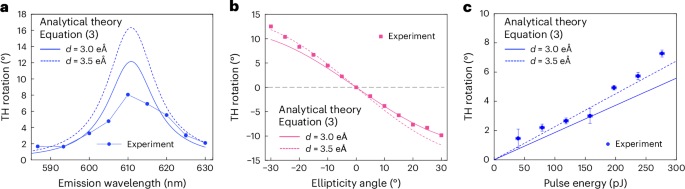
a, Wavelength-dependent TH rotation for a fixed ellipticity of −20° and an input pulse energy of 395 pJ (Fig. 3d, blue circles). b, Ellipticity-dependent TH rotation for a fixed input pulse energy of 395 pJ (Fig. 3b, pink squares). c, Pulse energy-dependent TH rotation for a fixed ellipticity of −20° (Fig. 3c, blue circles). For the analytical calculations, we use T2 = 28 fs, Δ = 1.05 eV and two values of the dipole element, namely, d = 3 eÅ (solid lines) and d = 3.5 eÅ (dashed lines). Data are presented as mean values ± regression standard error.
After determining Δ and T2, we report the TH rotation θ from equation (3) for two values of the dipole element, namely, d = 3.0 eÅ and d = 3.5 eÅ. The theoretical and experimental results show good agreement in their wavelength dependence, with peak heights matching within a factor of two (Fig. 4a). For the ellipticity dependence (Fig. 4b), the analytical model gives a nonlinear curve that describes the experimental results with excellent accuracy. The deviation from linear dependence, which we use for simplicity in Fig. 3b, can be understood from the \(\sin 2\alpha\) dependence in equation (3), assuming a small θ such that \(\tan \theta \approx \theta \propto \sin 2\alpha\). Similarly, we find a linear increase in θ with the fundamental pulse energy both in experiment and in the analytical model (via \({{\mathcal{E}}}^{2}\) in equation (3); Fig. 4c).
TH Faraday rotation in centrosymmetric bilayer WS2
We now demonstrate the possibility to probe broken TRS in centrosymmetric bilayer WS2. The breaking of TRS in TMD bilayers follows a similar principle as in the monolayer case (Fig. 2g–l): an elliptical input pulse leads to alternating gap opening (in the +K valley of the upper layer and −K valley of the bottom layer) due to spin-valley-layer locking28 (Fig. 2l). When TRS is broken, the valleys remain energetically degenerate, but they are no longer spin degenerate. This can be understood by considering the energy spin relation of a system where SIS is preserved (E↑(+k) = E↑(−k)) and TRS is broken (E↑(+k) ≠ E↓(−k)). Looking at the magnetic point groups, bilayer TMDs belong to \(\bar{3}m\)/\(\bar{3}{m}^{{\prime} }\) when TRS is preserved/broken. These point groups have the same in-plane components of the χ(3) susceptibility as the \(\bar{6}m2\)/\(\bar{6}{m}^{{\prime} }{2}^{{\prime} }\) of monolayer TMDs (when TRS is preserved/broken). Thus, for in-plane excitation of the sample, we can apply exactly the same considerations done for monolayer TMDs also to the case of bilayer TMDs. We thus performed the same set of experiments discussed in Fig. 3 also for a bilayer WS2 crystal (Fig. 5).
Fig. 5: PL and TH rotation measurements for different ellipticity angles and pulse energy values in bilayer WS2.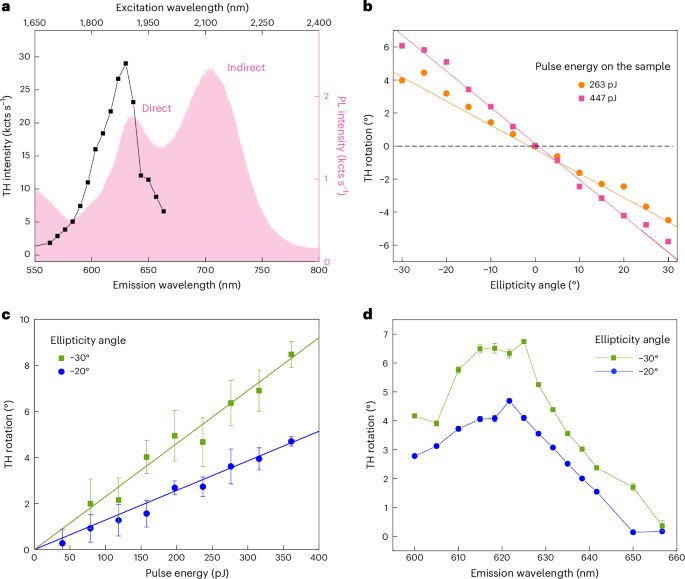
a, Comparison of the total emitted TH intensity (black squares, left axis) and the emitted PL for linear fundamental polarization (pink line, right axis) as a function of the excitation wavelength. b, Rotation of the emitted TH dependent on the ellipticity angle and for an excitation pulse energy of 263 pJ (orange circles) and 447 pJ (pink squares). The solid lines are linear fits to the data. c, Pulse energy dependence of the TH rotation for −20° (blue circles) and −30° (green squares). The solid lines are linear fits to the data with a fixed intercept of 0° rotation at 0 pJ. d, Wavelength dependence of the TH rotation for an input pulse energy of 395 pJ for ellipticity angles of −20° (blue circles) and −30° (green squares). Data in b–d are presented as mean values ± regression standard error.
We start with PL and TH wavelength dependence to determine the ±K direct transitions of the WS2 bilayer (Fig. 5a). The PL signal shows two maxima, which we assign to the momentum-direct and phonon-assisted momentum-indirect transitions42,48,49 at 635 nm and 705 nm, respectively. Momentum-indirect transitions cannot be probed by coherent and parametric harmonic generation, as they require the exchange of momentum with, for example, defects or phonons. For an emission wavelength of 625 nm (FB at 1,875 nm), we observe the maximum TH and assign the difference between PL and TH measurements to the valley and spin-symmetric bandgap modulation induced by linearly polarized light44,45. In our TH experiments, we will study only the momentum-direct ±K transitions at an FB wavelength of 1,875 nm.
In analogy with the monolayer case, the ellipticity dependence (Fig. 5b) shows a close-to-linear dependence of the TH rotation angle versus the FB ellipticity. The TH rotation in the case of bilayer WS2 follows the same rules discussed in the previous paragraph. Next, we study the pulse energy dependence of the TH rotation angle (Fig. 5c) for different ellipticity angles (−20° and −30°, shown as blue circles and green squares, respectively). We observe a close-to-linear dependence, which is again a clear indication that even in bilayer TMDs, broken TRS, for our experimental conditions, arises from all-optical bandgap modulation. Finally, we measure the wavelength dependence of the TH rotation angle for two different ellipticity angles of −20° and −30° and input pulse energy of 395 pJ (Fig. 5d). We observe the largest TH rotation for excitation at 625 nm, that is, at resonance with the momentum-direct ±K optical transitions.
All these experimental findings agree with our analytical model for bilayer WS2, which shows that both valleys contribute equally to the TH rotation. The model (Supplementary Section 6) gives a TH rotation angle for the bilayer of
$$\tan 2\theta =-\,\frac{2}{1+{(2\varDelta -3\hslash \omega )}^{2}/{(\hslash /{T}_{2})}^{2}}\,\frac{{\varDelta }_{{\rm{BL}}}^{\uparrow /\downarrow }}{\hslash /{T}_{2}}$$
(4)
$$=-\,\frac{3}{16}\sin 2\alpha \,\frac{1}{1+{(2\varDelta -3\hslash \omega )}^{2}/{(\hslash /{T}_{2})}^{2}}\,\frac{{{\mathcal{E}}}^{2}{d}^{2}}{\hslash \varDelta /{T}_{2}}\,.$$
(5)
This expression is almost identical to equation (3) obtained in the case of monolayer TMDs, with the main difference that the spin-valley-exclusive bandgap modulation of monolayer TMDs (that is, ΔE) is substituted by the valley-symmetric but spin-layer-selective bandgap modulation (that is, \({\varDelta }_{{\rm{BL}}}^{\uparrow /\downarrow }\)) in the case of bilayer TMDs. Besides, the primary parametric difference between mono- and bilayer samples is the dephasing time T2, which is shorter in the bilayer, an indirect-gap semiconductor with additional non-radiative decay channels compared with the monolayer. As a result, the model in equations (3) and (5) predicts a reduced TH rotation \({\theta }_{{\rm{res}}}\) at the TH resonance, since \(\tan 2{\theta }_{{\rm{res}}}\propto {T}_{2}\). This prediction aligns with our experimental observations, where the TH rotation in the bilayer is approximately half compared with that of the monolayer. Finally, we note that even the interlayer coupling (which we neglect in our model, being smaller compared with the spin–orbit coupling in W-based TMDs37) could play a role in explaining the lower TH rotation of bilayer compared with monolayer samples.