Introduction
Indonesia’s export relationship with the United States is one of its strongest and most stable bilateral trade channels. The U.S. consistently ranks among Indonesia’s top three export destinations, and its importance has grown as Indonesia shifts from raw commodities toward more manufactured and value-added goods. According to the latest Indonesia export data & US import data, the total value of Indonesia exports to the US reached $26.36 billion in 2024 and $23.05 billion in the first three quarters of 2025. The total value of the US-Indonesia trade reached $38.35 billion in 2024 and $32.61 billion in the first 3 quarters of 2025.
The US is the 2nd largest export partner of Indonesia, as per the Indonesia customs data & global trade data. Between 2015 and 2025, Indonesia’s export landscape has gone through several phases: commodity price downturns, industrial restructuring, the pandemic shock, a commodity boom, and finally a recovery supported by strong demand from trade partners like the U.S.
This blog walks through:
-
Indonesia’s export history to the US from 2015–2025
-
Key sectors driving exports to the U.S.
-
Why exports rose sharply in 2024–2025
-
Risks ahead
-
A detailed forecast for 2025–26, including baseline, optimistic, and downside scenarios
The goal is to give a clear, grounded picture of where Indonesia stands — and what might be coming next.
Historical Context: Indonesia’s Exports to the US Trends (2015–2025)
Indonesia’s total exports, across all destinations, tell an important story about how the country’s external sector has evolved. While not every year includes a clean breakdown of “exports to the U.S.”, the broader export trend shows the backdrop against which U.S.-bound exports moved, impacting the Indonesia-US trade.
2015–2017: Weak commodity prices, slow growth
In 2015, Indonesia’s total exports were just above USD 182 billion. Commodity markets were soft, especially in coal, palm oil, and natural rubber, all important for Indonesia. Low prices pulled down export revenues even when volumes were stable.
During this period, U.S.-bound exports remained steady but modest. Most of the growth came from manufactured goods like footwear, textiles, and some electrical machinery.
2018–2019: Gradual recovery
By 2018 and 2019, global commodity prices were improving, and Indonesia began shifting more assertively into manufactured exports. Electrical machinery components, rubber-based goods (including tires), and processed palm oil saw clearer growth.
The United States remained a key buyer, especially of:
2020–2021: Pandemic shock and fast recovery
2020 saw a sharp fall in global trade volumes due to lockdowns and supply chain disruptions. However, Indonesia bounced back quickly in 2021:
-
Total exports rose above USD 254 billion.
-
Demand for commodities surged.
-
U.S. demand for manufactured imports recovered faster than expected.
By 2021, the U.S. was Indonesia’s second-largest export destination for non-oil and gas goods.
2022–2023: Commodity boom, then normalization
Global commodity prices rose sharply during the early Russia–Ukraine conflict period. Indonesia benefited from higher prices for:
-
coal
-
palm oil
-
metals
-
rubber
By 2023, the surge had cooled, but Indonesia enjoyed strong export revenues and used the period to push its industrial upgrading agenda.
2024–2025: Manufacturing rebounds, U.S. demand strengthens
By 2024:
More importantly, exports to the United States grew faster than overall exports. Based on multilateral trade databases and Indonesian statistical releases, exports to the U.S. in 2024 were around USD 26–28 billion.
In early 2025, exports to the U.S. grew at a double-digit rate, outpacing exports to most other destinations. This sets the stage for the 2025–26 outlook.
Top Goods Indonesia Exports to US: What Does Indonesia Export to the USA?
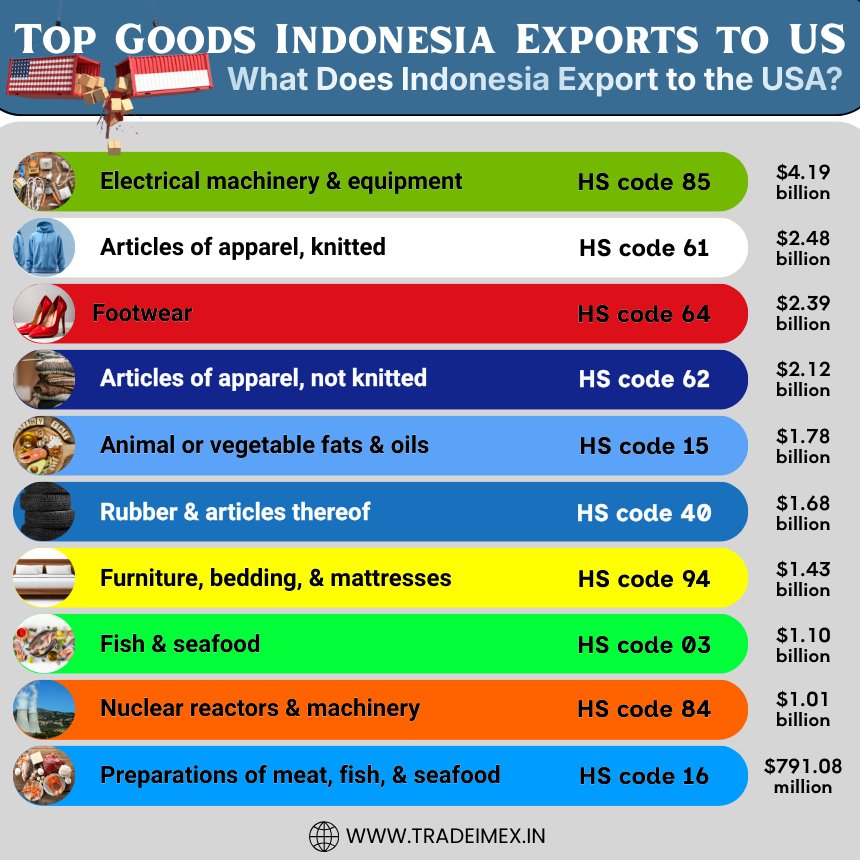
Indonesia has made a significant impact in the international market, particularly with its exports to the USA. Some of the top goods that Indonesia exports to the USA include textiles and apparel, footwear, rubber products, furniture, machinery, electronic goods, and automotive parts. These products showcase Indonesia’s diverse manufacturing capabilities and its continuous efforts to meet the demands of the American market. The top 10 products that Indonesia exports to the USA, as per the Indonesia shipment data and Indonesia-US trade data for 2024-25, include:
1. Electrical machinery & equipment (HS code 85): $4.19 billion
One of the top goods that Indonesia exports to the US is electrical machinery and equipment, amounting to a whopping $4.19 billion, as per the data on Indonesia electronics exports to the US by HS code. This includes a wide range of products such as electrical transformers, electric motors, and electrical capacitors. The demand for Indonesian electrical machinery and equipment in the US market can be attributed to Indonesia’s competitive pricing and high-quality products.
2. Articles of apparel, knitted (HS code 61): $2.48 billion
Indonesia is also well-known for its textile industry, with knitted articles of apparel being a major export to the US. With a value of $2.48 billion, Indonesian knitwear, such as sweaters, t-shirts, and dresses, is highly sought after in the US market. Indonesian textiles are renowned for their vibrant colors, intricate designs, and superior quality, making them a popular choice among American consumers.
3. Footwear (HS code 64): $2.39 billion
Indonesian footwear is another top export to the US, with a value of $2.39 billion. From stylish sandals to durable boots, Indonesian shoes are known for their comfort, durability, and affordability. The US market appreciates the diverse range of Indonesian footwear options, catering to different styles and preferences.
4. Articles of apparel, not knitted (HS code 62): $2.12 billion
In addition to knitted apparel, Indonesia also exports non-knitted articles of apparel to the US, totaling $2.12 billion. This category includes garments such as shirts, blouses, and trousers made from woven fabrics. Indonesian apparel is popular in the US due to its trendy designs, high-quality materials, and competitive pricing.
5. Animal or vegetable fats & oils (HS code 15): $1.78 billion
Animal and vegetable fats and oils are essential ingredients in many food products, making them a lucrative export for Indonesia. With a value of $1.78 billion, Indonesian fats and oils are used in various food items such as cooking oils, margarine, and confectionery. The US market values Indonesian fats and oils for their purity, freshness, and versatility in culinary applications.
6. Rubber & articles thereof (HS code 40): $1.68 billion
Rubber and rubber articles are another significant export from Indonesia to the US, amounting to $1.68 billion, as per the customs data on Indonesia rubber exports to the US by HS code. Indonesian rubber products such as tires, hoses, and belts are highly regarded for their durability, performance, and reliability. The US automotive and manufacturing industries rely on Indonesian rubber exports to meet their production needs.
7. Furniture, bedding, & mattresses (HS code 94): $1.43 billion
Indonesian furniture, bedding, and mattresses are sought after in the US market, with a value of $1.43 billion. From intricately carved teakwood furniture to luxurious bedding sets, Indonesian home furnishings are renowned for their craftsmanship, elegance, and durability. American consumers appreciate the unique designs and quality craftsmanship of Indonesian furniture, making it a popular choice for home decor.
8. Fish & seafood (HS code 03): $1.10 billion
Indonesia is known for its rich marine resources, making fish and seafood a significant export to the US. With a value of $1.10 billion, Indonesian fish and seafood, such as shrimp, tuna, and squid, are in high demand in the US market. The US values Indonesian fish and seafood for their freshness, sustainability, and diverse culinary applications.
9. Nuclear reactors & machinery (HS code 84): $1.01 billion
Indonesia also exports nuclear reactors and machinery to the US, amounting to $1.01 billion. This category includes a wide range of machinery and equipment used in various industries such as construction, manufacturing, and energy production. Indonesian nuclear reactors and machinery are known for their reliability, efficiency, and advanced technology, making them essential for US businesses.
10. Preparations of meat, fish, & seafood (HS code 16): $791.08 million
Lastly, preparations of meat, fish, and seafood are a popular export from Indonesia to the US, totaling $791.08 million. This category includes processed food items such as canned tuna, smoked sausages, and pickled fish. Indonesian food preparations are favored in the US for their authentic flavors, premium quality ingredients, and convenience.
Indonesia Exports to the US in the Last 10 Years: Historical Bilateral Trade Data
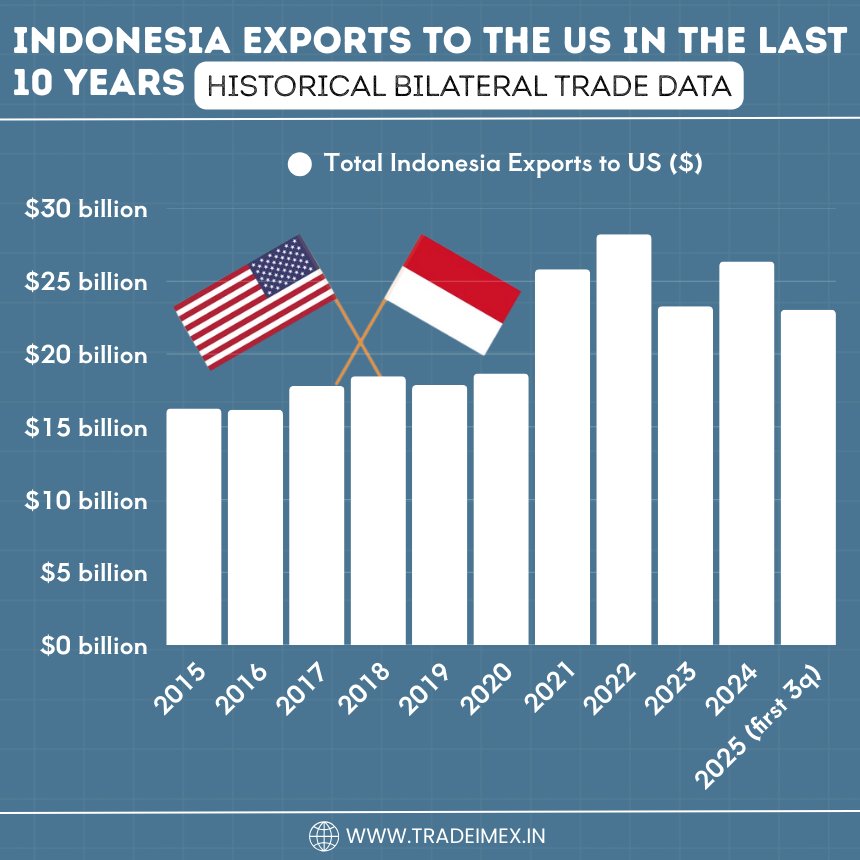
Year of Trade
Total Indonesia Exports to US ($)
2015
$16.26 billion
2016
$16.17 billion
2017
$17.81 billion
2018
$18.47 billion
2019
$17.87 billion
2020
$18.66 billion
2021
$25.83 billion
2022
$28.23 billion
2023
$23.28 billion
2024
$26.36 billion
2025 (first 3 quarters)
$23.05 billion
Indonesia’s Export Composition to the USA (What Indonesia Actually Sends)
Indonesia’s exports to the U.S. consist mostly of non-oil and gas manufactured goods and a smaller portion of resource-based commodities. The mix is fairly diversified, which helps Indonesia remain competitive even when commodity prices fluctuate.
Here are the five largest and most consistent export groups to the U.S.
1. Palm Oil and Its Derivatives
Even though crude palm oil typically goes to India, China, and Pakistan, the United States imports a meaningful volume of refined and processed palm oil derivatives such as:
These are higher-value processed products rather than basic crude palm oil, which fits Indonesia’s push toward more downstream processing.
2. Electrical Machinery and Equipment
This is one of the most dynamic categories. Indonesia exports:
-
wiring harnesses
-
electronic components
-
telecommunication parts
-
electrical panels
-
lighting equipment
Most go to U.S. manufacturers that integrate these components into finished products. The category shows Indonesia’s shift away from commodity dependence toward industrial exports.
3. Footwear
Indonesia is consistently one of the top global exporters of footwear. U.S. buyers import:
Many global brands have long-term manufacturing partnerships with Indonesian factories, making this sector resilient.
4. Rubber and Rubber-Based Products
Indonesia is a major natural rubber producer. Exports to the U.S. include:
Demand for Indonesian tires is particularly strong because they are competitively priced and meet U.S. quality standards.
5. Processed Industrial Goods
This includes a wide range:
-
furniture
-
wood products
-
paper and packaging
-
processed metals
-
plastics
Most of these categories have grown steadily over the past decade as Indonesian manufacturers gained efficiency and improved quality consistency.
Why Exports to the U.S. Grew Strongly in 2024–2025
Several forces came together to produce strong export numbers during this period.
1. Strong U.S. demand for manufactured goods
The U.S. economy remained resilient in 2024–2025. Consumer spending stayed steady and manufacturing activity gradually recovered. This supported imports of Indonesian:
-
footwear
-
household goods
-
electrical components
These categories typically hold up even during economic uncertainty because they are part of stable consumption patterns.
2. Indonesia’s shift toward non-oil and gas exports
Indonesia has spent years reducing reliance on oil and gas exports. Non-oil and gas exports now contribute more than 90 percent of goods exports. This shift benefits trade with the U.S., where demand for energy products is lower than demand for manufactured goods.
3. Industrial recovery after the pandemic & commodity boom
After the volatile 2019–2022 period, Indonesian factories stabilized production, improved trade, and secured steady supply chains. This helped meet U.S. import demand more reliably.
4. Indonesia’s advantage in palm oil, rubber, & processed industrial goods
The U.S. requires large and consistent supply sources for:
Indonesia’s established production capacity provides stability that U.S. buyers trust.
Early 2025 trade data shows rising momentum
Data for early 2025 show:
-
Double-digit growth in exports to the U.S.
-
Growth outpacing exports to most other partners
-
Strong demand for nickel-based and cocoa-based exports as well
This momentum provides a solid base for entering the 2025–26 period.
Risks and Vulnerabilities for 2025–26
Indonesia’s export outlook is positive but not without risks. Several challenges could influence performance in 2025–26.
1. Tariffs and U.S. trade policy shifts
The U.S. has shown willingness to revise tariff structures in several sectors. Any shift targeting:
-
palm-oil derivatives
-
rubber products
-
electronics components
could dampen export growth.
2. Commodity price volatility
Palm oil, rubber, and metal prices can swing sharply based on global supply and weather conditions. Because these sectors form a meaningful share of exports, price fluctuations affect export revenue even when volumes remain stable.
3. Competition from other exporting countries
Key competitors include:
-
Malaysia (palm-oil derivatives)
-
Vietnam (footwear and electronics)
-
Thailand (rubber products and components)
-
China (electronics)
Indonesia must maintain cost efficiency and quality to stay competitive.
4. Environmental and sustainability regulations
Palm oil and rubber face increasing scrutiny, especially from Western buyers. Tougher sourcing standards or sustainability requirements could raise compliance costs for Indonesian exporters.
Detailed Forecast for Indonesia’s Exports to the US (2025–26)
Based on known data from 2024–2025 and trends in U.S. demand, here is a structured forecast for 2025–26.
2024 Estimated Benchmark
Exports to the U.S.: USD 26–28 billion
2025 Expected Range
Exports to the U.S.: USD 28–30 billion
2026 Projection
Exports to the U.S.: USD 30–36 billion
Below is a scenario breakdown.
Baseline Scenario (Most Likely)
Exports reach USD 28–30 billion in 2025, rising to 31–33 billion in 2026.
Drivers:
-
steady U.S. demand for manufactured imports
-
moderate growth in footwear, rubber, and electronics exports
-
stable commodity prices
-
improved Indonesian production capacity
This assumes no major disruption in trade policy or shipping.
Optimistic Scenario (High Global Demand + Strong Manufacturing Growth)
Exports reach USD 30–33 billion in 2025 and 33–36 billion in 2026.
What pushes growth:
-
Faster expansion of Indonesia’s electronics and machinery sector
-
Stronger U.S. consumer demand
-
Higher palm oil and rubber prices
-
A larger share of U.S. imports is captured from competitors like Vietnam and Malaysia
This scenario also assumes improved trade and stable global economic conditions.
Downside Scenario (Tariffs or Global Slowdown)
Exports stagnate at USD 25–27 billion in 2025 and 24–26 billion in 2026.
Triggers:
-
New U.S. tariffs on key Indonesian goods
-
Drop in commodity prices
-
Global recession or slowdown
-
Weakened demand in U.S. manufacturing
-
Sustained trade disruptions
While possible, this scenario requires a combination of several negative events.
Key Indicators to Watch in 2025–26
To understand how the export relationship may evolve, watch these variables:
-
Monthly Indonesia export data, especially non-oil and gas categories.
-
US import data for footwear, electronics, and rubber goods.
-
Commodity prices for palm oil and natural rubber.
-
U.S. tariff or regulatory changes affecting agricultural & manufactured imports.
-
Investments in Indonesia’s manufacturing sector.
These indicators will signal how closely reality tracks the forecast.
Conclusion and Final Thoughts
Indonesia’s export relationship with the United States has strengthened over the past decade. From 2015 through 2025, Indonesia transitioned from commodity-heavy exports to a more balanced mix that includes higher-value manufactured goods. By 2024, Indonesia exports to the U.S. reached around USD 26–28 billion, and early 2025 data shows strong momentum, with growth outpacing other major destinations.
Looking ahead to 2025–26, Indonesia is well-positioned to achieve:
This outlook assumes stable global conditions, steady U.S. demand, and continued Indonesian efforts to expand manufacturing capacity. Even with risks such as tariffs, competition, and trade challenges, the long-term trajectory remains positive. Indonesia’s blend of resource strength and steadily growing industrial capability gives it a robust foundation for sustained export growth to the U.S.
We hope that you liked our insightful blog report on the Indonesia exports to US & US-Indonesia trade relations 2025. For more insights into the latest Indonesia import-export data, or to search live import-export data by country, product, or HS code, visit TradeImeX. Contact us at info@tradeimex.in for customized trade reports and market insights.
Disclaimer: TradeImeX provides global trade database, including import-export data of 100+ countries and customized data report. We do NOT buy or sell any products. For purchasing or selling inquiries, please contact the actual importers/exporters listed in our database reports.