It’s not the Premier League table Manchester United sit at the summit of
Fasika Zelealem Senior Sports Reporter
09:00, 03 Jan 2026Updated 09:12, 03 Jan 2026
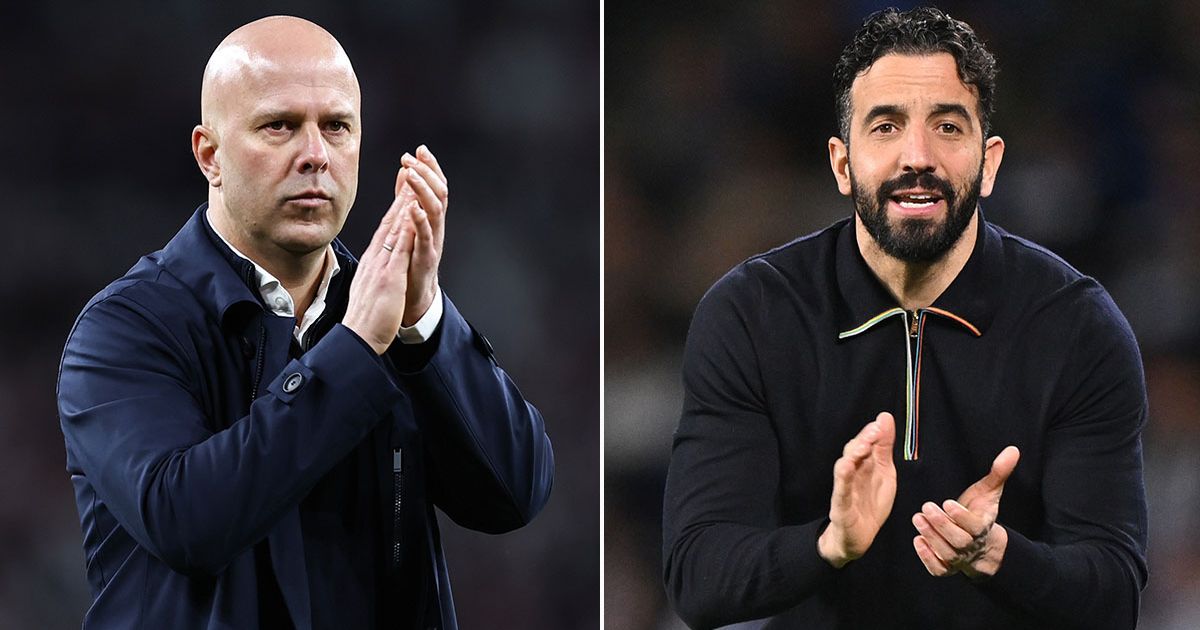
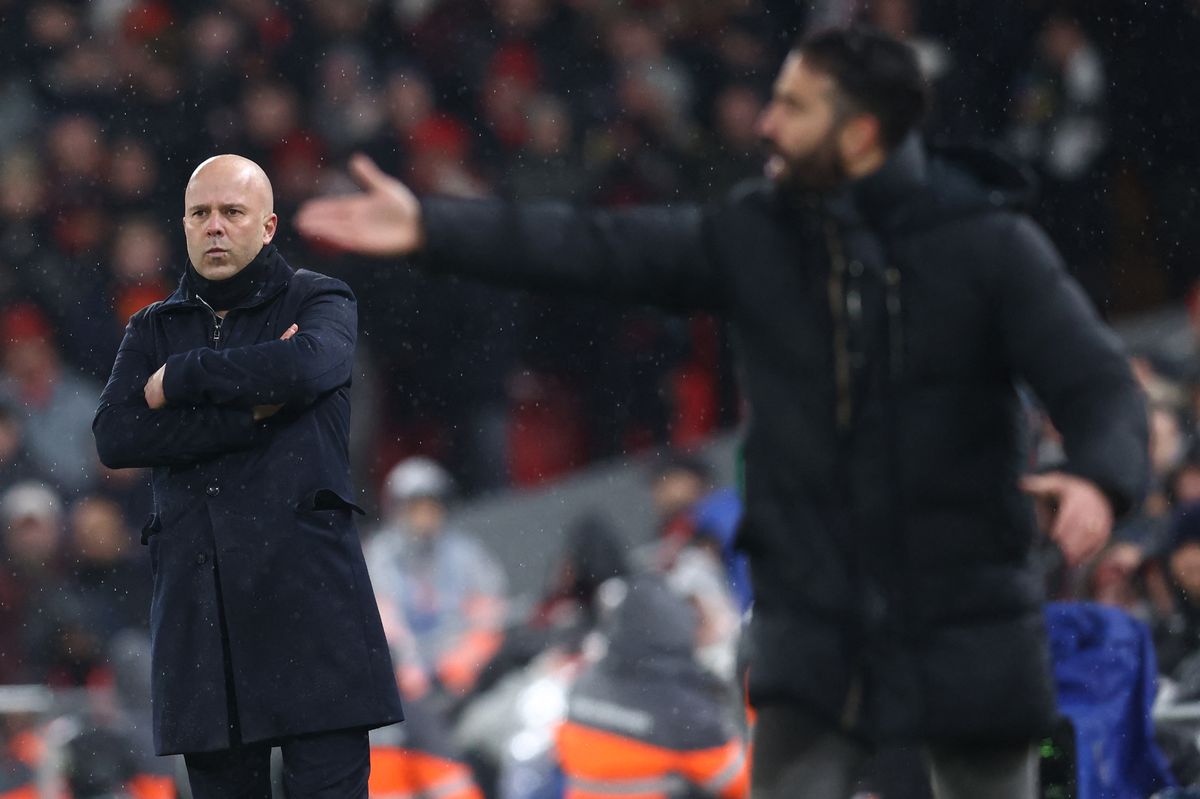 Arne Slot and Ruben Amorim splashed the cash last summer(Image: DARREN STAPLES/AFP via Getty Images)
Liverpool’s £450million transfer outlay last summer has done little to interrupt Manchester United‘s top position when it comes to net spend for the past five years. Net spend – which is defined as “transfer fees spent on acquiring players minus transfer fees received on moving players out” – is a term that is routinely bandied about in football.
The Red Devils are regular big spenders in the transfer window and routinely rank among the biggest recruiters in world football. However, their sizeable expenditure is rarely matched by profit earned from outgoings – quite the contrast from the current Premier League champions.
It’s closing in on 13 years since United last captured the Premier League crown but a five-year span beginning in the summer of 2021 has Ruben Amorim’s side as the undisputed leader of the net spend table.
Their total net spend has come to £-684.61million, which is just -£10m less than second-place Arsenal who’ve accrued a figure of £-675.77m. It’s Chelsea up next with the Blues’ net spend total coming in at £-662.04m, as despite spending over £1bn since Todd Boehly’s arrival, they’ve earned huge transfer fees from outgoings in recent years
Tottenham Hotspur are the next club up with their net spend total in the last five years totalling £-569.24m despite their last top four finish coming in the 2021/22 season. That was coincidentally their lowest net spend total across the five-year span.
READ MORE: Man Utd make surprise transfer decision as Ruben Amorim U-turns on youngsterREAD MORE: Man Utd boss Ruben Amorim gets mixed news from AFCON over Bryan Mbeumo and Amad
Rounding out the top five is Newcastle United with a total of £-430.61m – a figure that was certainly bolstered last summer by the British record £125m sale of Alexander Isak to Liverpool. The Reds’ position of sixth on this list with a £-426.77m net spend certainly calls to their cleverness when it comes to arrivals and outgoings.
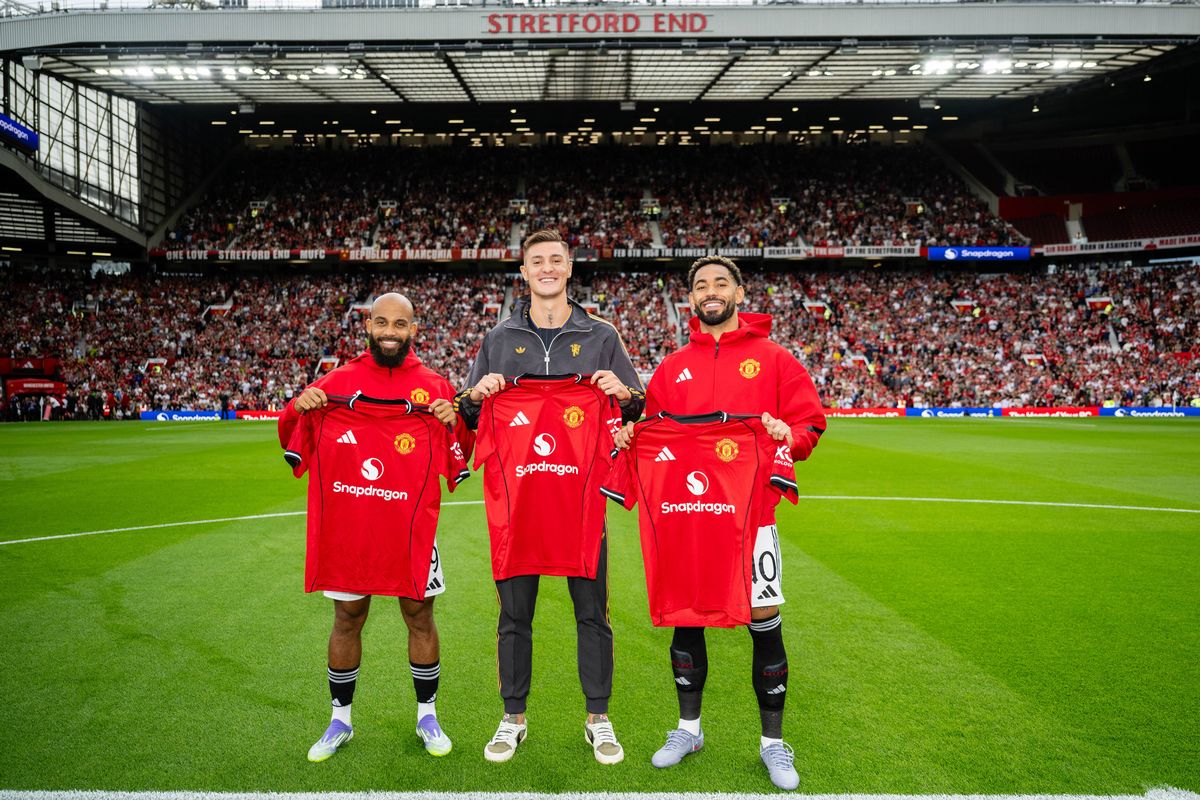 Ruben Amorim transformed his Man United attack with Bryan Mbeumo, Benjamin Sesko and Matheus Cunha(Image: Ash Donelon/Manchester United via Getty Images)
In their maiden Premier League title win in the 2019/20 season, Liverpool actually boasted a positive net spend of £29.14m that campaign, given Takumi Minamino’s £7.25m signing in January was their biggest across the summer and winter windows.
Their figure of £-228.6m this past summer tells a different story in what was their biggest transfer window ever, and by some distance. The club broke their record transfer twice, first with the £100m acquisition of Florian Wirtz and again a month later by signing Isak.
Sky Sports discounted Premier League and EFL package
This article contains affiliate links, we will receive a commission on any sales we generate from it. Learn more
£43
£35
Sky
Sky has slashed the price of its Essential TV and Sky Sports bundle ahead of the 2025/26 season, saving members £192 and offering more than 1,400 live matches across the Premier League, EFL and more.
Sky will show at least 215 live Premier League games next season, an increase of up to 100 more.
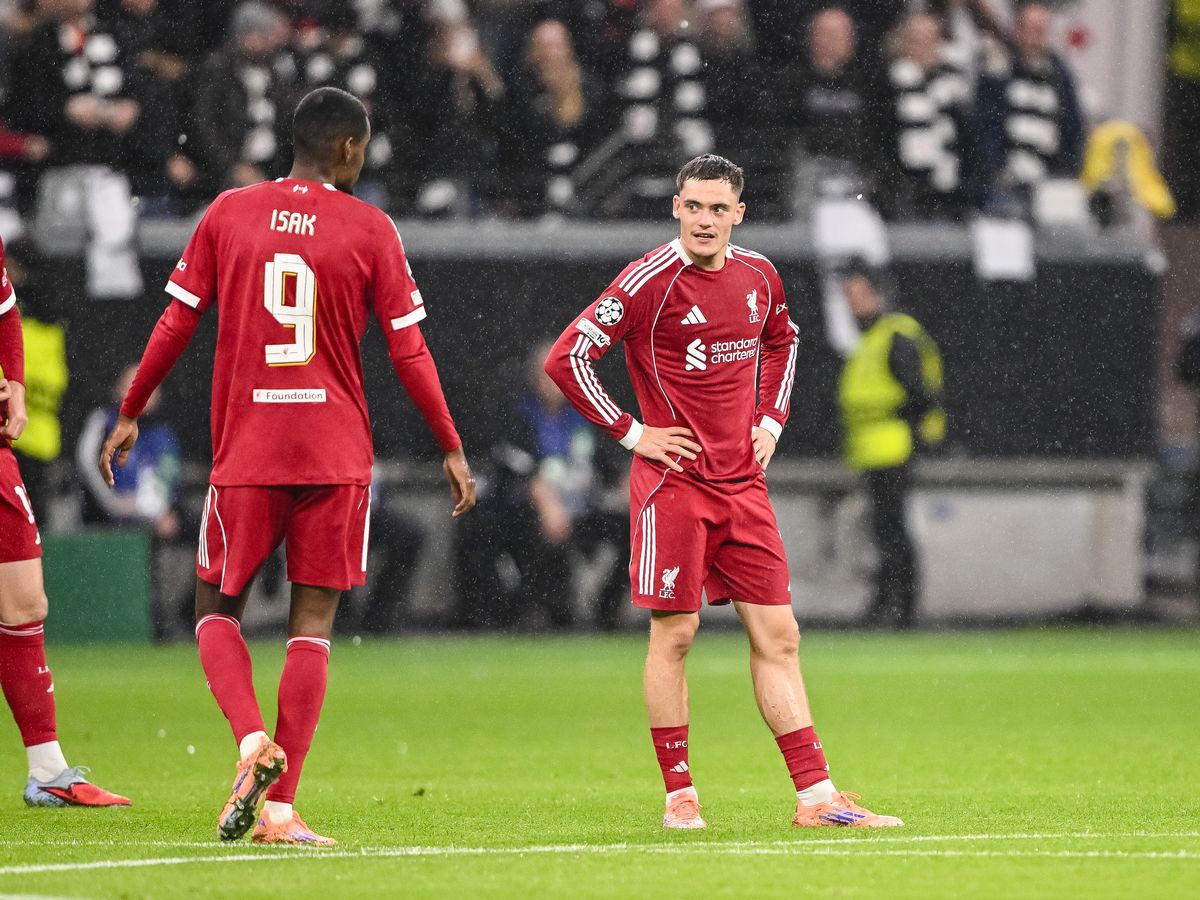 Liverpool broke their club-record transfer twice last summer on Florian Wirtz and Alexander Isak
In the case of United’s £-154.34m figure last summer – their second-highest total for five years – a majority of their transfer dealings were built around transforming their forward line. Almost £200m was spent on acquiring Matheus Cunha, Bryan Mbeumo and Benjamin Sesko.
1) Manchester United five-year net spend: £-684.61m
25/26: £-154.34m24/25: £-112.89m (15th)23/24: £-128.48m (8th)22/23: £-191.94m (3rd)21/22: £-96.97m (6th)
2) Arsenal five-year net spend: £-675.77m
25/26: £-246.26m24/25: £-20.81m (2nd)23/24: £-144.26m (2nd)22/23: £-141.39m (2nd)21/22: £-118.26m (5th)
3) Chelsea five-year net spend: £-662.04m
25/26: £-6.03m24/25: £-33.76m (4th)23/24: £-153.68m (6th)22/23: £-473.95m (12th)21/22: £31.16m (3rd)
4) Tottenham five-year net spend: £-569.24m
25/26: £-146.6m24/25: £-91.42m (17th)23/24: £-125.5m (5th)22/23: £-117m (8th)21/22: £-50.8m (4th)
5) Newcastle United five-year net spend: £-430.61m
25/26: £-89.94m24/25: £-17.73m (5th)23/24: £-85.79m (7th)22/23: £-141.69m (4th)21/22: £-108.17m (11th)
6) Liverpool five-year net spend: £-426.77m
25/26: £-228.6m24/25: £29.14m (Champions)23/24: £-92.26m (3rd)22/23: £-53.96m (5th)21/22: £-50.02m (2nd)
7) Manchester City five-year net spend: £-346.56m
25/26: £-118.61m24/25: £-87.75m (3rd)23/24: £-104.64m (Champions)22/23: £5.94m (Champions)21/22: £-37.38m (Champions)
8) Nottingham Forest five-year net spend: £-328.86m
25/26: £-97.28m24/25: £-15.58m (7th)23/24: £-42.28m (17th)22/23: £-167.48m (16th)21/22: £-5.07m (4th in Championship)
9) West Ham United five-year net spend: £-323.16m
25/26: £-47.22m24/25: £-82.6m (14th)23/24: £21.47m (9th)22/23: £-145.1m (14th)21/22: £-58.25m (7th)
10) Bournemouth five-year net spend: £-155.77m
25/26: £85.72m24/25: £-59.67m (9th)23/24: £-111.27m (12th)22/23: £-78.57m (15th)21/22: £10.08m (2nd in Championship)
11) Crystal Palace five-year net spend: £-145.95m
25/26: £15.31m24/25: £7.45m (12th)23/24: £-56.2m (10th)22/23: £-34.11m (11th)21/22: £-70.97m (12th)
12) Sunderland five-year net spend: £-121.19m
25/26: £-136.5m24/25: £5.41m (4th in Championship)23/24: £-1.54m (16th in Championship)22/23: £5.08m (6th in Championship)21/22: £-0.2m (5th in League One)
13) Fulham five-year net spend: £-119.55m
25/26: £-24.32m24/25: £-18.86m (11th)23/24: £-16.55m (13th)22/23: £-42.03m (10th)21/22: £-13.1m (1st in Championship)
14) Burnley five-year net spend: £-108.67m
25/26: £-80.96m24/25: £46.2m (2nd in Championship)23/24: £-90m (19th)22/23: £28.03m (1st in Championship)21/22: £-7.47m (18th)
15) Brentford five-year net spend: £-98.16m
25/26: £49.95m24/25: £-20.12m (10th)23/24: £-52.3m (16th)22/23: £-38.44m (9th)21/22: £-31.33m (13th)
16) Leeds United five-year net spend: £-75.4m
25/26: £-91.51m24/25: £109.47m (1st in Championship)23/24: £-1.95m (3rd in Championship)22/23: £-41.44m (19th)21/22: £-49.75m (17th)
17) Aston Villa five-year net spend: £-63.41m
25/26: £21.74m24/25: £39.54m (6th)23/24: £-65.44m (4th)22/23: £-38.25m (7th)21/22: £-2.32m (14th)
18) Wolves five-year net spend: £-48.92m
25/26: £11.5m24/25: £-7.11m (16th)23/24: £64.14m (14th)22/23: £-97.64m (13th)21/22: £-4.96m (10th)
19) Everton five-year net spend: £-12.13m
25/26: £-101.87m24/25: £28.17m (13th)23/24: £36.23m (15th)22/23: £21.7m (17th)21/22: £5.56m (16th)
20) Brighton five-year net spend: £2.28m
25/26: £57.71m24/25: £-191.58m (8th)23/24: £69.1m (11th)22/23: £70.82m (6th)21/22: £3.25m (9th)
Join our new MAN UTD WhatsApp community and receive your daily dose of Manchester United content from Mirror Football. We also treat our community members to special offers, promotions, and adverts from us and our partners. If you don’t like our community, you can check out any time you like. If you’re curious, you can read our Privacy Notice.