Fitness enthusiasts who want to track their health data generally rely on trackers from Fitbit and Garmin. These devices provide accurate data and many insights to help improve one’s fitness and meet certain goals. By default, both Fitbit and Garmin trackers connect to your smartphone via a companion app where you can view all the essential data, like steps walked, calories burned, heart rate levels, sleep patterns, etc. While that’s a decent way to go about it, what if I told you there’s a much more efficient, useful, and visually pleasing way to track your progress?
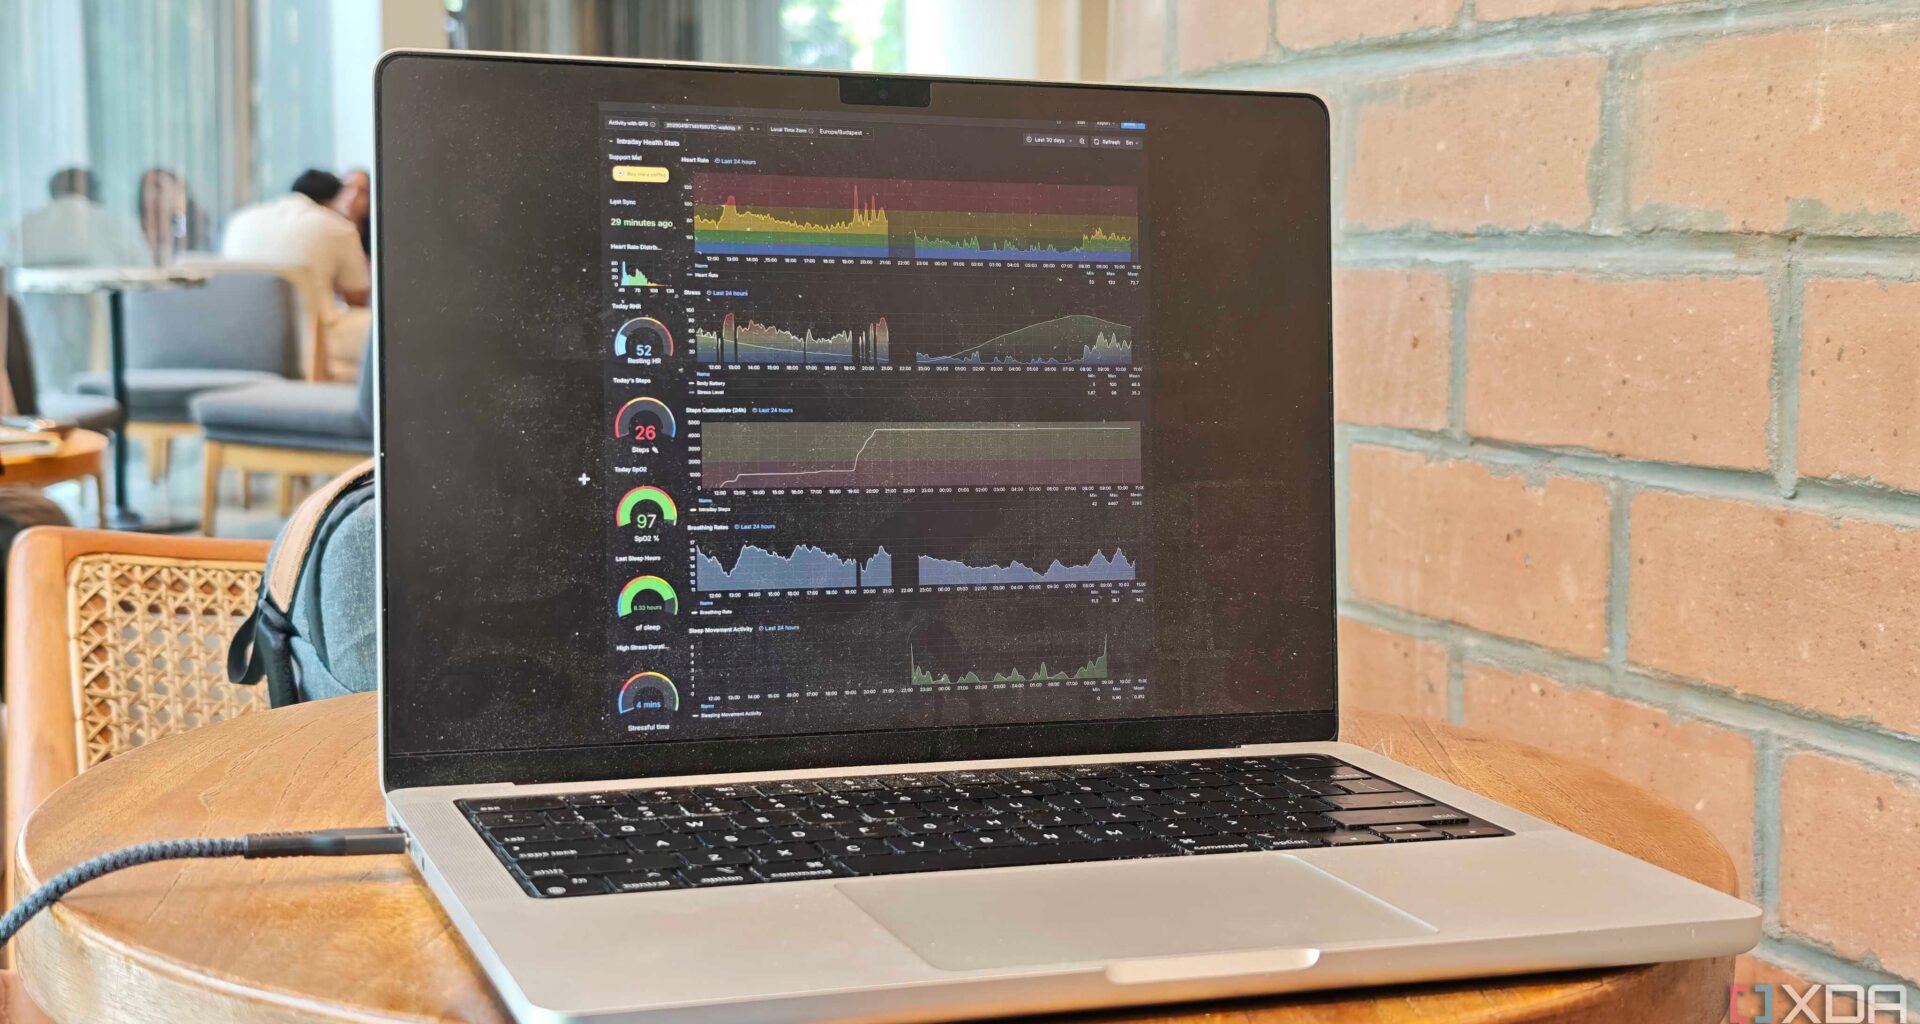
Enter Grafana — an open-source tool to visualize and analyze your data with the help of graphs, charts, alerts, and dashboards. It can pull data from databases, cloud services, and other similar platforms to track metrics, logs, and performance. So, how is it related to fitness data, you ask? Well, two sister projects on GitHub by Arpan Ghosh, titled Fitbit Health Dashboard and Garmin Grafana, allow you to fetch your health metrics from Fitbit’s and Garmin’s servers and visualize them by creating beautiful dashboards that bring your data to life! The metrics are much more comprehensive than what you see on companion smartphone apps, making it the perfect alternative for those obsessed with analyzing numbers and raw data. Here’s why you need to check it out now.
Related
Glance is a beautiful, self-hosted dashboard that I’ve already set as my web browser’s home page
All the important information at a glance
What exactly does the project do?
Why does it stand out?
Both projects are exactly similar, except they use different sources to fetch your health data. The Fitbit version has a script that fetches your health data once you enter your Fitbit account’s credentials, while the version for Garmin smartwatches uses Garmin Connect. Once the data is fetched from those servers, it is stored locally in an InfluxDB database. This data is then fed to Grafana for visualization. The idea is to set up a localized solution that can be self-hosted and is completely open source, unlike the official apps from these brands.
If you’re wondering, the visualization supports pretty much every data point you can think of. Steps, calories, sleep, heart rate, SpO2, GPS activity, etc. While the official app also logs this data, you can only view metrics for a day or a week at once. On the other hand, this Grafana project lets you view and compare data from months, giving you a better idea of your progress over a long period. This level of data can also be used to estimate your progress in the coming weeks and months.
Why should you use the Grafana dashboard?
Comprehensive data and security
For starters, the entire setup is containerized, so you need to use Docker to set up the dashboard. This means you can set it up on your local server or even a Raspberry Pi. It’s designed to run automatically, so as long as it’s connected to a network, it fetches data from Fitbit or Garmin servers at regular intervals and updates the graphs. This localized approach ensures your data remains safe. You can even backup the entire data locally, if you don’t want to rely on Fitbit’s servers.
Apart from privacy, the standout aspect of using a dashboard like this is the endless customization. When using the app, you’re limited to all the visuals Fitbit or Garmin provides by default, and nothing more. However, Grafana works differently. You can build your own graphs to compare heart rate levels when walking, sleep patterns over a month, SpO2 levels when you’re asleep vs. when you’re awake, and a log of GPS coordinates when running. It’s almost like an empty canvas on which you can paint any graph or chart of your choice.
Some users like visualizing a year’s data to track their progress. You’ll have to spend hours doing that on the mobile app while swiping through data ranges. A dashboard like this gives you access to older data without any digging around. Moreover, all of this data can be exported to LLMs if you want AI to analyze your data for you and give you trends.
Setup can be slightly daunting
It’s worth the effort
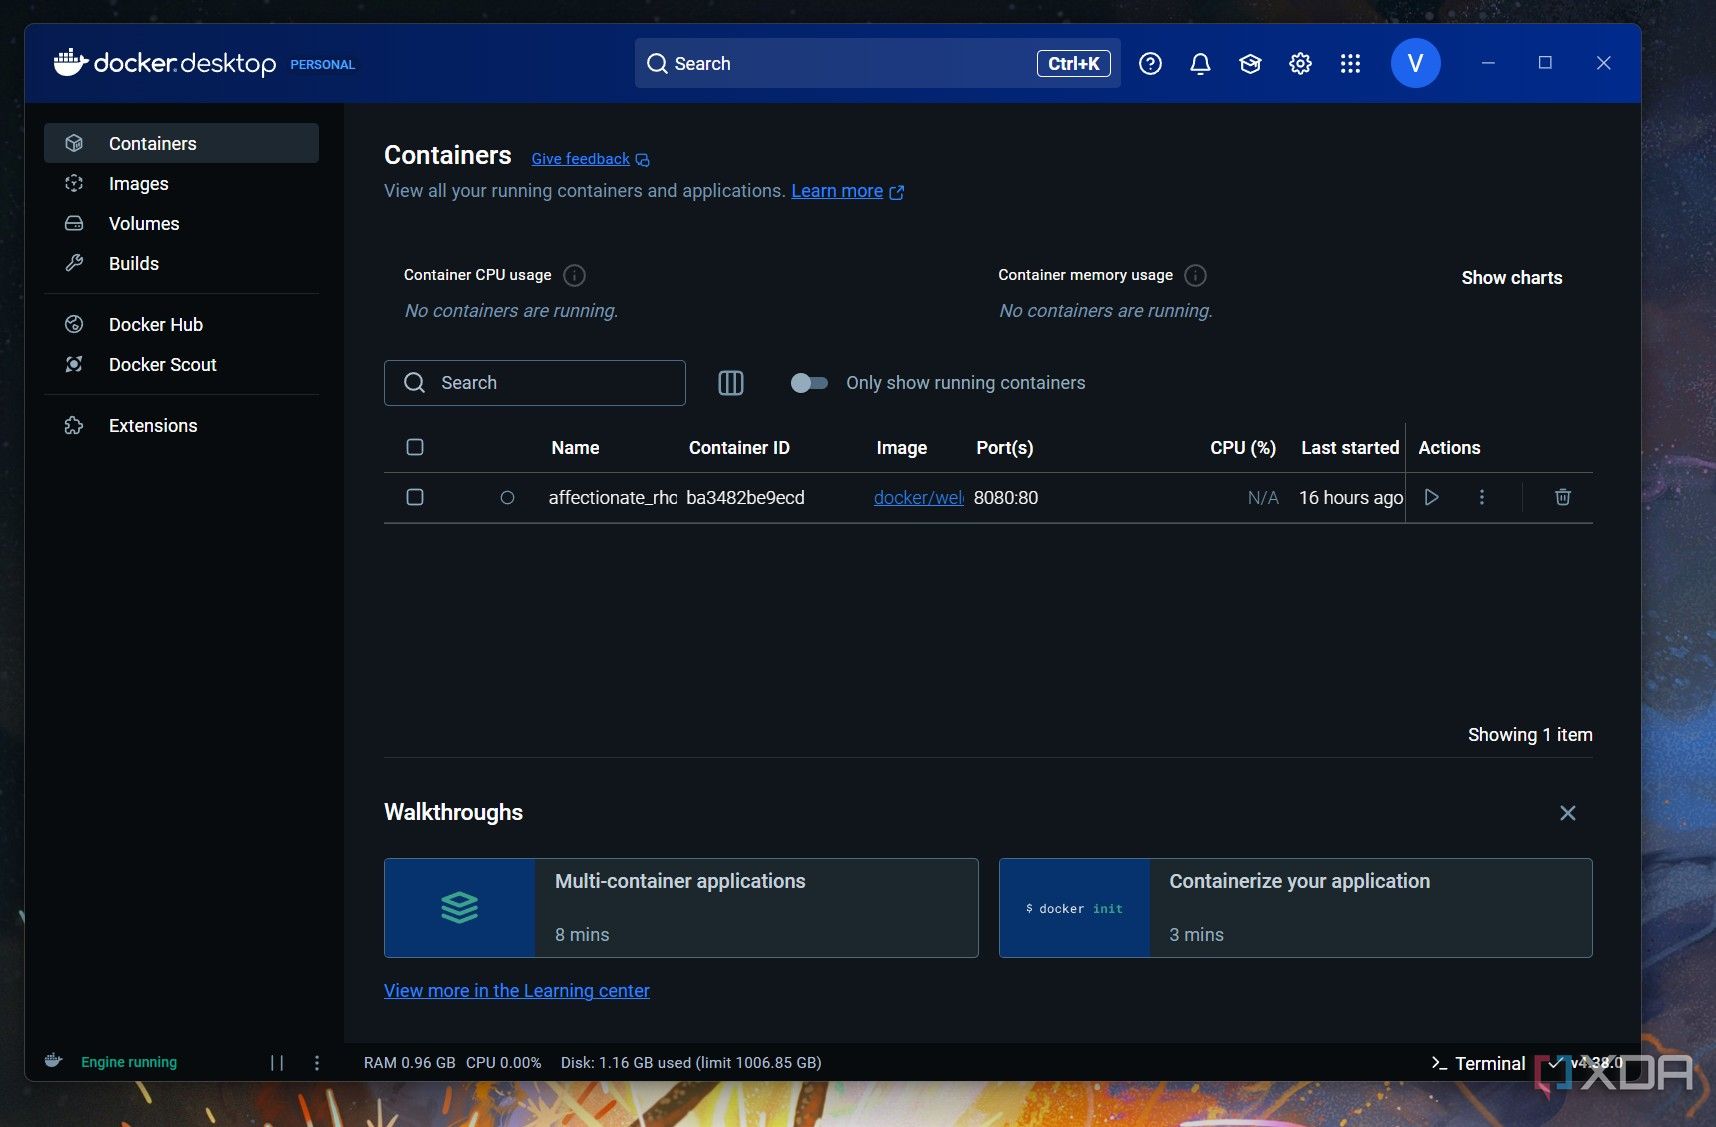
There’s no doubt that the Grafana dashboard to track your health metrics is super cool and futuristic. However, setting it up before you can enjoy the beautiful visualization can be a pain for some users. You will need Docker, InfluxDB, and Grafana to run the dashboard. Then, you’ll have to get your hands on your Fitbit or Garmin API credentials to fetch data automatically. This includes a client ID, client secret, and refresh token.
You need to then feed this data into the included script. Finally, run the Docker stack to launch the containers. Once done, you can access Grafana and use InfluxDB as the data source. Thankfully, the included Readme file has troubleshooting tips if you get stuck. If you’ve used Docker before, the process shouldn’t be as intimidating.
I’ve never seen a better visualization of data
If you love going through heaps of data to analyze it and notice trends, you’re absolutely going to love the Grafana dashboards for both Fitbit and Garmin smartwatches. Unlike the accompanying smartphone apps from both brands, this dashboard takes a long-term approach where you can view your data spread across a larger range, instead of focusing on short-term progress. Moreover, all the visually appealing elements make the experience of viewing the data more fun as opposed to seeing a bunch of random numbers and stats.

Related
5 must-have dashboards for self-hosted apps on a headless Raspberry Pi
Use a dashboard to monitor, and track self-hosted apps when running them on a Raspberry Pi without a graphical interface.