
The impacts of recently-imposed U.S. tariffs (and broader economic uncertainties) are starting to show up in the Canadian economic data. What is likely to come as little surprise, Canada’s trade-sensitive sectors are underperforming the less exposed parts of the economy across a variety of metrics. What’s more, within these trade-sensitive areas, Canadian industries that have been hit by the steepest U.S. tariffs – notably steel – have struggled the most in the data released to date.
This report provides a status update on these measured tariff effects. But before we look under the hood of the datasets, there are a few points of caution:
- It remains in the early days to reach any major conclusions on tariff effects. We only have a few months of trade and industry-based GDP data (and in the case of employment, a richer four months) to examine. Tariff impacts will likely play out over many months and even years.
- The tariff landscape has been shifting frequently, and the ultimate end-state remains quite uncertain.
Canadian Exports Are Getting Squeezed
Let’s kick off with the merchandise export data, which provide impacts through to May. Here, tariffs have left a big mark so far, but more in the form of data volatility. U.S. importers were quick to front-run the imposition of tariffs, spending several months stockpiling Canadian goods at rapid pace. These forward purchases pushed up exports to the U.S. sharply in Q4-2024 and Q1-2025. By March, however, trade volumes with the U.S. began reversing course, suggesting that tariff related front-running was losing steam, and by April, Canada recorded its widest monthly trade deficit on record as it faced the full suite of American tariffs.
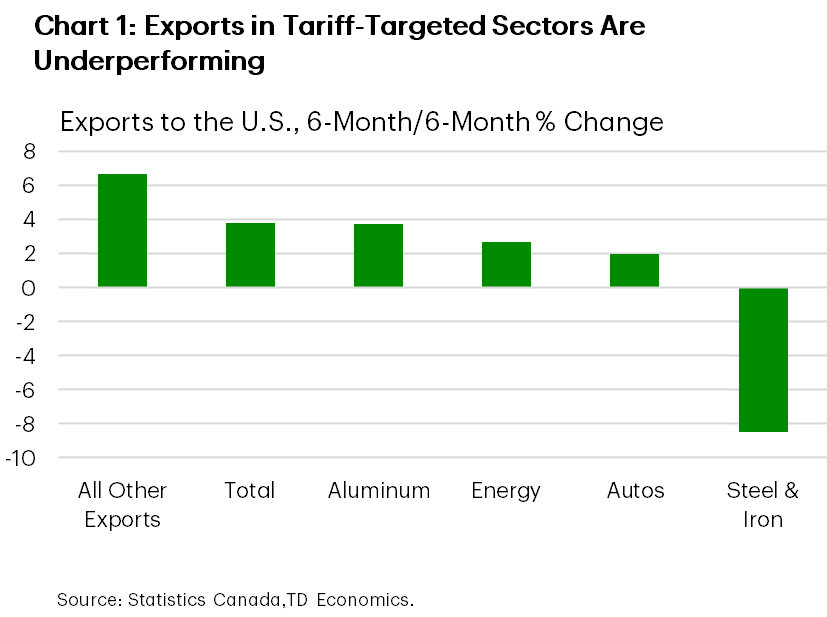
For this analysis, we have calculated average export levels over the past 6 months to smooth out the impacts from tariff front-running. Chart 1 shows the change in export levels relative to the prior half-year period.
Overall, export levels remain above the pre-tariff period, almost 4% higher, suggesting some room for further reversal over the coming months. Among the export areas, Canadian industries facing tariffs under Section 232 have generally been underperforming. Export values of aluminum have held up best so far, supported by sharply higher prices amid limited other sources of supply to the U.S. On the flip side, steel, which was among the first to get targeted by tariffs, has suffered the worst performance.
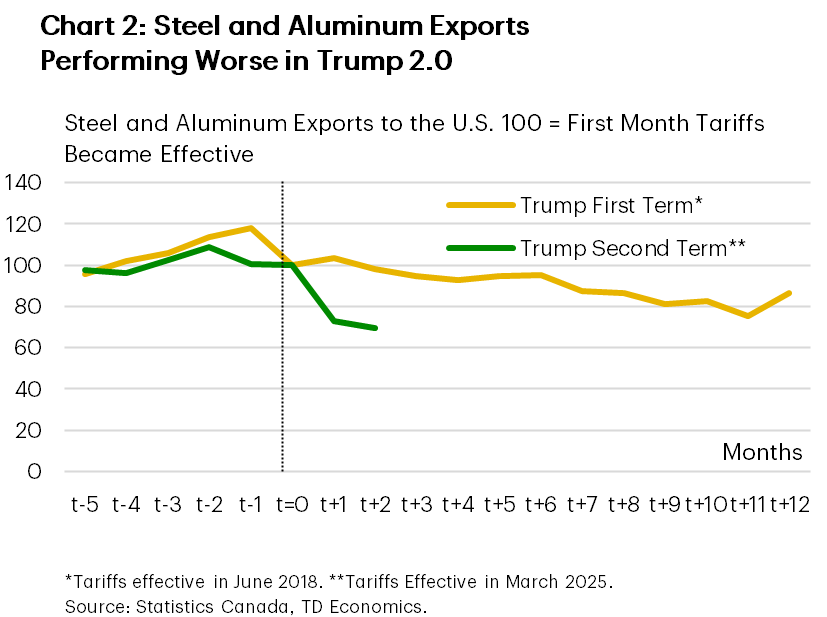
The steel and aluminum industries could face a tougher road ahead, not least since tariffs have since doubled to 50%. The U.S. targeted these industrial metals at a lower rate during the 2018 tariff episode (25% on steel and 10% on aluminum). Relative to the month tariffs became effective, combined steel and aluminum exports in 2025 are declining at a faster rate than in 2018 (Chart 2).
Elsewhere, Canada’s energy exports have not been significantly affected so far by tariffs. Energy has faced a lesser 10% tariff rate, and since May, the lion’s share of energy exports have qualified for an exemption on tariffs as they are USMCA compliant. The energy sector’s subdued export performance in recent months is more attributable to the moderation from the robust shipping volume growth in 2024 on the back of the Trans Mountain Pipeline Expansion (TMX). Meanwhile, Canada’s automotive exports recently plunged to late-2022 levels as tariffs took hold in April. Factoring in front-running earlier this year leaves auto exports up a modest 2% relative to the prior 6 months (and down sharply relative to year-ago levels as of May). Canadian automakers have since slashed production as they deal with trade challenges.
Within the “all other” category, U.S. nominal exports have held up strong thus far. Non-compliant goods shipments under the USMCA trade agreement are still subject to a 25 % tariff rate (a full tariff exemption is granted for compliant goods). Less than 40% of southbound shipments carried compliance status before Trump took office, but that share has now risen to 60% as Canadian businesses fast-track their product-compliance processes. Aside from oil and gas, the category of nonferrous metals & processing (excluding aluminum) is also seeing a notable uptick in compliance, while motor vehicles and parts now sit at over 80% compliant.
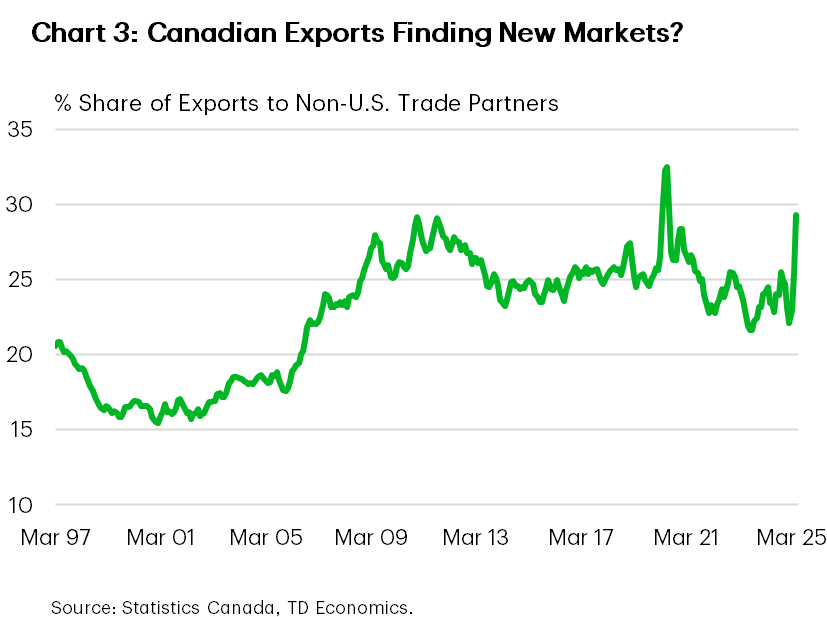
Chart 1 paints a picture of some tariff resilience, but it may not be telling the whole story. Canadian businesses are working to reorient supply chains, with some evidence suggesting that the country making use of alternative Free Trade Agreements (FTAs) outside of the USMCA. Over the past four months, exports to non-U.S. markets have ramped up to over 30 %, a level never achieved outside of the trade distortions seen during the early days of the pandemic (Chart 3). A multi-month surge in unwrought gold exports to the UK has made a decent contribution to the rise. But even stripping out this effect, modest increased exports to places like the EU and Japan have helped Canada slowly diversify away from the U.S. As a result, the share of Canadian exports to the U.S. has slipped to below 70%.
GDP Growth Impacts and Considerations
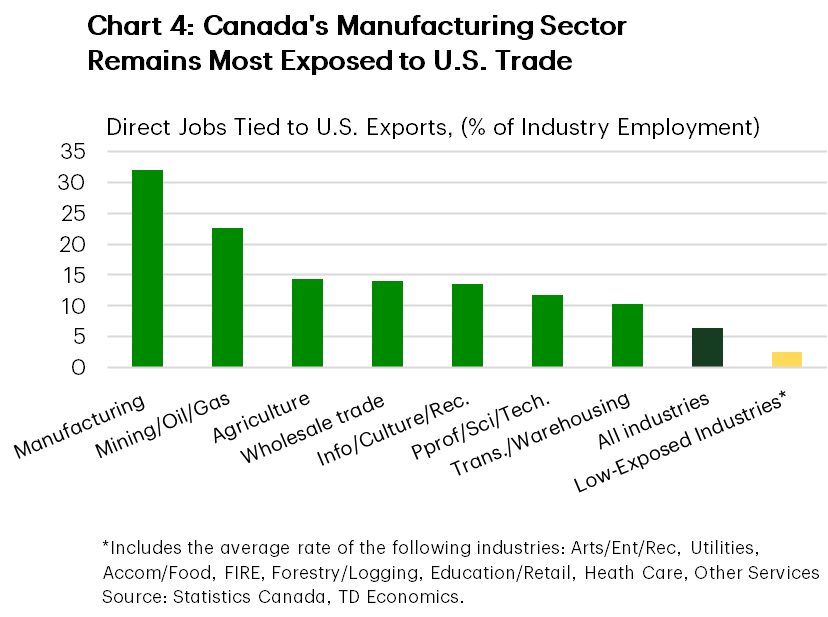
Turning to the production side of the economy, we’re also receiving some early signs of impacts in highly exposed sectors. A benefit of this real GDP by industry is that it is measured in real terms (i.e., removes the effect of price changes). However, the GDP data are only available through April. We characterize high exposure as industries whose direct jobs embodied in exports to the U.S. exceed 10% of total of employment (Chart 4). Economic activity in these trade-sensitive sectors account for roughly one-third of national output, with manufacturing, energy and the agriculture sectors among the most exposed.
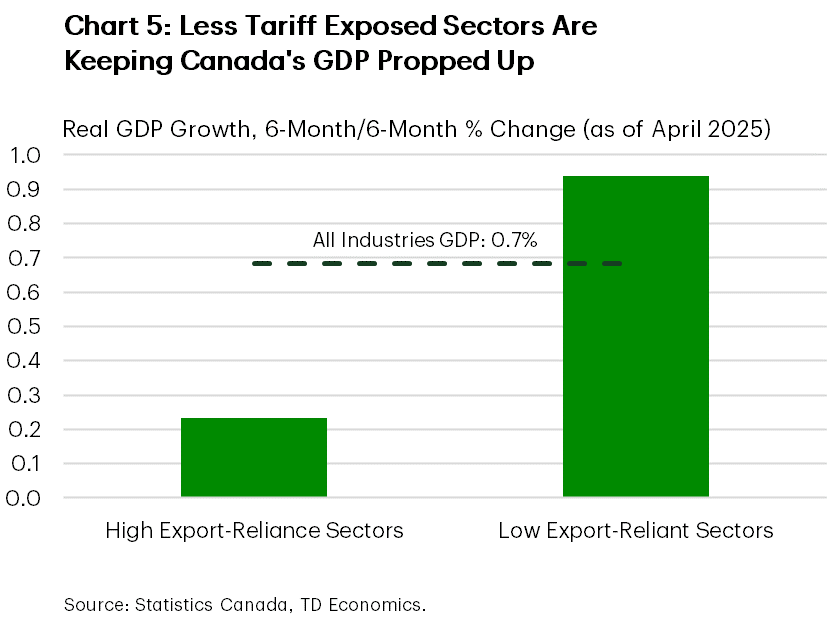
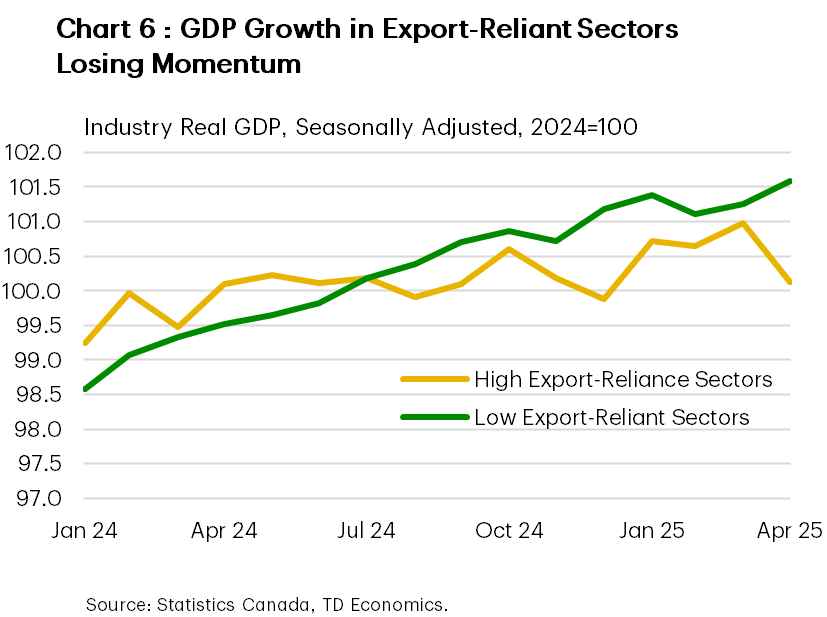
Despite the U.S. importing at an expedited pace earlier this year, real GDP in highly trade-exposed industries is still underperforming the rest of the economy. Chart 5 illustrates the recent divergence in activity. Canada’s economy as a whole is still growing below a trend pace relative to the 6-months prior, with more tariff-insulated sectors expanding at around 1% vs the barely positive growth rate in more exposed industries. Early guidance for May GDP growth indicates another contraction largely on the back of further declines in some tariff-impacted industries. Chart 6 highlights that the tariffs have only extended the challenges faced by some trade-exposed sectors, which has been essentially stagnant since mid-2023.
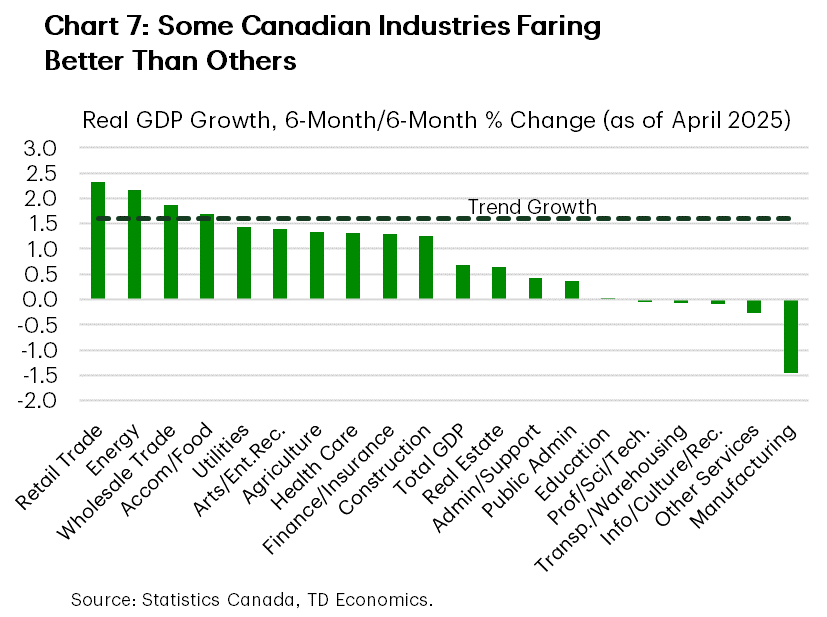
The manufacturing sector has been the clear laggard in this group, contracting by roughly a percent and a half so far this year. At almost 10% of the economy, this sector alone shaves over a tenth of a percentage point off headline growth. Transportation equipment manufacturing has been hit particularly hard as car manufacturers pulled back on production in response to tariffs. For what it’s worth, GDP in other tariff-exposed industries has been holding up well so far, especially the oil and gas and wholesale trade sectors that have made solid contributions to top-line GDP. Chart 7 shows the handful of other industries, namely retail trade, food/accommodation, and other services industries that are still growing at a decent pace, reaffirming the story of resilience.
The Labour Market Is Bending, But Not Broken
The jobs data are probably the best readily-available indicator of tariff impacts. They are timelier than both trade and GDP data, with figures released through June. But also, the most pronounced economic effects of the tariffs to date are likely through the uncertainty channel. And hiring decisions tend to be driven in part by sentiment.
We’d still argue that when taken altogether, the labour market is performing better than early-year expectations. Employment growth is effectively humming along at a trend pace and the unemployment rate, while still elevated, has steadied around 7.0%. The path forward however is a little less clear, especially as we see pockets of strain in trade-exposed industries (measured using the same framework as for GDP).
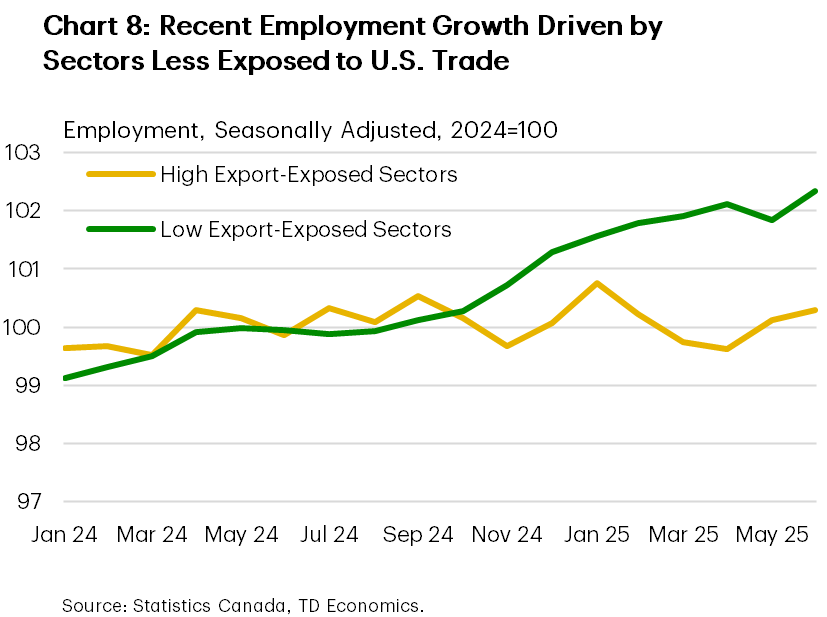
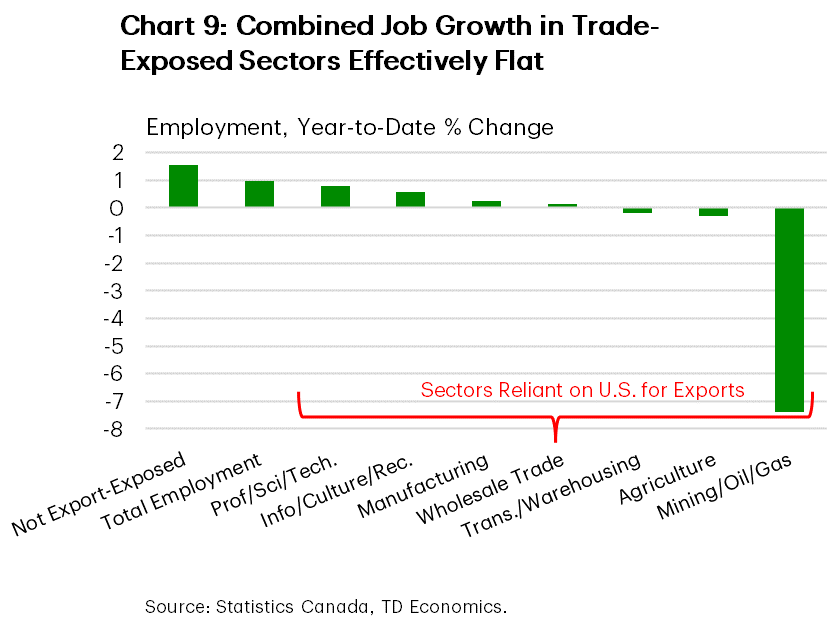
Charts 8 makes it clear that a majority of employment gains in Canada in recent months have been driven by more tariff-insulated sectors, notably on the services side of the economy. Of the ~265k jobs created since Trump won the presidency last November, highly export-exposed industries accounted for less than 5% of the gain. Of note, the energy, transportation and warehousing, and agriculture sectors have experienced outright job loss on a 6-month/6-month basis, while manufacturing and wholesale job growth has flat-lined (Chart 9).
The near-term outlook for job growth remains suppressed as companies look for clarity around tariffs for production planning purposes. In fact, only one-third of Canadian firms expect to hire over the next 12-months, as per the most recent Business Outlook Survey (BOS). Likewise, consumers in the Bank of Canada’s companion Canadian Survey of Consumer Expectations (CSCE) who work in trade-reliant sectors continue to report a higher-than-average probability of losing their job. What’s more, those that lose their jobs are also taking longer to find work, a sign that the Canadian labour market may be loosening in response to the imposition of tariffs.
Bottom Line
This status update has uncovered some evidence of tariff impacts in industries where exposure is the highest, notably steel and other industries targeted by the U.S. under Section 232. Looking ahead, forecasters (and the BoC) will be laser focused on whether these effects are deepening, and perhaps more importantly, bleeding through to industries with little exposure.
The analysis is limited by the relatively short timeframe examined. However, we would argue that the biggest data gap is currently around investment. Capital spending is the one area that is likely to be the most adversely affected by tariff uncertainty. And this is concerning since this capital spending trends ultimately dictate the path of output, trade and employment over the longer run. The BoC’s BOS highlighted that uncertainty is causing firms to hold off new investment plans, instead focusing on routine maintenance. For harder data, we’ll need to await Q2 GDP data at the end of August and public and private investment intentions in early 2026.
Finally, confidence in Canada’s export sector is unlikely to promptly turn even if there is a trade deal reached with the U.S. in the coming weeks. Perhaps the best opportunity for a near-term confidence boost is the upcoming fall federal budget that could lay out an economic roadmap for Canada’s economic transformation.