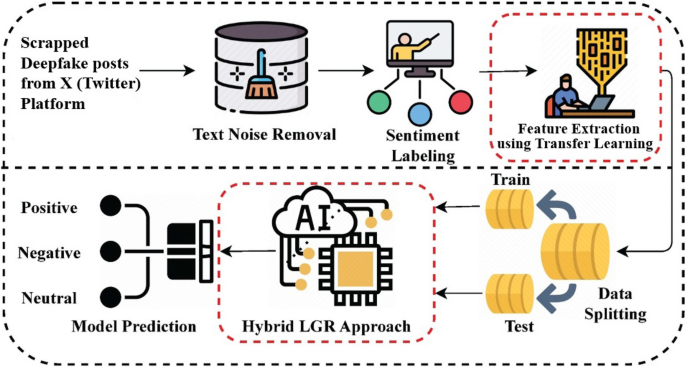
This section describes the outcomes of several ML and DL models for deepfake posts’ sentiment analysis. All these models are tested on a large dataset that is scrapped from X (Twitter). The dataset labeling is performed using TextBlob into positive, negative, and neutral classes. Feature extracting techniques are employed, such as BoW, TF-IDF, word embedding, and a novel TL feature extraction. The performance of diverse ML and DL models is evaluated using a range of metrics. The k-fold cross-validation is also performed to verify the results of different models. All the models are fine-tuned using hyperparameter tuning.
Experimental design
The experimental design includes the implementation of models using Python programming language with libraries including NLTK, TextBlob, Sklearn, Keras, Pandas, Numpy, TensorFlow, Matplotlib, and Seaborn, among others. Experiments are conducted using the Google Colab platform. Table 3 describes the environment used to conduct the experiments.
Table 3 Details of the experimental setup.Outcomes using BOW features
The performance comparison of different ML models with BoW features is represented in Table 4. The results represent that LR performs remarkably better than other models with an 87% accuracy. This model also scores well for other parameters like precision, recall, F1 score, geometric mean, Cohen Kappa score, ROC AUC score, and Brier score because LR can quickly deal with high dimensional data and prevent overfitting. The DT and KNC models’ performance is poorer than the LR model with a 78% and 64% accuracy, respectively. The SVM performs poorly with a 43% accuracy due to its computational complexity and data sensitivity issues.
Table 4 Outcomes of ML techniques with the BOW feature.
Figure 5 shows the confusion matrix of different models like SVM, DT, KNC, and LR. The visual representation compares the performance of all these models using BoW features. The confusion matrix presents the correct and wrong predictions for these models. It shows that the LR gets the highest number of correct predictions, with 18,401 correct predictions and 2670 wrong predictions from a total of 21,071 predictions. The performance of DT is second to the LR model, with 16,457 correct predictions. On the other hand, the performance of SVM is the worst, with 11,947 wrong predictions and only 9124 predictions are correct. This comparison emphasizes the variations in the predictive accuracy of different models.
Fig. 5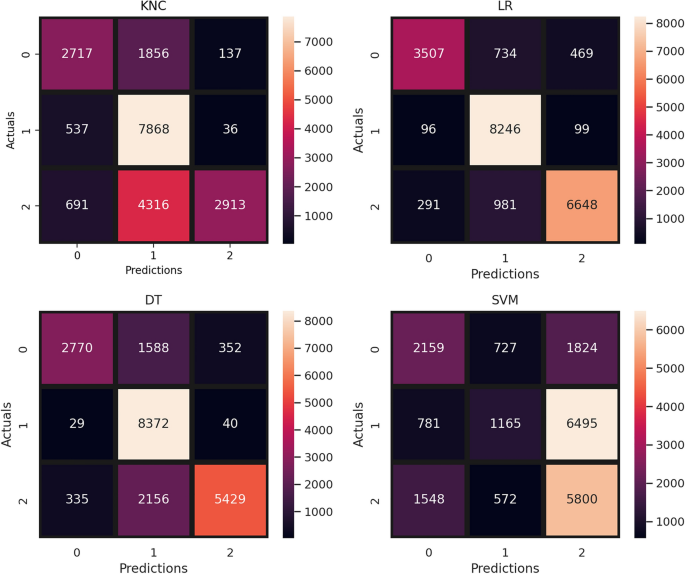
Confusion matrix of ML models with BoW feature.
The chart given in Fig. 6 illustrates the comparison of the performance of the ML model applied using the BoW feature. The graphical analysis demonstrates that LR and DT perform exceptionally well when used with the BoW features. Meanwhile, the KNC and SVM did not perform well and showed poor performance.
Fig. 6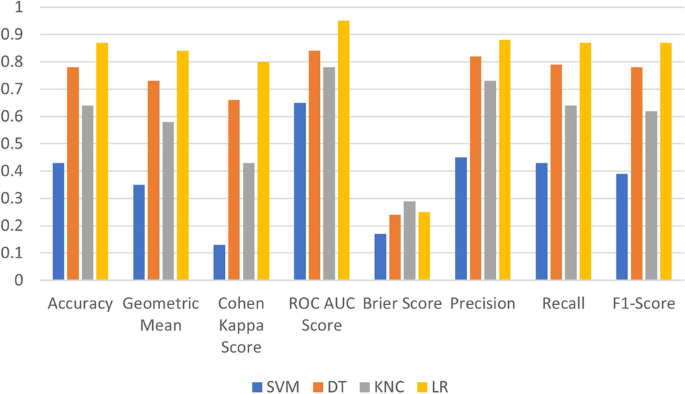
Performance comparison of ML models with BoW feature.
Outcomes with TF-IDF features
Table 5 presents the performance comparison of different ML models using the TF-IDF feature. Outcomes represent that the LR model performs better with an 81% accuracy score, while the DT performs marginally lower with an 80% accuracy. The KNC model shows poor results with 65% accuracy. On the other hand, the SVM model achieves a phenomenal 48% accuracy, showing minimal improvement compared to its performance with the BoW features.
Table 5 Outcomes of ML models with TF-IDF features.
The visual comparison in terms of the confusion matrix for different ML models using the TF-IDF feature is presented in Fig. 7. The confusion matrix demonstrates the correct and wrong predictions for each model. The results show that LR shows the highest number of correct predictions with 17,220 correct predictions and 3851 predictions are wrong. On the other hand, the performance of SVM is not very good, with the highest wrong predictions of 10,749, and the lowest correct predictions of 10,322 only. The confusion matrix shows that the LR is the most effective model for predicting correct sentiments.
Fig. 7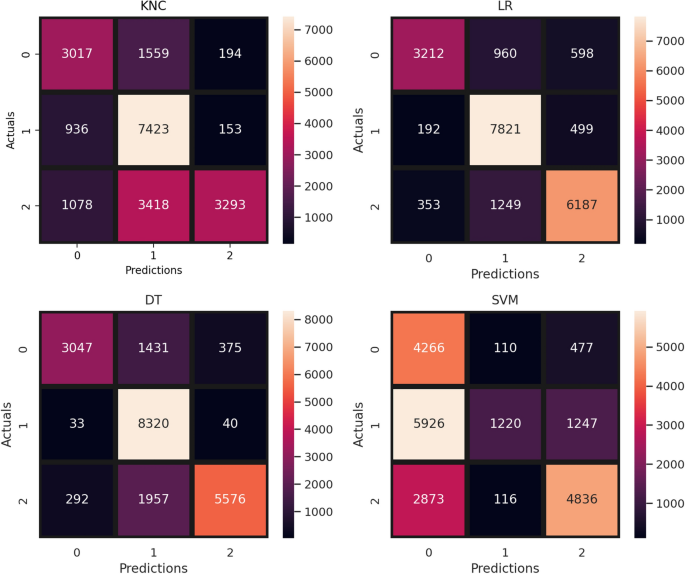
Confusion matrix of ML models with TF-IDF features.
Figure 8 represents the graphical comparisons of applied ML models with TF-IDF features. The visual comparisons demonstrate that LR and DT achieve the best performance, but the KNC and SVM did not perform well for sentiment analysis from X (Twitter) posts. The performance is evaluated using accuracy, geometric means, Cohen Kappa score, ROC AUC score, brier score, precision, recall, and F1 score.
Fig. 8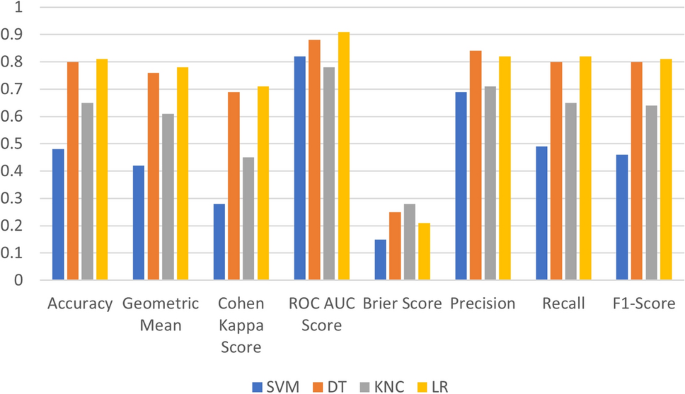
Performance comparison of ML models with TF-IDF features.
The bar chart in Fig. 9 represents the visual analysis of ML models’ performance using BoW and TF-IDF features. It can be observed that DT and KNC perform marginally well with TF-IDF features while SVM shows good improvement when used with TF-IDF features. On the other hand, LR models significantly well when used with BoW features.
Fig. 9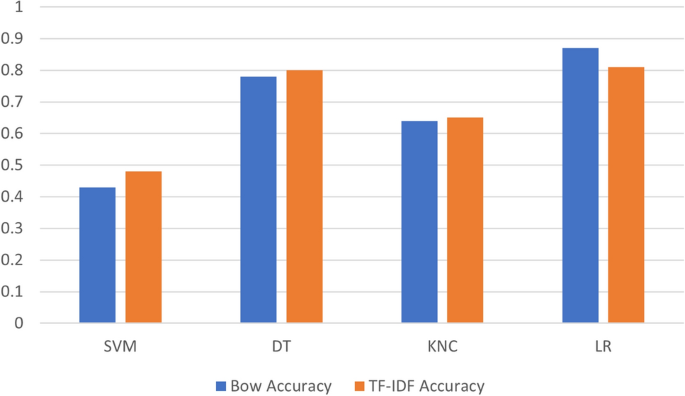
Graphical performance comparison of ML models with BOW and Tf-IDF features.
Outcomes with word embedding features
DL models’ performance comparison using the word embedding feature is represented in Table 6. The comparison illustrates that the LSTM and GRU show the most promising results, with a 94% accuracy. These models effectively capture the long-term dependencies in textual sequences and resolve gradient problems. The results are also calculated for three individual classes: class 1 denotes positive, class 2 denotes negative, and class 3 denotes neutral, and the average score of these classes is calculated. The other performance evaluation metrics, such as precision, recall, F1 score, geometric mean, Cohen Kappa score, ROC AUC score, and Brier score, show better results for LSTM and GRU. The RNN works equally well with a 93% accuracy. The RNN model showed poor results due to its large dependencies and vanishing gradient problem.
Table 6 Outcomes of DL models with word embedding features.
The graphical analysis of the applied DL models with the word embedding feature is presented by a bar chart given in Fig. 10. The models worked well with word embedding features and achieved high scores. The performance of LSTM and GRU is the same, achieving a good performance in terms of accuracy, F1 score, etc. The performance of RNN is marginally lower than these models. The word embedding feature worked well with the DL model and showed promising results.
Fig. 10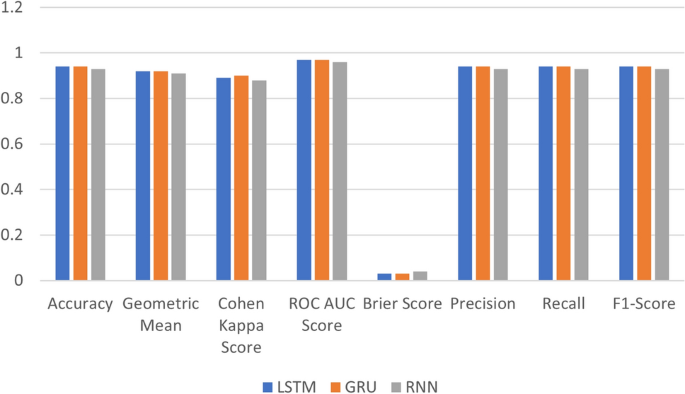
Performance comparison of DL models with word embedding features.
Results with novel transfer features
Table 7 uses the novel transfer feature engineering technique for the performance comparison of different ML models. This novel technique gets the best and combined features extracted by LSTM and DT models. The results show that LR shows outstanding performance by obtaining a 97% accuracy. These models also show the most promising performance against all three classes, as well as, their combined performance. The models also perform well concerning precision, recall, F1-score, geometric mean, Cohen-kappa-score, etc. The performance of DT, SVM, and KNC models is marginally lower than the LR model, with a 96% accuracy. These results show that the proposed novel transfer feature engineering techniques perform better with ML models compared to BoW and TF-IDF feature extraction techniques.
Table 7 Results of ML models with the proposed transfer learning features.
Figure 11 shows the performance of the applied ML model using novel transfer features. This suggests that the novel transfer features technique works well with applied ML techniques compared to other feature extraction techniques used in this study. This demonstrates that the LR model achieves the highest performance.
Fig. 11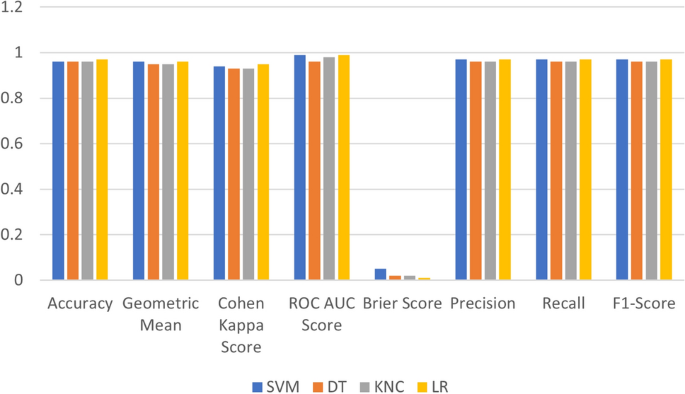
Performance comparison of ML models with proposed transfer learning features.
Achieving improved accuracy on slightly imbalanced datasets is possible using transfer features. Good results using the proposed approach can be attributed to several reasons. First, pre-trained models learn from large and diverse datasets and their representations generalize well, even in the case of minority classes61. Secondly, contrary to traditional models that overfit to the small samples, transfer features provide generalizable features that reduce the overfitting62. Thirdly, freezing layers and extracting features from a frozen backbone helps maintain feature quality. Further fine-tuning of these models on the local datasets helps maintain general feature quality even in the case of under presentation of a class. These aspects of transfer features help models get better performance which is the case in this study.
Results using proposed LGR model
The performance of the proposed hybrid LGR model (LSTM, GRU, RNN) is shown in Table 8. The results are obtained using the proposed LGR model combined with the transfer feature engineering technique. The results show that the proposed model performs better than the previous techniques discussed earlier by achieving a 99% accuracy. The other parameters like precision, recall, F1 score, Geometric mean, Cohen kappa score, ROC AUC score, and Brier scores are also better for the proposed model. The results illustrate that the proposed hybrid LGR model performs well, showing outstanding performance compared to other ML and DL models.
Table 8 Results with hybrid LGR model using proposed transfer learning features.Cross-validation results
The comparative evaluation of the proposed approach is done using K-fold cross-validation in comparison to other ML models with BOW, TF-IDF, and novel transfer features. Table 9 shows the cross-validation results. The results indicate that the LR model consistently achieves better performance with all the applied features. On the other hand, the KNC and DT models demonstrate satisfactory performance and the SVM achieved poor performance when applied with the BOW feature. The comprehensive analysis generalized the performance of models with different features. The results demonstrated that the performance of the proposed novel transfer features is better compared to other features.
Table 9 Comparison of ML models using k-fold cross-validation with different features.Computational cost analysis
The computational cost analysis of ML models provides insights into training time and is presented in Table 10. The computation cost analysis results reveal that the performance of the KNC model stands out for its efficiency with less training time using the TF-IDF feature. In contrast, the computational cost of the KNC model using the BoW feature is comparatively higher, suggesting a feature-dependent computational load. A cross-model comparison across different features finds the dominance of the proposed novel transfer feature engineering technique, demonstrating excellent computational efficiency compared to other methods. The results prove the potential of novel transfer feature engineering techniques to boost ML models’ performance by getting higher accuracy scores and less training time.
Table 10 Computational cost analysis.
Figure 12 bar chart visualizes the computational cost analysis of ML techniques compared with BOW, TF-IDF, and novel transfer features. The graph demonstrates that the novel transfer feature works effectively well with less computational cost than other features. The performance with the BoW feature is very poor, requiring higher computational time. The results conclude that the proposed novel transfer feature technique performs well with higher performance scores and less computational cost.
Fig. 12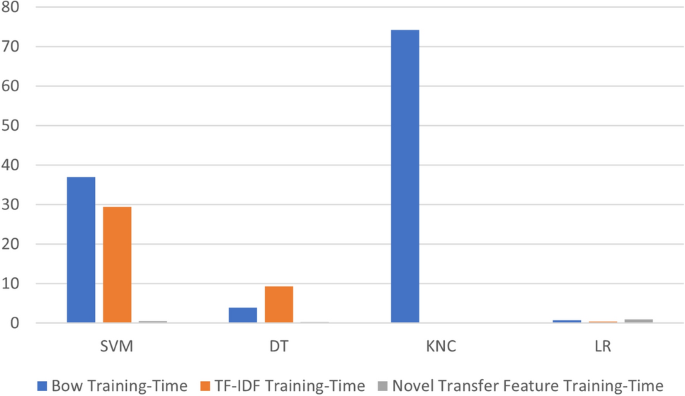
Computational cost analysis of ML models.
Statistical significance analysis
Table 11 represents a statistical significance analysis conducted to validate the performance of the proposed LGR approach compared to the applied classical approaches like SVM, DT, KNC, LR, LSTM, GRU, and RNN. The analysis is conducted using a paired t-test, p-value, and the results regarding the null hypothesis. The null hypothesis assumes that there is no significant difference between the models being compared. The paired t-test examines two models’ outcomes over numerous runs, such as accuracy, precision, recall, and F1-score, to determine if the observed difference is due to chance or indicates a genuine performance gain. The outcomes show that all comparisons had very low p-values, which resulted in the rejection of the null hypothesis in each case. This demonstrates that the proposed model’s gains are statistically significant and not the result of random chance. Notably, comparisons with LSTM, GRU, and RNN yielded infinite negative t-statistics with p-values of 0.00, indicating that the hybrid LGR model is consistently and significantly superior. This investigation strengthens our belief in the reliability and robustness of our proposed architecture.
Table 11 Statistical significance analysis of classical and proposed approaches.Error rate analysis
Table 12 represents the error rate analysis of machine learning models with TF-IDF, BOW, and proposed transfer feature extraction techniques. Models such as SVM, DT, KNC, and LR are used in this analysis. The comparisons show that the proposed transfer feature performs significantly well by reducing the error rate of applied models. The LR classifier reduced the error rate to 0.031 with the proposed transfer feature compared to TF-IDF (0.510) and BOW (0.566) error rates. Similarly, the SVM reduced the error to 0.032, which is much less as compared to classical feature extraction methods. These improvements were observed with KNC and DT. These results validate the high performance observed by our proposed transfer feature on different models with high accuracy and a lower error rate.
Table 12 Error rate analysis.Ablation study analysis
The ablation study analysis63 is performed to evaluate the contribution of the proposed approach. For the ablation study, 20% data is used for experiments. The detailed analysis includes both ML and DL models evaluated with BOW, TF-IDF, and transfer features. Table 13 shows the comparisons of ML models like SVM, DT, KNC, and LR in terms of accuracy using all three features. Outcomes represent that the models using BOW and TF-IDF do not perform well, getting an accuracy of 43% to 87%.
Table 13 Ablation study analysis of ML models.
Conversely, all models performed significantly better when we used transfer features; the accuracy ranged from 96% to 97%. The results of all the models with the transfer feature demonstrate the efficacy of the approach by extracting rich features that help in improving model performance. The outcomes of LSTM, GRU, and RNN with pre-trained word embedding and transfer features are shown in Table 14. Results represent the RNN performance improvement with transfer features from 93% to 95%, while the LSTM and GRU models increase from 94% to 96%.
These outcomes validate the design decision to employ transfer features, which improve generalization and semantic comprehension by combining contextual LST with DT. The ablation results show that the transfer feature technique greatly improves the performance of both deep learning and machine learning models. These results further demonstrate the supremacy of our integrated LGR architecture, which capitalizes on the combined strengths of LSTM, GRU, and RNN, and validates the contribution of each deep learning component.
Table 14 Ablation study analysis of DL models.State-of-the-art comparisons
Table 15 shows the comprehensive evaluation of the proposed approach with other state-of-the-art studies. We implemented and tested the proposed dataset with previous studies to ensure fair evaluation. The analysis is done with the previously published studies on the text classification domain on X (Twitter) from 2021 to 2024. The analysis demonstrates that the proposed approach outperforms by achieving a 99% accuracy score for deepfake posts sentiment analysis. This shows that the proposed approach is significantly better to achieve higher accuracy in determining the sentiments of posts on X (Twitter).
Table 15 Performance comparison with state-of-the-art studies.Practical deployment for deepfake content detection
Practical deployment of the proposed approach can help obtain the following objectives.
-
It can be used to track the emotional reactions of people toward fabricated speech on social media and other media platforms.
-
Escalation of harmful content can be carried out. For this purpose, harmful content can be detected and prioritized based on its degree of negativity.
-
The emotional response of people towards fake content can be monitored to understand the long-term psychological impact.
-
Warning systems can be defined to detect early signs of viral spread of deepfake content videos containing emotionally charged content.
Ethical considerations
This study understands ethical research practices, especially in collecting data from social media apps like Twitter67. The collected dataset preserves individual privacy and comprises tweets scraped from public sources and authenticated to protect individual privacy. The dataset does not target any personal information or any specific user at any stage of collection. The dataset is scraped against different keywords from publicly available tweets. This does not target any specific users, accounts, or other identifiers.
Furthermore, the goal of this study is to examine broad sentiment patterns related to deepfake-related content. The study complies with ethical standards for the use of digital data because all the data came from publicly available sources without any user interaction or private access. To further protect user privacy, all tweets were authenticated during preprocessing.
The collected data is anonymized and no disclosure of user identification is given in the manuscript. In addition, since the user can be identified by their geolocation, network data, etc., metadata such as geotags, user handles, etc. are not given in the manuscript.
In addition, data bias is also handled. Twitter users do not represent the global population and drawing general conclusions can be misleading. So, to mitigate data bias and representation, dataset limitations are pointed out here.
Limitations
Despite this study’s better performance and contributions, it is important to recognize the limitations to direct future developments:
-
The dataset used in this research is imbalanced, which can lead to biased learning that affects the model’s ability to perform sentiment classification.
-
The proposed hybrid LGR architecture performs well, but its high computational cost makes the model less effective for real-time applications.
-
The model has not been tested on multilingual datasets or cross-platform data, which limits the assessment of its generalizability to broader contexts.
-
Twitter data is not a representation of the global population and drawing general conclusions from the data can be misleading.
Future work
The following areas can be explored to further improve the accuracy of sentiment analysis concerning deepfake content.
-
Current approaches predominantly rely on textual data alone ignoring important information presented as emotional cures, audio, and other visuals in deepfakes. Such content can be combined with textual data to improve the detection of nuanced responses.
-
Content on social media is often accompanied by sarcasm, memes, etc. to represent sentiments. Integrating sarcasm detection with context-aware transformers can help improve the detection of deepfakes.
-
Time-series-based sentiment analysis is not investigated well, particularly concerning deepfakes. Modeling user sentiments as the user becomes aware that the content is deepfake is an important area of research.
-
Often, sentiment analysis approaches target English language and cross-lingual models are rather rare. Building cross-lingual approaches is necessary to enable global monitoring of deepfakes.
-
Improving sentiment labeling using transformer-based models and enhancing understandability in deepfake tweets sentiment analysis by incorporating explainable AI techniques is another important research domain
-
Ethics-aware sentiment analysis is very important because analyzing public comments on deepfakes related to sensitive issues like violence, sexual content may lead to unintentional amplification of harm. Human-centered AI with risk-aware interpretations can be adopted.