Trends and global distribution of malaria burdenFig. 2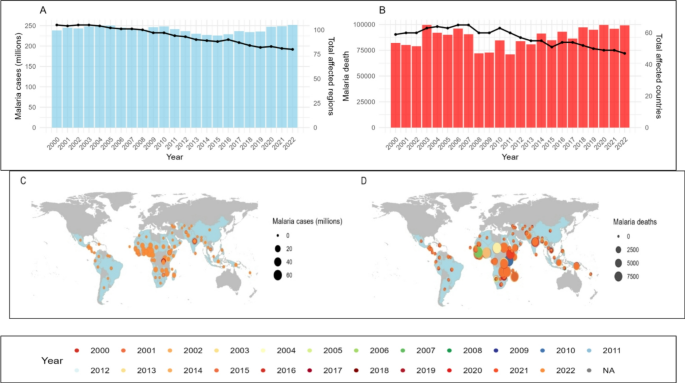
Trends in Malaria Burden (2000–2022): (A) Global malaria cases (in millions, left y-axis) and number of affected countries (black curve, right y-axis). (B) Global malaria deaths, with (left y-axis) and number of affected countries (black curve, right y-axis). (C) Geographic distribution of malaria cases (millions). (D) Geographic distribution of malaria deaths.
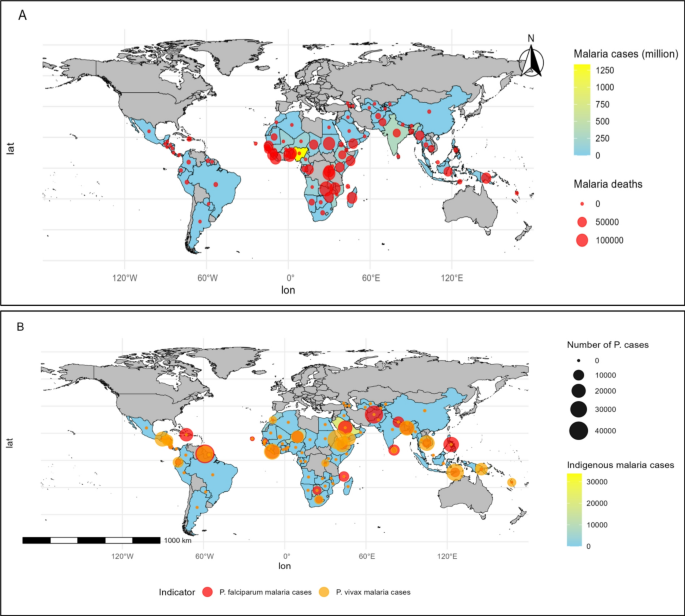
The global trends of malaria burden from 2000 to 2022 highlight fluctuations in malaria cases and deaths across different regions. The highest number of malaria cases was recorded in 2022 (251.75 million), while malaria-related deaths peaked in 2020 (99,554) (Table S3). Over the years, Nigeria (1,332.99 million) reported the highest malaria cases, followed by the Democratic Republic of the Congo (623.16 million) and India (319.83 million). Meanwhile, South Sudan (149,753), Zambia (143,546), and the Central African Republic (124,801) experienced the highest malaria-related mortality. Countries such as Burkina Faso (485.6, 194.5), Sierra Leone (404.59, 188.3), and Niger (355.45, 154.6) exhibited the highest average malaria incidence and mortality rates. Additionally, Bolivia (Plurinational State of) (41,612) and the Republic of Korea (37,169) reported the highest indigenous malaria cases, with Guyana (42,021) and Afghanistan (37,492) leading in Plasmodium falciparum cases, while Plasmodium vivax cases were most prevalent in Bolivia (Plurinational State of) (51,034) and Eritrea (44,310) (Figs. 1 and 2 and Table S3–S6).
Spatial patterns in malaria incidence and mortalityFig. 3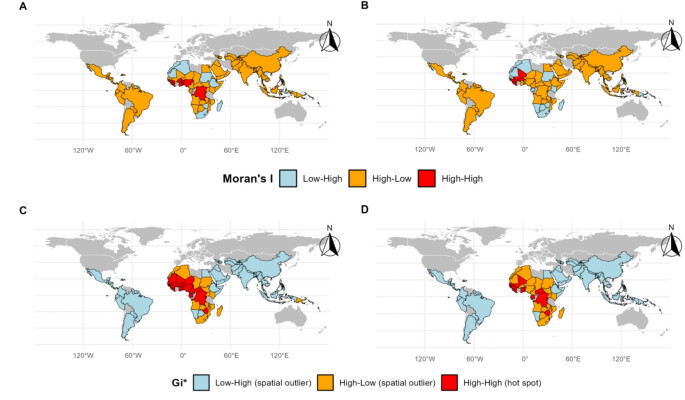
(A) Moran’s I test for malaria incidence (per 1000 population), (B) Moran’s I for mortality rates (per 100,000 population), (C) Hotspot detection for malaria incidence (per 1000 population) using Getis-Ord Gi*, (D) Hotspot detection for malaria mortality rates (per 100,000 population) using Getis-Ord Gi*.
The analysis of spatial autocorrelation using Local Moran’s I identifies statistically significant spatial clusters of malaria incidence and mortality. High-high clusters (areas with high values surrounded by other high values) for malaria incidence were observed in Burundi (1.562, p-value = 0.029), Benin (2.593, p-value 3). The Gi* statistic further identifies hotspots for malaria incidence in Benin (3.655, S6). Other regions either exhibited non-significant clustering or were identified as spatial outliers (Fig. 3).
Correlational analysis of malaria and its determinants
A notable negative correlation exists between malaria incidence and arable land (−0.64), suggesting that regions with more arable land tend to have lower malaria burdens. Life expectancy and hypertension prevalence exhibit a positive correlation (r = 0.48), whereas access to basic drinking water services is negatively associated with malaria incidence (r = −0.49). Additionally, air pollution exhibits a positive correlation with malaria incidence, while healthcare infrastructure and economic factors demonstrate mixed effects, highlighting the complex interplay of determinants in shaping the global malaria burden (Fig. S1 and Table S9).
Selecting the best model
Among the evaluated models, XGBoost demonstrated the best performance with an RMSE (0.63), R² (0.93), adjusted R² (0.92), and MAE (0.46). This significantly outperforms other models, such as the Naive Bayes model (RMSE: 2.36, R²: −0.03, adjusted R²: −0.04, MAE: 2.22) and SVM (RMSE: 1.05, R²: 0.8, adjusted R²: 0.78, MAE: 0.76). DT (RMSE: 1.31, R²: 0.68, adjusted R²: 0.65, MAE: 0.94) also showed moderate performance, while LightGBM (RMSE: 0.68, R²: 0.91, adjusted R²: 0.91, MAE: 0.5) performed well but not as strongly as XGBoost. We integrated the XGBoost model with XAI and CAI techniques to enhance interpretability and causal analysis, thus improving the reliability and transparency of our results (Fig. S2 and Table S10).
Feature importance in predicting malaria incidence and mortality
The feature importance analysis, utilizing MeanSHAP values, identifies the ten most significant variables in forecasting malaria incidence and mortality. The key features encompass the percentage of the population using at least basic sanitation services (1.003), the percentage of the population accessing at least basic drinking-water services (0.426), and population growth (0.339). Access to electricity (0.318), the percentage of agricultural land (0.132), and the number of medical doctors per 10,000 population (0.159) are also significant contributors. Further essential features are the total population (0.102), hospital bed density (0.141), air pollution (0.065), and under-5 mortality rate (0.051). These factors collectively contribute significantly to the model’s predictive capability, highlighting the intricate interaction among health outcomes, environmental variables, demographic and socioeconomic elements, and health system infrastructure concerning malaria incidence and mortality (Fig. 4 and Table S11).
Fig. 4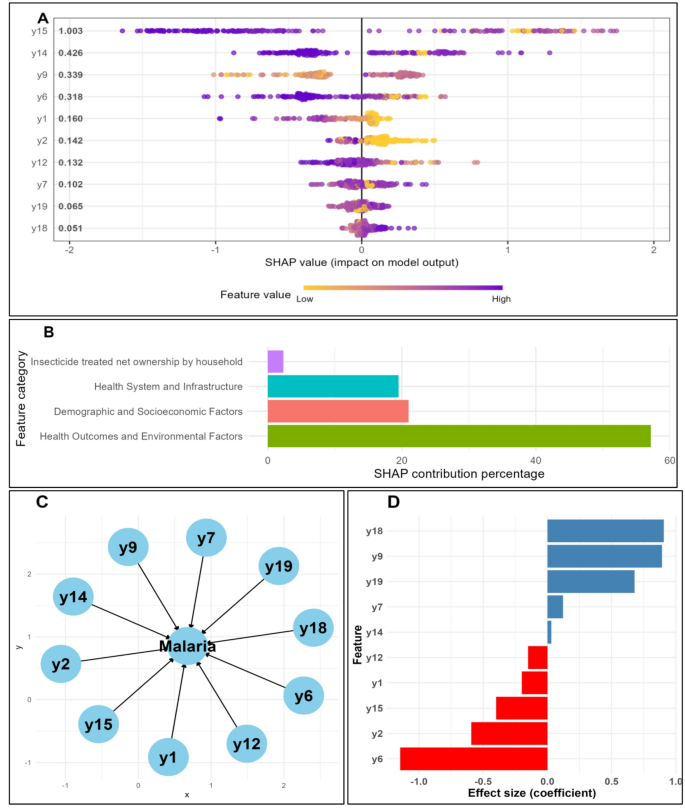
(A) Summary plot: top 10 most SHAP predicted features. (B) Ranking of the feature classes, (C) Casual relationship of the top 10 features on malaria, (D) Feature importance (using CAI); y1: Medical doctors (per 10,000); y2: Population using at least basic drinking-water services (%);; y6: GDP growth (annual %); y7: Hospital bed density (per 10,000 population); y9: Density of pharmaceutical personnel (per 10,000 population); y12: Mortality rate under 5 per 1000 live births; y14: Access to electricity; y15: Land area (sq. km); y18: Forest area (% of land area); y19: Air pollution;.
The categories contributing the most to the model’s predictive power are health outcomes and environmental factors (57.15%), followed by demographic and socioeconomic factors (20.99%) and health systems and infrastructure (19.52%) (Fig. 4 and Table S12). Structural Equation Modeling (SEM) results further emphasize the significance of these variables. The most notable factors include access to electricity (−1.145), indicating that areas with higher access to electricity tend to have lower malaria incidence. Population growth (0.892) exhibits a positive relationship, suggesting that higher population growth is associated with increased malaria incidence. The under-5 mortality rate (0.906) is also a significant predictor, with higher mortality rates linked to higher malaria incidence. Other factors, such as the number of medical doctors per 10,000 population (−0.199), hospital bed density (−0.592), and air pollution (0.678), also play crucial roles. These findings highlight the intricate interplay between health, environmental, demographic, and infrastructure factors that influence malaria incidence and mortality (Fig. 4 and Tables S13, S14).
Prediction accuracy and future trends in malaria incidence and mortality
The prediction accuracy of the model for 2022 is exceptionally high, with an R-squared value (0.969) and an Area Under the Curve (AUC) (0.834) (Table S15). These metrics confirm the model’s robustness in capturing variability and its discriminative ability for malaria incidence and mortality (Fig. 5, S3, and Table S15).
Fig. 5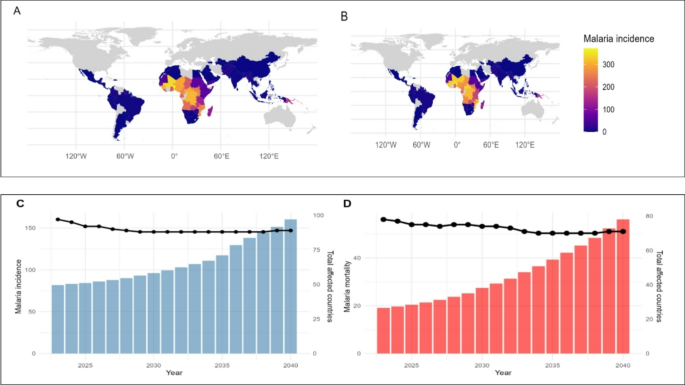
(A) Actual and (B) Predicted malaria incidence (per 1000 population) 2022, (C) Future prediction of Malaria incidence (per 1000 population) and (D) Malaria mortality (per 100,000 population) (2023–2040); left y-axis shows average mortality; right y-axis shows affected countries (black curve).
Forecasts from 2023 to 2040 indicate a concerning upward trend in malaria incidence (per 1,000 population) and mortality (per 100,000 population). The average incidence (per 1000 population) is projected to rise from 81.83 in 2023 to 160.22 in 2040, affecting an increasing number of countries. Similarly, average mortality (per 100,000 population) is expected to increase from 19.14 in 2023 to 56.12 in 2040. This escalation underscores the urgent need for intensified malaria control efforts (Fig. 5). The countries predicted to have the highest average malaria incidence (per 1000 population) for 2023–2024 are Burundi (828.52) and Solomon Islands (804.86), while Liberia (252.55) and Sao Tome and Principe (238.62) are expected to experience the highest mortality rates (per 100,000 population) during the same period (Table S16, S17). These findings provide crucial insights for policymakers and health authorities to allocate resources effectively and implement targeted interventions to mitigate the impact of malaria in the most affected regions (Fig. 5 and Tables S16, S17).