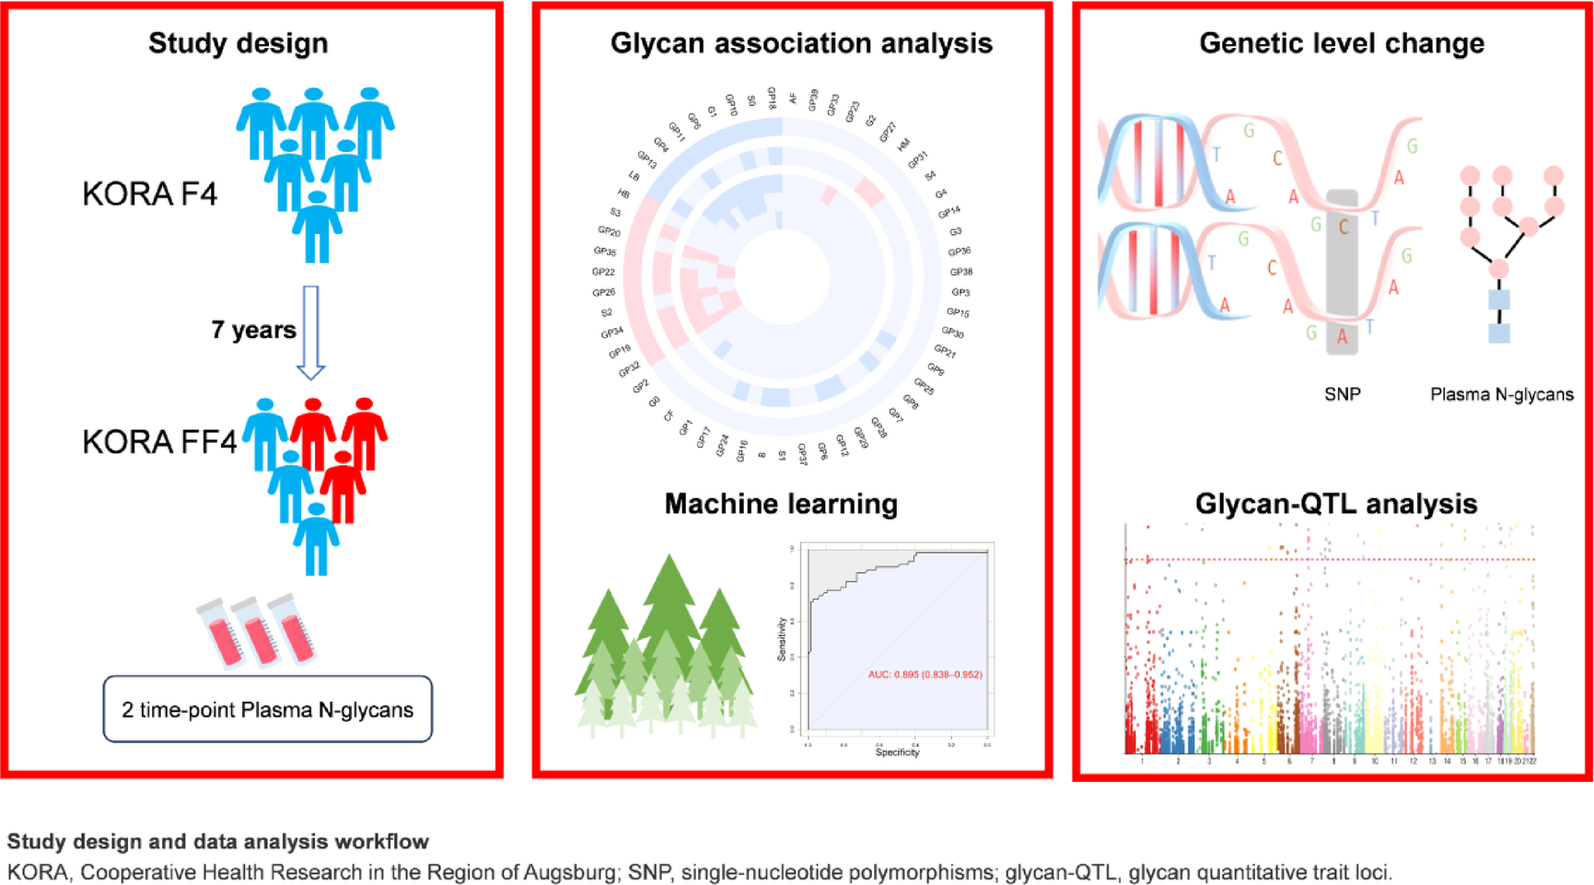
Characteristics of the KORA F4/FF4
The follow-up time for this study was 7 years. At baseline (F4), all participants were classified as NGT. Among the 473 participants in KORA FF4, 231 had prediabetes or were diagnosed with T2D, whereas 242 remained normoglycemic. In KORA F4, participants were categorized based on whether they were later diagnosed with prediabetes/T2D in FF4. Table 1 summarizes the baseline characteristics of the study participants in KORA F4, while Table 2 provides details specific to KORA FF4.
Table 1 Baseline characteristics of participants in KORA F4 (2006–2008)Table 2 Follow-up characteristics of participants in KORA FF4 (2013–2014)Associations between glycans and prediabetes/T2D
Using the HILIC-UHPLC-FLD method, we analyzed the plasma N-glycome of 473 participants at two points from the KORA F4/FF4. In addition to analyzing differences in directly measured initial glycans, we examined derived traits, which represent averages of shared glycosylation features (including the degree of glycan branching, galactosylation, sialylation, and fucosylation) across various glycan structures (Supplementary Table 1) and are calculated from the initial glycan traits (Supplementary Table 2). To identify glycan changes associated with this progression, we employed a longitudinal model to compare differences between NGT and prediabetes/T2D patients.
Out of 39 directly measured glycans and 16 derived traits, 19 glycans demonstrated statistically significant differences in the basic model (adjusted for age, sex, and BMI). Among these, GP18, S0, GP5, G1, GP13, GP10, LB, GP4, and GP11 decreased, whereas GP32, GP19, GP34, S2, GP26, GP20, GP22, GP35, S3, and HB increased in prediabetes/T2D patients (Fig. 1; Supplementary Table 3). Further adjustment for smoking status, alcohol consumption, physical activity, HDL, and SBP in the full model revealed that 12 glycans (GP32, S2, GP35, GP19, GP34, GP22, GP20, GP26 increased, and S0, GP18, G1, GP5 decreased) remained significant (Supplementary Table 4). Notably, GP32 emerged as the most significant glycan, exhibiting a strong positive association with the progression of prediabetes/T2D.
Fig. 1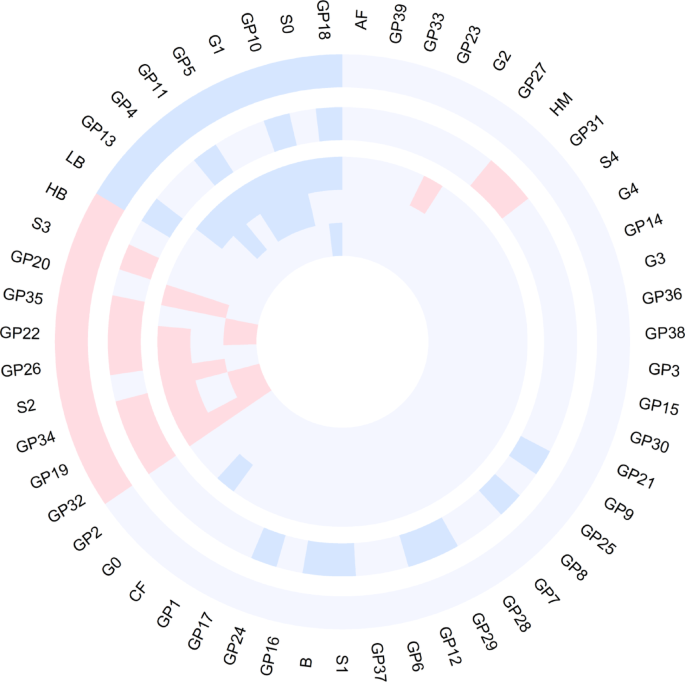
The circular plot displays glycan associations across 5 comparisons: from the outermost to the innermost circles, glycans differentiating NGT vs. prediabetes/T2D, glycans associated with BMI, glycans distinguishing NGT vs. T2D, glycans separating prediabetes vs. T2D, and glycans differentiating NGT vs. prediabetes. The red and blue segments represent positive and negative associations, respectively, with glycan names labeled around the outermost layer
Sensitivity analyses
In the sensitivity analysis, we further examined glycan differences between subgroups: NGT versus prediabetes, NGT versus T2D, and prediabetes versus T2D (Fig. 1; Supplementary Tables 5 and 6). Among the 39 directly measured glycans and 16 derived traits, distinct patterns emerged across these comparisons, indicating progressive alterations in the plasma N-glycome. For example, in the basic model, glycans such as GP32, GP19, GP22, and GP34 exhibited a consistent upward trend from NGT to prediabetes and T2D, underscoring their potential as early indicators of disease progression. Conversely, GP18 demonstrated a downward trend, particularly during the transition from NGT to prediabetes and T2D. Additionally, in the transition from prediabetes to T2D, GP32 showed a notable upward trend. In the full model, the glycans GP32, GP22, GP34, and GP18 maintained these same trends, reinforcing their relevance in the progression of glucose dysregulation.
Analysis of glycans related to diabetes traits
The LMM analysis revealed significant associations between the plasma N-glycome and BMI, as well as T2D-related traits, including FPG, HOMA-IR, and HbA1c. The inclusion of individual ID as a random effect accounted for intraindividual variability. In the basic model (adjusted for age and sex), 20 glycans demonstrated significant associations with BMI. Specifically, GP32, GP26, GP19, GP34, GP22, HM, GP35, GP31, and S3 were positively associated with BMI, whereas GP18, GP29, GP12, GP10, GP24, S1, LB, GP8, GP11, B, and GP9 were negatively associated with BMI (Fig. 1; Supplementary Table 7). Among these, 11 glycans (GP32, GP19, GP34, GP26, GP22, GP35, S3, LB, GP11, GP10, and GP18) were also associated with prediabetes/T2D in previous analyses.
Furthermore, GP26, GP32, and GP22 were significantly associated with all three T2D-related traits—FPG, HOMA-IR, and HbA1c (Supplementary Fig. 2; Supplementary Table 8). After adjusting for additional covariates, including smoking status, alcohol consumption, physical activity, HDL, and SBP, in the full model, GP32 and GP18 retained their significance for BMI, FPG, and HOMA-IR, demonstrating their robust and consistent associations with these traits (Supplementary Tables 9 and 10).
Glycan-based diagnostic modeling and explainability at FF4
Based on the KORA FF4 dataset, we developed RF models to classify glycemic status via three distinct sets of features: (1) 19 glycans associated with prediabetes/T2D; (2) 9 FORS variables, including age, sex, BMI, SBP, HDL, triglyceride (TG), parental history of diabetes, waist circumference, and FPG; (3) a combined model incorporating both 19 glycans and 9 FORS variables. Model optimization was tuned via tenfold cross-validation to determine the optimal hyperparameters. The classification performance, as assessed by the AUC, demonstrated that the glycan model yielded an AUC of 0.698 (0.603–0.793), the FORS model achieved an AUC of 0.822 (0.750–0.893), and the combined model outperformed the individual models, with an AUC of 0.895 (0.836–0.952) (Supplementary Table 11; Supplementary Fig. 3). To provide insights into the contributions of individual features within the combined model, SHAP values were calculated, which identified FPG, waist circumference, GP18, and GP32 as the most important contributors to the model’s classification accuracy (Fig. 2; Supplementary Table 12). These findings underscore the potential of integrating glycans with established clinical risk factors to enhance the diagnosis of IR/T2D.
Fig. 2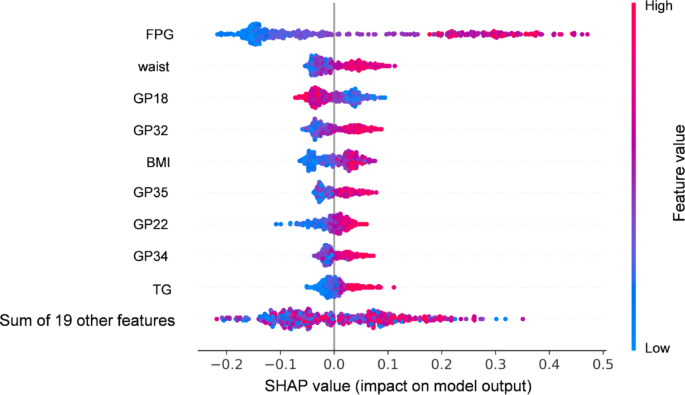
SHAP value plot illustrating the contributions of features to the RF classification model for prediabetes/T2D. The model incorporated 19 glycans and 9 FORS score components. Each point represents the SHAP value for a specific feature and its impact on the model output. The features are ranked by importance, with FPG, waist circumference, and GP18 and GP32 showing the highest contributions. Positive SHAP values indicate that higher feature values increase the probability of prediabetes/T2D, whereas negative SHAP values indicate that higher feature values act as protective factors, reducing the probability. The color gradient (blue to red) reflects feature values, with higher values in red and lower values in blue. This plot demonstrates the relative importance and direction of each feature’s association with the model classification. Abbreviations: FPG, fasting plasma glucose; BMI, body mass index; TG, triglycerides; T2D, type 2 diabetes; SHAP, Shapley additive explanations; RF, random forest
Mendelian randomization analysis
We conducted two-sample MR analysis for all glycans to explore the causal relationships between the plasma N-glycome and T2D, BMI, FPG, HOMA-IR, HbA1c (Supplementary Table 13), using glycan and derived traits GWAS summary statistics from the Twins UK dataset (n = 2763). Glycan ID mappings are provided in Supplementary Tables 14 and 15. GP19 (Wald ratio, β = − 0.208, FDR
Glycan quantitative trait loci analysis
In the KORA FF4 data, analysis was performed to identify associations between the plasma N-glycome and genetic variants, adjusting for age and sex. A total of 1,476,026 SNPs showed nominal significance (p 30], was confirmed to be associated with the plasma N-glycome. Further gene annotation revealed that GP34 is mostly associated with FUT8, RPL21P8, MIR625, and EIF1AXP2; GP18 is associated with ST3GAL4; GP22 is linked with FUT8; and GP32 is associated with ST3GAL4 (Supplementary Table 17). These findings highlight key loci and genes contributing to the genetic regulation of the plasma N-glycome.