
Rigetti Computing (NASDAQ:RGTI) is scheduled to report its earnings on Tuesday, August 12, 2025. Historically, the stock has a higher probability of a negative one-day return following its earnings report. Over the past five years, RGTI stock has experienced a negative one-day return in 57% of these instances. The median one-day loss was -6.9%, with the maximum one-day negative return being -14.6%.
For event-driven traders, historical patterns can offer an advantage. You can use this information in two ways:
- Position yourself before the earnings release, based on the historical odds.
- Position yourself after the earnings release, by analyzing the correlation between immediate and medium-term returns.
While much will depend on how the company’s results compare to analyst expectations, it is important to note that Rigetti is an early-stage quantum technology company that is not yet profitable. Analysts project that Rigetti’s Q2 results will show a contraction, with an expected revenue of approximately $1.87 million and a net loss of $0.04 per share. This represents a decline in revenue from $3.09 million in the prior-year quarter, although the net loss has improved from $0.09 per share.
Looking at fundamentals, the company’s current market capitalization is $4.5 billion. Over the last twelve months, Rigetti generated $9.2 million in revenue but was not profitable, with an operating loss of -$74 million and a net loss of -$138 million.
That said, if you seek upside with lower volatility than individual stocks, the Trefis High Quality portfolio presents an alternative — having outperformed the S&P 500 and generated returns exceeding 91% since its inception. Separately, see – The Trade Desk: Buy TTD Stock Now At $65?
See earnings reaction history of all stocks

Image by This_is_Engineering from Pixabay
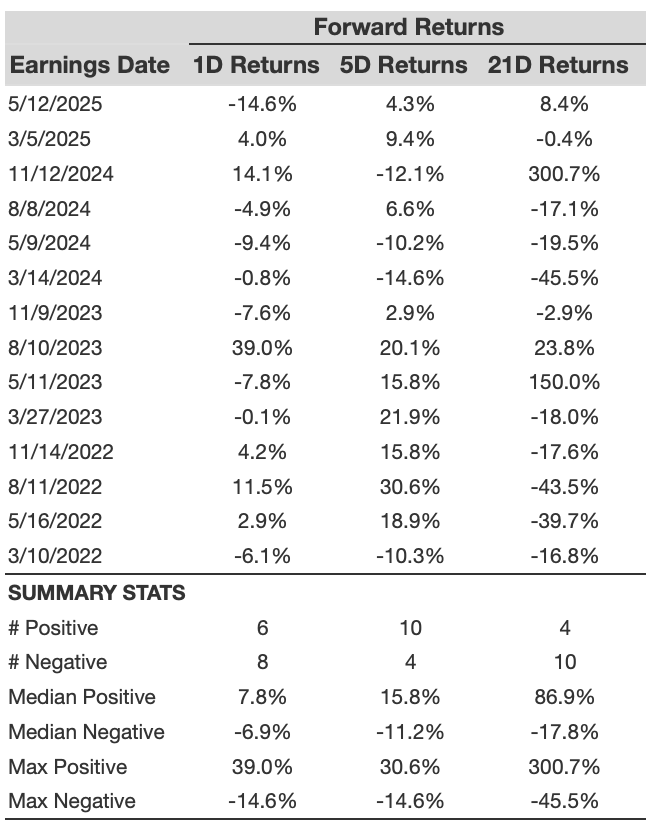
Rigetti Computing’s Historical Odds Of Positive Post-Earnings Return
Some observations on one-day (1D) post-earnings returns:
- There are 15 earnings data points recorded over the last five years, with 6 positive and 9 negative one-day (1D) returns observed. In summary, positive 1D returns were seen about 40% of the time.
- Notably, this percentage increases to 42% if we consider data for the last 3 years instead of 5.
- Median of the 6 positive returns = 7.8%, and median of the 9 negative returns = -6.9%
Additional data for observed 5-Day (5D) and 21-Day (21D) returns post earnings are summarized along with the statistics in the table below. Related – Why Is Rigetti Stock Soaring 70%?
RGTI 1D, 5D, and 21D Post Earnings Return
Correlation Between 1D, 5D, and 21D Historical Returns
A relatively less risky strategy (though not useful if the correlation is low) is to understand the correlation between short-term and medium-term returns post earnings, find a pair that has the highest correlation, and execute the appropriate trade. For example, if 1D and 5D show the highest correlation, a trader can position themselves “long” for the next 5 days if the 1D post-earnings return is positive. Here is some correlation data based on a 5-year and a 3-year (more recent) history. Note that the correlation 1D_5D refers to the correlation between 1D post-earnings returns and subsequent 5D returns. Also, see – Can Rigetti Computing Stock See Another Tenfold Increase?
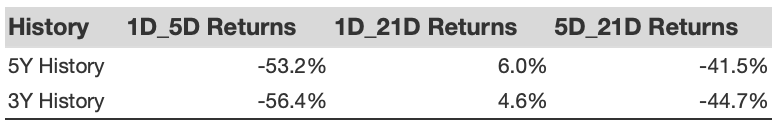
RGTI Correlation Between 1D, 5D and 21D Historical Returns
Learn more about Trefis RV strategy that has outperformed its all-cap stocks benchmark (combination of all 3, the S&P 500, S&P mid-cap, and Russell 2000), to produce strong returns for investors. Separately, if you want upside with a smoother ride than an individual stock like Rigetti Computing, consider the High Quality portfolio, which has outperformed the S&P and clocked >91% returns since inception.
Invest with Trefis Market-Beating Portfolios
See all Trefis Price Estimates