
Facebook
Twitter
LinkedIn
Reddit
Email
The federal Bureau of Labor Statistics regularly publishes a suite of reports and datasets that businesses, journalists, government agencies and the public use to understand the health of the U.S. economy. The monthly Employment Situation — sometimes called the jobs report — is one of the most widely covered.
Specifically, reporters widely cover the preliminary estimates of job gains or losses across the economy, which BLS publishes on the first Friday of each month. They’re a quick-hit indicator of whether and how the economy is growing. But less coverage goes to the revisions that follow those preliminary estimates, which are also released with each jobs report.
On Aug. 1, preliminary estimates showed the economy gained 73,000 jobs in July, a relatively low increase. The second and final revision to the May preliminary estimate showed job gains fell from 139,000 to 19,000. And the first revision to the June preliminary estimate slashed job gains from 147,000 to 14,000.
Later that day, President Donald Trump fired BLS Commissioner Erika McEntarfer, claiming on social media that the numbers in the July jobs report were “rigged,” without evidence to support that claim.
Taken together, the May and June revisions suggest about a quarter million fewer jobs gained than initially reported. Final revisions for June are scheduled for release with the Sept. 5 Employment Situation report.
In May, job gains fell 86% from preliminary to final. The last time a positive employment gain was revised down by more than half was nearly two decades ago, when the final revision put job gains at 44,000 for September 2007, down from 110,000 in the preliminary estimate.
The scale of the recent downward revisions, along with the weak figures for July, suggest job growth is not as strong as shown in preliminary estimates. In news reports, economists have blamed slower hiring on business uncertainty related to tariff policy.
The recent downward revisions were large, but revisions are normal
Revisions are part of the normal process the BLS uses to gauge job gains and losses in the U.S. in a timely way. Those estimates are based on data collected during payroll surveys that the BLS conducts of roughly 121,000 businesses and government agencies.
The surveys are voluntary, and over time the BLS collects more information. Each revised estimate is based on more information than the previous estimate, meaning that each revision is a more precise reading of employment in the U.S.
But response rates are down for the payroll surveys, from 60% in January 2020 to under 50% since May 2021. The response rate for March employment data, the most recent available, was 43%.
It is not uncommon for preliminary estimates to be revised in the final revision within a wide range, usually increasing or decreasing by up to 100,000 jobs.
Despite challenges from declining response rates and smaller BLS budgets, the average revision from preliminary to final since 2023 is a relatively modest reduction of 32,000 jobs.
The confidence interval for preliminary estimates from the payroll surveys is +/-136,000 at a confidence level of 90%, according to the Employment Situation technical notes. A confidence interval shows the range of values that are expected for the survey’s results to fall between if the survey were repeated many times.
This is another way of saying it’s highly likely that the actual number of jobs gained or lost would be within 136,000 jobs of the preliminary estimate.
It also reflects the fact that employment data comes with uncertainty. The smaller the confidence interval the more reliable the estimated number. Confidence intervals are a reporter’s window into uncertainty.
For example, the July estimate of 73,000 jobs gained came with a +/- 136,000 confidence interval. This suggests the true value is likely between 63,000 jobs lost and 209,000 jobs gained.
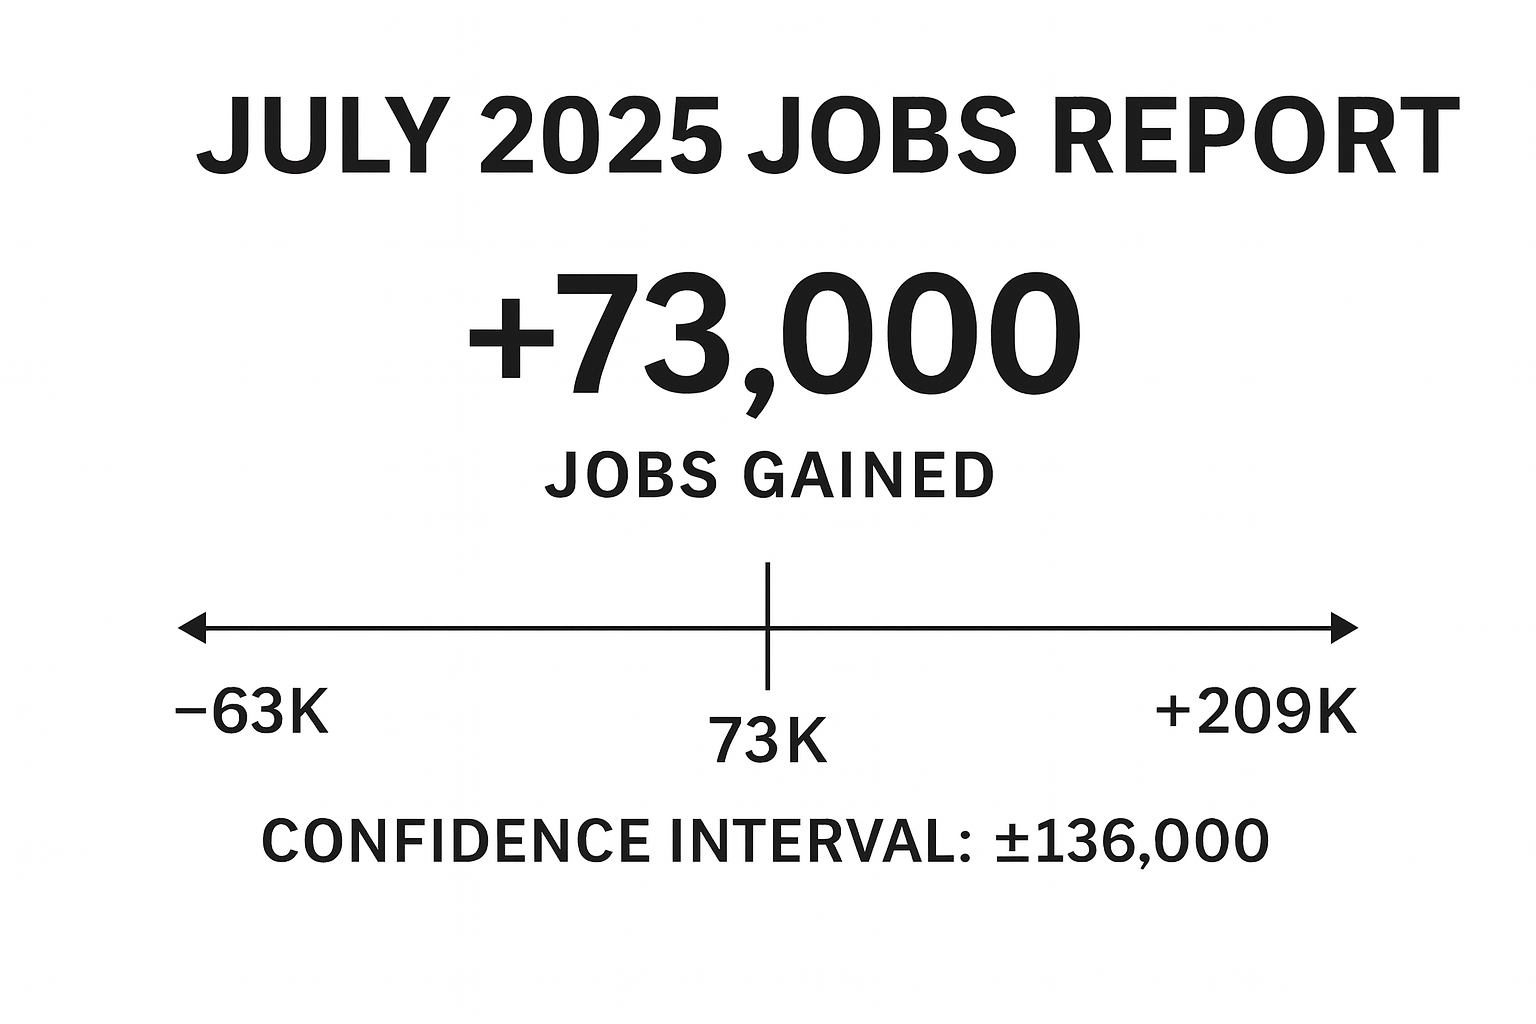
For headline or chyron writers, the low end of that range would spell catastrophe, while the high end could represent a banner month for job growth. Confidence intervals aren’t presented front and center in the monthly jobs report, but they are explained further down.
As BLS gathers more information, the confidence interval shrinks. The confidence interval for first revisions of monthly data is +/- 116,000, while the confidence interval for second revisions is +/- 115,000.
Once a year in March, the BLS also issues a benchmark revision covering the previous year, which incorporates information from state unemployment insurance tax records.
In case you’re covering revisions to jobs data, here are two charts you can share, embed or otherwise use for free, provided you follow our republication guidelines.