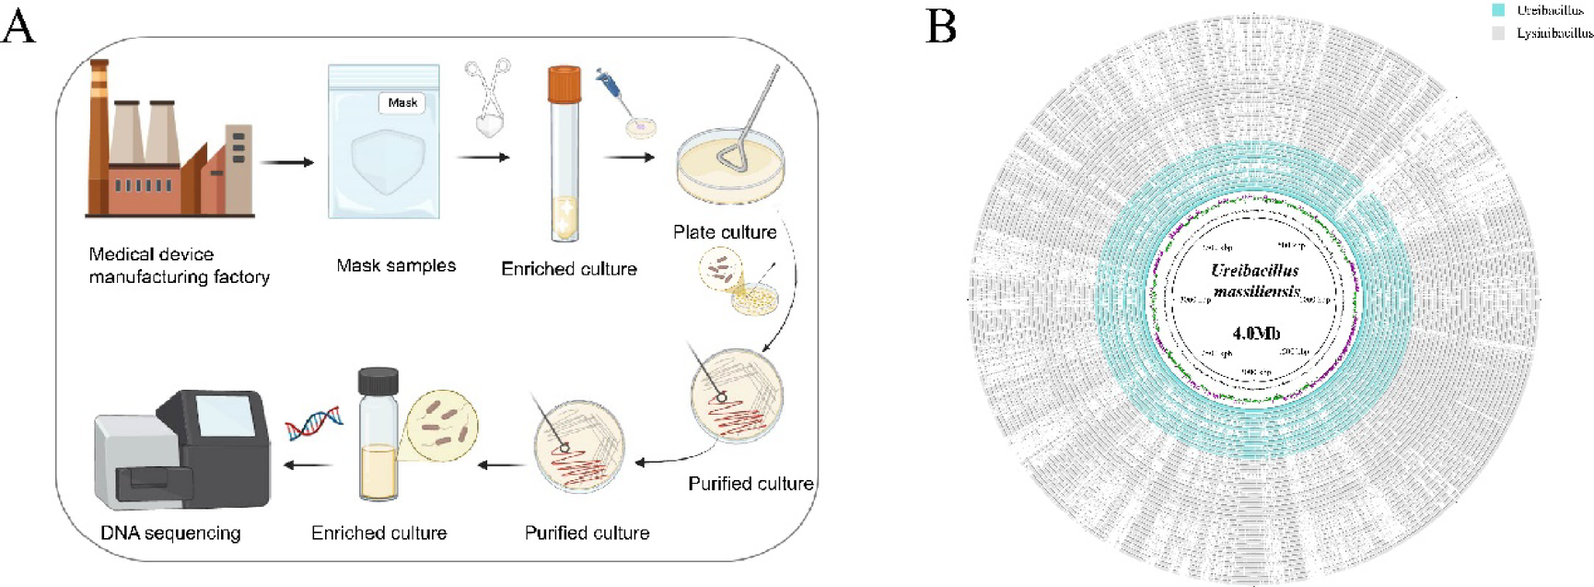
Overview of the U. massiliensis genome
In this study, we performed whole-genome sequencing and de novo assembly of a newly isolated strain of U. massiliensis. The sequencing results revealed a genome size of 4.28 Mb, comprising 254 scaffolds, with an N50 of 70 Kb and an N90 of 50 Kb. The GC content was determined to be 34.67%, and a total of 4,295 coding genes were annotated (Additional file 1). The genome completeness was assessed to be 99.34% using CheckM (version 1.2.3). To accurately determine the taxonomic position of this strain, we initially identified it as U. massiliensis using GTDB-TK. Subsequently, ANI analysis was performed by comparing its genome with that of the known U. massiliensis strain (GCF_002200855, strain number 4400831), yielding an ANI value of 97.99%. This value exceeds the 95% threshold commonly used for microbial species delineation [41], further confirming that these two strains belong to the same species. Based on these findings, we formally designate this newly isolated strain as U. massiliensis.
We retrieved the reference genome of U. massiliensis (GCF_002200855) and whole-genome data of 11 other Ureibacillus from the NCBI Genome database. The genome size of strain GCF_002200855 is 4.0 Mb, comprising 156 scaffolds, with an N50 of 130 Kb and an N90 of 100 Kb. The GC content is 34.74%, and a total of 3926 genes were annotated. At the genus level, analysis revealed that the genome sizes of Ureibacillus ranged from 2.94 to 4.05 Mb (average: 3.71 ± 0.42), with the number of scaffolds varying from 1 to 156 (average: 50.2 ± 31.63). The N50 values ranged from 0.13 to 3.49 Mb (average: 0.88 ± 1.26), and the N90 values ranged from 0.1 to 3.49 Mb (average: 0.8 ± 1.3). The GC content varies between 34.74 and 42.46% with an average of 37.1 ± 2.41% (Additional file 1 and Additional file 2). Compared to other strains within Ureibacillus, the strain B05 isolated in this study exhibits higher similarity to the reference genome in terms of genome size, GC content, and the number of predicted genes.
Whole-genome phylogenetic analysis reveals the evolutionary landscape of U. massiliensis isolates
Given the recent taxonomic reclassification of U. massiliensis from Lysinibacillus to Ureibacillus, we systematically collected a total of 38 genomes from both genera to explore their phylogenetic relationships. By constructing a whole-genome circular map (Fig. 1B), we illustrated the major genomic structural differences among Lysinibacillus, Ureibacillus, and the newly isolated strain B05. At the inter-genus level, Lysinibacillus and Ureibacillus displayed notable structural divergence. At the intra-genus level, extensive genomic variation was also observed among different Ureibacillus strains. Notably, strain GCF_002200855 exhibited high genomic structural similarity with B05, supporting their close clustering in the phylogenetic tree. Furthermore, the maximum likelihood phylogenetic tree constructed based on single-copy OGs further revealed the complexity of inter-genus evolutionary relationships (Fig. 2A). Although the overall topology clearly separated Lysinibacillus and Ureibacillus into two distinct clusters, the cross-genus subclade was formed by U. xyleni (GCF_90021779) and L. endophyticus (GCF_02415921), supported by a bootstrap value of 100%. Meanwhile, L. timonensis (GCF_90029198) clusters with Ureibacillus in Cluster II (Bootstrap 93%). The pan-genome analysis revealed that the number of orthologues shared between L. timonensis with Ureibacillus was significantly higher than that with Lysinibacillus (Wilcoxon, p = 0.027), suggesting that the taxonomic placement of this strain at the genus level may need to be reconsidered (Additional file 3). Additionally, the isolate B05 with the reference strain GCF_002200855 formed a well-supported evolutionary clade (Bootstrap 100%), sharing 3168 OGs—significantly more than with any other strains (ranging from 1693 to 2563). This strongly supports the identification of the newly isolated strain as U. massiliensis.
Fig. 2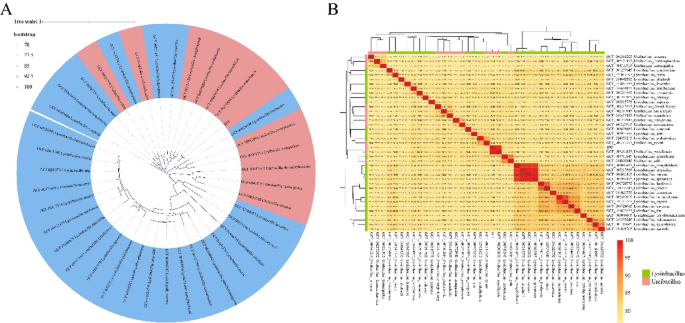
Phylogenetic analysis of Ureibacillus and Lysinibacillus. A Whole-genome phylogenetic tree based on OGs of 39 strains from the Ureibacillus and Lysinibacillus. B Heatmap displaying ANI analysis results, with different colors indicating Ureibacillus and Lysinibacillus
This study further confirmed the complexity of phylogenetic relationships through whole-genome ANI analysis (Fig. 2B). Pairwise comparisons among 39 strains revealed that the ANI values within Lysinibacillus were 80.1 ± 3.34% (n = 702), while those within Ureibacillus were 78.9 ± 2.86% (n = 132). The inter-genus ANI between Lysinibacillus and Ureibacillus dropped to 78.2 ± 1.08% (n = 648). Notably, 12 strains of Lysinibacillus were detected within the Ureibacillus cluster, showing ANI values of 76.5–90.6% with Ureibacillus, compared to 77.1–81.0% with other Lysinibacillus strains. Except for L. contaminans, L. odysseyi, L. piscis, and L. louembei, the remaining eight Lysinibacillus strains exhibited higher genomic similarity to Ureibacillus than to members of their own genus (Additional file 4).
Furthermore, we constructed a gene flow network for Lysinibacillus and Ureibacillus using PopCOGenT (Additional file 5). The results showed that strain B05 and GCF_002200855 have the highest inferred gene flow value. In addition, a certain level of gene flow was detected among L. varians, L. sphaericus, and L. tabacifolii. Analysis based on fastGEAR divided the 39 Lysinibacillus and Ureibacillus strains into five major lineages (Fig. 3A). Lineages 1 and 2 each contained only three Lysinibacillus strains, while lineage 3 was composed entirely of three Ureibacillus strains. Most strains were classified into lineages 4 and 5. Notably, lineage 5 consisted exclusively of Lysinibacillus strains, whereas lineage 4 included a mixture of nine Ureibacillus and seven Lysinibacillus strains. Ancestral recombination analysis using fastGEAR indicated evidence of recombination between lineages 4 and 5 and lineages 2 and 3, but no ancestral recombination events were detected between lineages 4 and 5 themselves. Additionally, the SNP-based population structure analysis showed the lowest CV error at K = 28 (Fig. 3B), classifying the 39 strains into 28 populations (Fig. 3C). Interestingly, L. telephonicus and U. xyleni remained clustered within the same population, as did L. halotolerans and U. galli, suggesting that these species may share close evolutionary relationships or potential genetic exchange.
Fig. 3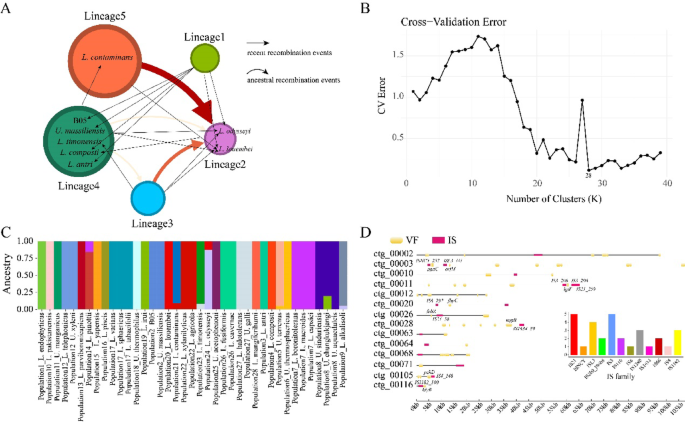
Analyses of genetic recombination, insertion sequences, and population structure in Ureibacillus and Lysinibacillus. A Simplified diagram of core genome recombination identified by fastGEAR. Nodes of different colors represent distinct lineages identified by fastGEAR, with node sizes indicating the number of strains within each lineage. Black arrows indicate recent recombination events, while curved red arrows denote ancestral recombination events. The intensity of red color reflects the magnitude of the log (BF) values. B CV error plot from population structure analysis, showing the lowest CV error at k = 28. C The population structure analysis classified the 39 strains into 28 populations, labeled as P1 to P28. D Gene position map of ISs and VFs on scaffolds annotated with both ISs and VFs, with labels for ISs and VFs within a 5 kb upstream or downstream range of ISs. A bar chart illustrates the types and quantities of all ISs annotated in strain B05
Potential pathogenic characteristics of the U. massiliensis isolate
According to the ISEScan analysis results, we identified a total of 30 IS across 24 different scaffolds. These IS elements mainly belong to the IS21, IS3, and ISL3 families (Fig. 3D). Based on VFDB database annotation, 239 VFs were identified from 407 genes in strain B05. At the primary VFs classification level, nutritional/metabolic factors (23.59%), immune modulation (18.92%), and motility (13.27%) constituted the core virulence modules (Fig. 4A). Secondary annotations (VF_id) revealed 39 flagellar synthesis-related genes (9.49%), including key components such as fliC and flgK, which are responsible for microbial motility and mucus layer penetration. Additionally, 27 genes (6.57%) were involved in capsule synthesis, which helps the microbe evade host immune responses. The HitABC iron transport system, represented by 27 genes (6.57%), allows the strain to compete for host iron resources through high-affinity iron-chelation. Furthermore, 21 genes (5.11%) were associated with lipopolysaccharide (LPS) biosynthesis. LPS is known to interact with molecules such as lectins and laminin, potentially leading to the disruption of gastric mucosal integrity, increased gut permeability, and resistance to serum killing and phagocytosis. In addition, strain B05 harbors two notable types of VFs. Laminin-binding protein (Lbp), which functions as an adhesin specific to human extracellular matrix laminin, and TTSS secreted effectors, which may be involved in facilitating intracellular entry and early survival within macrophages (Additional file 6). It should be noted that although we annotated 407 VF genes and 30 ISs in the genome, only 14 scaffolds were found to contain both VFs and ISs. Further analysis revealed that only 8 VF genes were annotated within a 5 kb upstream or downstream region of the ISs (Fig. 3D).
Fig. 4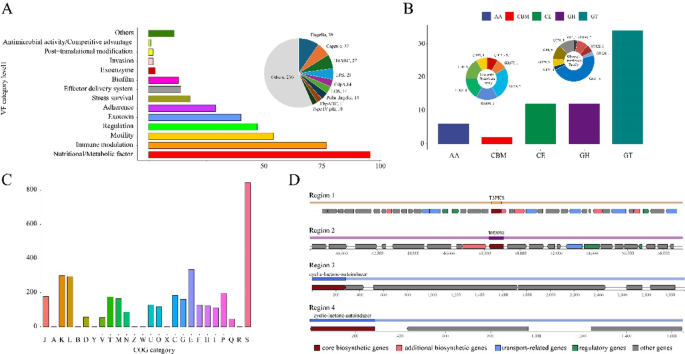
Functional map of the U. massiliensis isolate. A VFDB database annotations at multiple levels for U. massiliensis. A bar chart presents the virulence factor annotations of the newly isolated U. massiliensis at the category level1, complemented by a pie chart illustrating the distribution of VFs across different VF id levels. B CAZy database annotations for U. massiliensis. A histogram depicts the number of genes annotated to various CAZy families in the isolate. A donut chart further breaks down the counts and proportions of GH and GT family annotations within U. massiliensis. C COG database annotations for U. massiliensis. A bar chart outlines the gene classifications annotated to the COG database. D Four BGCs identified in U. massiliensis. Arrows denote the locations of genes within each BGC, with color coding used to differentiate between various gene categories
To elucidate the antibiotic resistance profile of the isolated strain, we performed a comparative analysis using the CARD database. Strain B05 was found to harbor only five ARGs. Among them, four genes were annotated as glycopeptide resistance elements, including vanY, vanT, and vanW, which confer resistance to teicoplanin and vancomycin by modifying the target site in peptidoglycan precursors. One gene, msr(G), was identified as a macrolide resistance element, which contributes to resistance against erythromycin and azithromycin. Notably, all five genes confer antibiotic resistance through the mechanism of antibiotic target alteration (Additional file 7).
Compared to strain GCF_002200855, strain B05 showed a nearly identical number of annotated VF genes, with 407 and 408 genes respectively. However, at the specific VF gene ID level, there were substantial differences between the two strains, sharing only 154 VF gene IDs. B05 possessed 35.6% (85/239) unique VF gene IDs, while GCF_002200855 had 40.5% (105/259) unique to its genome. At the VF category level 1, both strains exhibited similar functional distributions of VFs, primarily concentrated in nutritional/metabolic factors, immune modulation, and motility. However, strain B05 had a lower proportion of factors related to the effector delivery system and a higher abundance of virulence genes categorized under Others. At a more refined VF name level, Type IV pili were annotated exclusively in B05, while beta-haemolysin/cytolysin was identified only in GCF_002200855. In contrast, the annotation of ARGs showed high consistency between the two strains, with no significant differences detected (Additional file 8).
Comprehensive analysis of the metabolic potential of the isolated strain
To explore the potential metabolic functions of the isolated strain B05, a comprehensive genomic analysis was conducted. Annotation using the CAZy database revealed 66 genes related to carbohydrate-active enzymes (Additional file 9). These primarily included genes encoding glycosyl transferases (GTs, 34 genes, 51.5%), glycoside hydrolases (GHs, 12 genes, 18.2%), and carbohydrate esterases (CEs, 12 genes, 18.2%) (Fig. 4B). Notably, the GT families exhibited marked differentiation, with GT2 being predominant (47.06%), followed by GT4 and GT51 (each accounting for 11.76%). Within the GH families, 16.67% of genes were annotated as GH3. KEGG pathway annotation revealed that strain B05 possesses a complete primary metabolic system, with 2271 metabolism-related KOs (Fig. 5). Among these, amino acid metabolism (207 KOs), carbohydrate metabolism (207 KOs), cofactor and vitamin metabolism (136 KOs), and energy metabolism (101 KOs) form the core metabolic network (Additional file 10). Additionally, 199 KOs were associated with environmental information processing, including 104 involved in membrane transport and 95 related to signal transduction, suggesting a sophisticated environmental response capability. A total of 193 KOs were linked to genetic information processing, primarily involved in translation (41.97%) and replication and repair (35.75%).
Fig. 5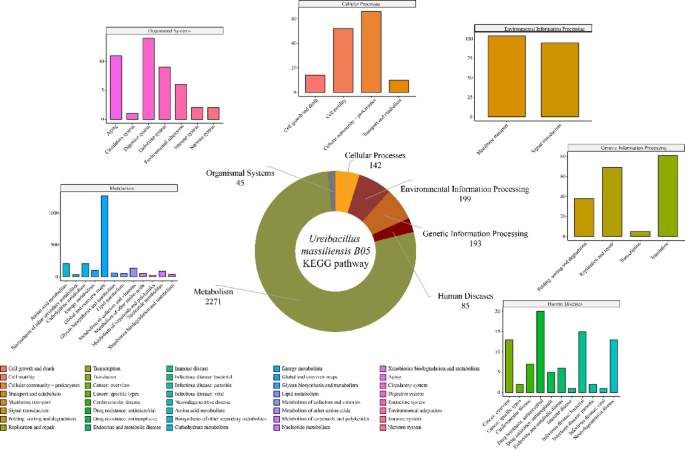
KEGG database annotation results for the U. massiliensis isolate. The donut chart displays the proportion of annotations at KEGG level 1 for the U. massiliensis isolate. Additionally, bar charts provide a detailed breakdown of the annotation results at the level 2 subcategories within each level 1 category
As COG annotations can provide insights into the overall metabolic potential of a strain, we further performed COG functional annotation of the B05 genome. The analysis revealed that 844 genes remain functional unclassified (Additional file 11). Among the annotated genes, metabolism-related functions were predominant. Notably, genes involved in amino acid transport and metabolism (336 genes, 9.09%), transcription (300 genes, 8.12%), and replication, recombination, and repair (296 genes, 8.01%) significantly outnumbering other functional categories, corroborating the findings from KEGG annotation. In contrast, genes related to cellular structure were extremely scarce, with only one gene associated with chromatin structure and dynamics and one related to cytoskeleton-related functions (Fig. 4C). Additionally, antiSMASH analysis revealed that the strain B05 possesses limited BGC diversity, with only four potential secondary metabolite synthesis clusters identified. These include one Type III polyketide synthase (T3PKS) cluster, one terpene cluster, and two cyclic-lactone-autoinducer clusters (Additional file 12). Notably, the T3PKS cluster showed 10% sequence similarity with the salecan biosynthesis cluster (BGC0001765) from Agrobacterium tumefaciens (Fig. 4D).
In terms of metabolic function, strain B05 exhibited a high degree of similarity to the reference strain GCF_002200855. Both strains are enriched in enzymes from the GH and GT families, indicating strong potential for carbohydrate metabolism. Although there are some differences in their specific distributions—for instance, B05 shows higher richness in GT enzymes, while GCF_002200855 is more enriched in GH enzymes. Further analysis founded that B05 shared 93.7% (1560) of KO categories and 88% of carbohydrate-active enzyme families with GCF_002200855, including key functional genes such as K07104 and GH3. In addition, both strains encoded numerous KO modules associated with lipases, manganese peroxidases, and carboxylesterases, suggesting they possess similar metabolic capabilities for lipid metabolism and the degradation of complex carbon sources (Additional file 8).
Degradation mechanism of microplastics by the isolated strain
Based on previous reports [25], this study further investigates the potential of strain B05 to degrade LDPE and PS. Cytochrome P450 enzymes have emerged as key targets in plastic degradation research due to their broad substrate specificity and ability to activate C-H bonds under mild conditions. Studies have confirmed that some P450 enzymes can efficiently catalyze the oxidation of alkane substrates [42, 43]. Through sequence alignment with the P450Rdb database, we identified a CYP152K6 family P450 enzyme (ctg171_1) [44] in strain B05 and GCF_002200855. This enzyme belongs to the subclass of peroxidase-dependent hydroxylase and can catalyze the hydroxylation of lauric acid (C12:O) to produce 3-hydroxylauryl acid (Additional file 13).
Given that the co-culture system of U. massiliensis and B. licheniformis has shown significant degradation capability toward LDPE and PS [25], we also annotated the genome of B. licheniformis using the P450Rdb database. A total of seven potential P450 enzyme genes were identified, including the O08336 family enzyme capable of catalyzing the conversion of RH to ROH and the U5U1Z3 family enzyme responsible for oxidizing valencene (C15H24) into nootkatol (C15H24O) (Additional file 12). The functional complementarity among these P450 enzymes may underlie the molecular basis for the enhanced plastic degradation observed in the co-culture system. In addition to the P450 enzyme systems, we identified 19 lipases, 9 manganese-containing enzymes, and 5 carboxylesterases in the genome of strain B05, all of which have been reported to participate in microplastic degradation (Additional file 14) [45,46,47]. Furthermore, the isolated strain exhibits potential for aromatic ring cleavage, gene ctg56_16 encodes catechol 2,3-dioxygenase (K07104), which catalyze the transformation of 3-vinylcatechol and catechol into 2-hydroxy-6-oxoocta-2,4,7-trienoate and 2-hydroxymuconate semialdehyde, thereby accelerating the degradation of PS.